CONTRIBUTION OF THERMAL-HYDRAULICS SIMULATION TO CRITICALITY ANALYSIS OF A DEBRIS BED NUMERICAL MOCK-UP
←
→
Page content transcription
If your browser does not render page correctly, please read the page content below
EPJ Web of Conferences 247, 06010 (2021)                                                               https://doi.org/10.1051/epjconf/202124706010
PHYSOR2020

               CONTRIBUTION OF THERMAL-HYDRAULICS SIMULATION TO
              CRITICALITY ANALYSIS OF A DEBRIS BED NUMERICAL MOCK-UP

                                        P. Boulard1 J-C. Jaboulay1, J-M. Martinez2, A. Zoia1
          1
           DEN-Service d’études des réacteurs et de mathématiques appliquées (SERMA), CEA, Université Paris-
                                        Saclay, F-91191, Gif-sur-Yvette, France
              2
               DEN-Service de thermo-hydraulique et de mécaniques des fluides (STMF), CEA, Université Paris-
                                         Saclay, F-91191 Gif-sur-Yvette, France

              paul.boulard@cea.fr , jean-charles.jaboulay@cea.fr , jean-marc.martinez@cea.fr , andrea.zoia@cea.fr

                                                                   ABSTRACT

                  In this work, we evaluate the impact of simulating the thermal-hydraulics feedback in
                  criticality risk assessment in a benchmark configuration corresponding to a simplified debris
                  bed. We have recently discussed the coupling of the multi-phase thermal-hydraulics code
                  MC3D with a reactivity evaluation scheme based on multi-point kinetics, which paves the way
                  towards the assessment of the system behavior in terms of energy release. In this work, we
                  analyze the system reactivity as a function of the thermal-hydraulics state of the system. For
                  our investigation, we have considered a simplified cylindrical region and assumed that the fuel
                  particles in the mixture consist of spheres of small diameter. The power has been adjusted to
                  be representative of nuclear decay heat. For most of the examined configurations, the
                  maximum reactivity lies below zero, which shows that the occurrence of a criticality event is
                  likely to be excluded, thanks to the contribution of the decay heat of the fuel.

         KEYWORDS: Re-criticality, debris bed, multi-physics, APOLLO2, Neural networks

                                                            1. INTRODUCTION

         The accident that occurred at the Fuskushima Daiichi nuclear power plant has stimulated a gain of interest
         in the criticality of heterogeneous mixtures composed of fuel and water. So far, most of the criticality
         assessments were done in un-coupled conditions [1 - 2]: the recent coupling of a debris-bed coolability code
         with neutron kinetics [3] has opened new strategies to evaluate the system criticality, especially when
         diphasic conditions are met in the water. This papers aims at assessing the impact of adding thermal-
         hydraulics feedbacks to the criticality evaluation of a simplified debris bed model.

         For this purpose, the chosen benchmark configuration is a simplified debris bed composed of 80 t of fully
         oxidized fuel with an 235U enrichment of 2.4% (beginning of cycle) and a density equal to 8000 kg/m3,
         flooded with un-borated water. A spherical debris shape is assumed, with a uniform diameter of 3 mm. Our
         investigation focuses on the impact of thermal-hydraulics simulation, considering non-negligible
         volumetric heat in the debris. The system is in a cylindrical shape, so that the neutronics and thermal-
         hydraulics mesh used in this work are in 2 dimensions following R axis and Z axis (see Fig, 1). The neutron
         transport code APOLLO2 [4] was used to compute the reactivity of the system (in pre-calculation and
         validation). The thermal-hydraulics code MC3D [5] was used to estimate the void fraction field in the debris

  © The Authors, published by EDP Sciences. This is an open access article distributed under the terms of the Creative Commons Attribution License 4.0
  (http://creativecommons.org/licenses/by/4.0/).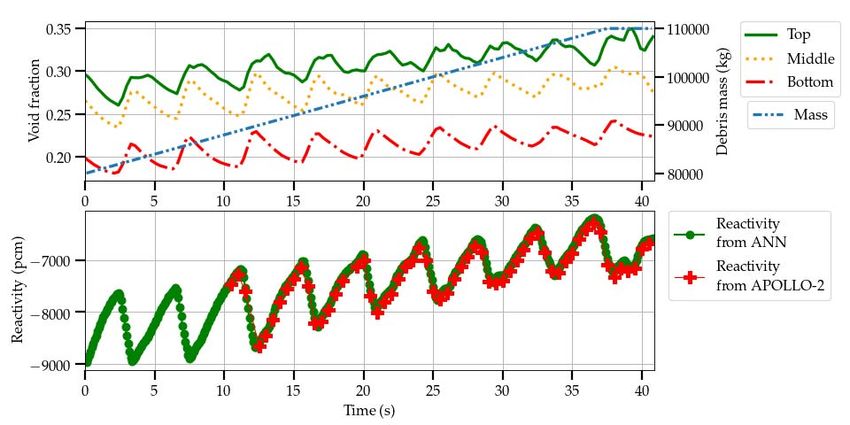
EPJ Web of Conferences 247, 06010 (2021) https://doi.org/10.1051/epjconf/202124706010
PHYSOR2020
bed during the coupled simulation. The porosity field within the debris bed was determined by MC3D pre-
calculations (as detailed in the following).
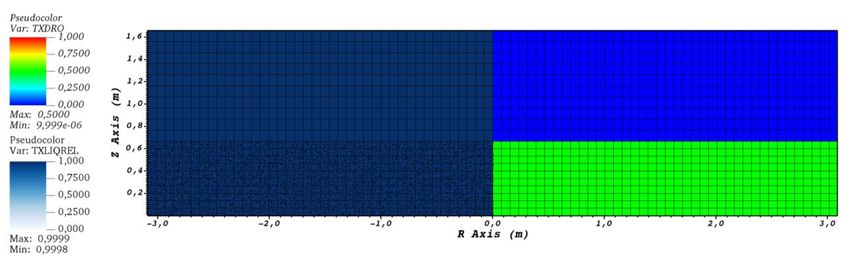
Figure 1: Scheme of the benchmark configuration for the cylindrical debris bed.
2. MODEL DESCRIPTION
2.1. Heat and mass transfers in the MC3D model
The temperature in the fuel debris is determined thanks to a finite-volume method solving heat diffusion
equation, the debris being considered as perfect spheres. The debris bed is a porous medium, where the
water flow (in the form of liquid or steam) drives the void fraction field. The MC3D code, devoted to
simulating fuel-coolant interaction at low pressure, is here used to compute the void fraction field in the
debris bed. The void fraction is measured by taking the ratio of water in the spatial cells; 60 cells are used
to provide the void fraction to the neutronics mesh. Fuel debris are agglomerated on a large cylindrical
surface. MC3D is used to pre-calculate the porosity field within the numerical debris bed. We simulate the
behavior of the debris heated by a volumetric power ranging from 0.6 MW/m3 to 1.4 MW/m3. Water (close
to saturation temperature) flows into the system to cool the debris.
2.2. Use of ANN to assess the reactivity
A detailed neutronics model is necessary to accurately evaluate the reactivity of the system, as shown in
[3]. The spatial mesh has 10 cells in the R direction and 3 cells in the Z direction. The axial cells allow
taking into account (albeit approximately) the axial void fraction profile. In order to overcome the
computational cost of such detailed models, in this work we have explored the possibility of using Artificial
Neural Networks (ANN) to approximate the neutron field. The URANIE library [6], which is a statistical
tool developed at CEA, was used in order to develop the ANN.
The ANN inputs are 31: the first 30 inputs correspond to the water density in each cell, and the last one to
the height of the debris bed. The inputs for the moderator density maps were generated by using standalone
MC3D simulations, in conditions relevant to the present case (as reported in Tab. I). The training database
was built using detailed neutron transport simulation results based on the APOLLO2 model. The density
map is provided as an input to the neutronics calculation, and the resulting reactivity is recovered as an
output. Many ANN were created, changing the number of neurons, neuron layers, initializations, etc. For
this kind of simple problem (31 inputs and 1 output), deep-neural networks are not needed and a shallow
neural network with 20 neurons yields already excellent results (deep neural networks corresponds to a
neural network composed of more than one layer whereas shallow neural networks are composed of only
one layer [7]). The best trained ANN yields results that are good enough for our needs: the statistics on
training data of the best-trained ANN correspond to a standard deviation of 25 pcm and a quantile
containing 98% of the points equal to 70 pcm.
2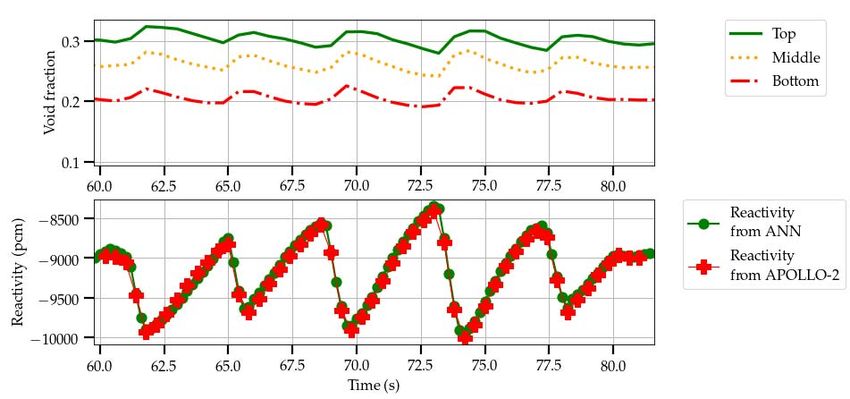
EPJ Web of Conferences 247, 06010 (2021)                                              https://doi.org/10.1051/epjconf/202124706010
PHYSOR2020

                                           3. CRITICALITY RISK ASSESSMENT

         3.1.     Methodology

         In order to assess the criticality of the benchmark for the debris bed, a constant volumetric power
         (representative of nuclear decay heat) is set in the fuel debris, in a range from 0.6 MW/m3 to 1.4 MW/m3.
         The pressure is set in a range from 1.0×10⁵ Pa to 4.9×10⁵ Pa. For each pair of values for pressure and
         volumetric power used in this work (see Tab. I), a time-dependent simulation is run, so as to explore the
         possible behavior of the void fraction map in the system.

         The ANN has been adopted for a fast and reliable reactivity evaluation. However, in order to verify the
         ANN results, APOLLO2 simulations were carried out regularly (as shown in Fig. 5 and 6), so as to ensure
         that the ANN prediction error does not bias our conclusions.

                                           Table I: Used values of pressure and power.

                                            Pressure (Pa) Volumetric power (MW/m3)
                                              1.0×10⁵                0.6
                                                       5
                                              2.0×10                 0.8
                                                       5
                                              3.0×10                 1.0
                                              4.0×10⁵                1.2
                                                       5
                                              4.9×10                 1.4

                                             Figure 2: Data exchange methodology

         The simulation scheme is presented in Fig. 2. The inputs are the water density and the porosity distributions
         and the material composition. Pre-calculations using MC3D (with different volumetric power) show that
         the porosity profiles have always the same shape, unlike the water density profiles. The initial state of the
         debris bed is shown in Fig. 3. The simulations are designed to attain the stable state of the debris bed at
         long time; this corresponds to a debris bed with a low porosity at the bottom and higher porosity at the top,
         as shown in Fig. 4. The porosity is axially averaged to fit in the neutronics mesh; the value of the porosity
         set is equal to 0.334 at the bottom, 0.409 in the middle and 0.489 at the top of the debris bed model. Thanks
         to this stable porosity profile, the neutronics calculation (using APOLLO2) depends on the water density
         map only. As described in Sec. 2.2, a training database consisting in the values of the moderator density in

                                                               3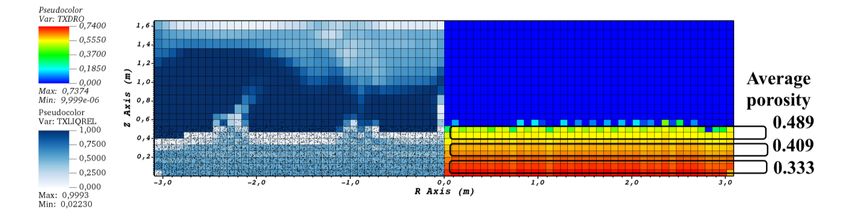
EPJ Web of Conferences 247, 06010 (2021)                                                  https://doi.org/10.1051/epjconf/202124706010
PHYSOR2020

         the spatial cells, the height of the bed, the power profile in each cell and the associated reactivity was created
         to train the ANN.

            Figure 3: MC3D pre-calculation model at time t = 0 s: debris ratio on the right and local liquid
                                             water ratio on the left

          Figure 4: MC3D pre-calculation model at t = 180 s: debris ratio on the right and local liquid water
                                                 ratio on the left

         3.2.     Results and discussion

         Figure 5 presents the results obtained with the power set at 0.6 MW/m3 and the pressure set at 4.9×10⁵ Pa.
         The verification of the ANN is performed with APOLLO2, regularly during the simulation. The average
         void fraction corresponding to three (vertically cut) slices of the debris bed is illustrated in Fig. 5 (top): the
         void fraction is higher in the upper part of the debris bed. Although the reactivity of the ANN is not perfectly
         fitting the APOLLO2 reactivity (Fig. 5, bottom), the ANN is still reliable and predicts reasonably well the
         reactivity behavior within a large domain of void fraction profiles (the maximum difference is around
         102 pcm). The maximum observed difference may be considered as the accuracy limit of the ANN. The
         results shown in Fig. 5 (bottom) correspond to the parameters that yield the maximum reactivity.

                                                                 4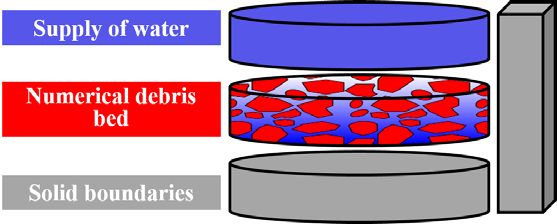
EPJ Web of Conferences 247, 06010 (2021)                                             https://doi.org/10.1051/epjconf/202124706010
PHYSOR2020

              Figure 5: Top: Behavior of the void fraction. Bottom: validation of the ANN with respect to
                                APOLLO2 for the evolution of the system reactivity.

                                           Table II: Summary of the simulation results

                                                    Maximum reactivity (pcm)
                                                          Volumetric power (MW/m3)
                      Pressure
                                           0.6          0.8           1.0          1.2             1.4
                        (Pa)
                      1.0×10⁵          -12854         -15568        -18815        -21656         -23071
                      2.0×10⁵          -10695         -12225        -13770        -15126         -17370
                               5
                      3.0×10           -9661          -10975        -12295        -12848         -14498
                               5
                      4.0×10           -9110          -9952         -11250        -12505         -13512
                               5
                      4.9×10           -8344          -9963         -10965        -12029         -13127

         The results of the simulations corresponding to the regimes detailed above are summarized in Tab. II. The
         maximum reactivity value (-8344 pcm, which is still safely below zero) is obtained for a power of
         0.6 MW/m3 and a pressure of 4.9×10⁵ Pa. The lowest reactivity values are obtained at the maximum
         volumetric power for each pressure value. Furthermore, the higher the pressure, the higher becomes the
         reactivity corresponding to the same power level.

         In order to evaluate the number of days after the reactor scram that would correspond to a volumetric decay
         heat power of 0.6 MW/m3, we have resorted to the El-Wakil equation [8]:

                                                  () =  × 0.095 ×  . ,                                     (1)

                                                                5
EPJ Web of Conferences 247, 06010 (2021) https://doi.org/10.1051/epjconf/202124706010
PHYSOR2020
where () is the volumetric power density in the debris, the nominal volumetric power density (we
assume here 1.75×10⁸ W/m3, which corresponds to 100% nominal power of a nuclear reactor of a capacity
of 900 MWe). The value of the nominal volumetric power density was corrected knowing the difference
between the intact fuel density (10500 kg/m3) and the degraded fully oxidized fuel density (8000 kg/m3).
Assuming an equivalence between the volumetric heat and the decay heat after a nuclear reactor scram as
described in equation (1), the debris bed would be sub-critical thanks to the steam created by the decay
heat; the value of 0.6 MW/m3 corresponds to about 7 days after scram. In the Sect. 3.3 we try to find the
critical value of decay heat. In the context of a severe accident, this would mean that shortly after the
beginning of the accident the probability of having a critical debris bed will be likely negligible thanks to
the contribution of the decay heat.
Figure 6: Top: Void fraction with increasing debris mass. Bottom: validation of the ANN with
respect to APOLLO2 for the evolution of the system reactivity.
3.3. Exploration of the critical values for mass and power
We have tried to determine the critical mass in the most severe conditions met in our benchmark (4.9×10⁵
Pa and 0.6×10⁵ MW/m3) and the critical volumetric power corresponding to a mass of 80 t and a pressure
of 4.9×10⁵ Pa. These results are crucial for the criticality assessment. To find the critical mass, the debris
bed mass was increased during the simulation: the corresponding results for a mass variation from 80 to
110 t are illustrated in Fig. 6. The void fractions are given for the three different positions in the debris bed.:
at the bottom, in the middle and at the top. Despite the mass increase, the void fraction profile (higher in
the upper part and lower in the bottom part) does not change. The reactivity follows the same trend and the
maximum value attains – 6184 pcm. Thus, the debris bed is still sub-critical; for these conditions, a critical
mass cannot be found. This can be explained by the fact that the heat flux extracted at the top of the
configuration increases when the mass of the debris bed is increased. Therefore, despite the positive effect
on reactivity of adding mass, the higher void fraction needed to extract more heat prevents the reactivity
6EPJ Web of Conferences 247, 06010 (2021) https://doi.org/10.1051/epjconf/202124706010
PHYSOR2020
from further increasing. Moreover, the void fraction is higher in the upper part of the debris bed model; yet,
the upper part of the configuration is the one bringing the highest contribution to reactivity, thanks to a
higher porosity.
The results of the search of the critical volumetric power are explained here. The mass of the debris bed is
set at 80 t. The power density values explored in our search are very low, and the search was halted (i.e.,
criticality was not reached) when the value of 0.05 MW/m3 was attained; the maximum reactivity value in
this condition is equal to -2765 pcm. According to equation (1), and using the same assumptions as above,
such value of power density may be obtained after more than 100 days after the reactor scram. This value
is closer to dismantle accident case than severe accident case. Still, care must be taken since the El-Wakil
model may be not valid for times long enough for this low power density to be attained.
For the sake of completeness, we observe that in fully flooded conditions, i.e. without thermo-hydraulics
coupling (which corresponds to a water density equal everywhere to 948 kg/m3) the benchmark
configuration of the debris bed model would be supercritical (the corresponding critical mass value is about
76 t).
4. CONCLUSIONS
In this work we have examined the impact of thermal-hydraulics feedback on the criticality assessment for
a benchmark configuration corresponding to a debris bed. The porosity profile and water density profiles
were determined by using MC3D pre-calculations. Reactivity was estimated with artificial neural networks
trained by using the neutron transport code APOLLO2. The analysis shows that our 80 t debris bed model
is subcritical as long as volumetric heat is higher than 0.05 MW/m3, which would correspond to more than
100 days after shutdown, according to the El-Wakil law. The methodology developed in this work might
be extended to the analysis of severe accidents: the thermal-hydraulic conditions in the debris bed due to
fuel decay heat, taken a few days after the accidental event, might strongly reduce the possibility of a
criticality risk.
ACKNOWLEDGEMENTS
The authors wish to thank MC3D development team for their support.
REFERENCES
1. Freiría López, M., Buck, M. & Starflinger, J. “Neutronic modeling of debris beds for a criticality
evaluation,” Annals of Nuclear Energy 130, 164–172 (2019).
2. Darnowski, P., Potpaczyk, K. & Świrskia, K. “Studies on the Recriticality Potential during Fukushima
Unit-3 Core Reflooding,” Proceedings of ERMSAR, Warsaw, Poland, May 16-18 (2017).
3. Boulard P; Jaboulay JC., Martinez JM. & Zoia A. “Simulation of transients in fuel-water mixtures,”
Proceedings of ICAPP, Juan-les-pins, France, May 12-15 (2019).
4. Sanchez R. et al., “APOLLO2 year 2010,” Nucl. Eng. and Tech.,” 42, 5, (2010).
5. Raverdy, B., Meignen, R., Piar, L., Picchi, S. & Janin, T. “Capabilities of MC3D to investigate the
coolability of corium debris beds,” Nuclear Engineering and Design 319, 48–60 (2017).
6. “Uranie library,” https://sourceforge.net/projects/uranie/ (2019).
7. Rumelhart, D., Hinton, G. & Williams, R. “Learning representations by back-propagating errors,”
Nature 323, 533–536 (1986).
8. M.M. El-Wakil Nuclear Heat Transport International Textbook Company (1979).
7You can also read