Contribution to the hydrogeology of Six Hills sandstone aquifer in East El-Oweinat area, south Western desert, Egypt
←
→
Page content transcription
If your browser does not render page correctly, please read the page content below
DOI: 10.7343/as-2019-378 Paper
Contribution to the hydrogeology of Six Hills sandstone aquifer in East
El-Oweinat area, south Western desert, Egypt
Contributo sull’idrogeologia dell’Acquifero arenario di”Six Hills”, nella zona di East El-Oweinat,
deserto sud-occidentale, Egitto
Saad Younes Ghoubachi
Riassunto: L’area di El-Oweinat si trova nel sud-ovest dell’Egitto Per studiare una gestione sostenibile dei prelievi di acqua è stato
ed è considerata uno dei nuovi progetti di bonifica del territorio condotto uno studio utilizzando il codice MODFLOW. Sono sta-
nel deserto occidentale. L’Acquifero Arenario Nubiano ha un’alta ti considerati quattro scenari. Fra gli scenari presentati, il quar-
capacità e una buona qualità delle acque sotterranee. I risultati di to risulta essere quello più adeguato a garantire la sostenibilità
studi geologici e idrogeologici hanno dimostrato che l’acquifero dell’uso della risorsa idrica sotterranea mantenendo il tasso di
di Six Hills rappresenta l’unica risorsa idrica sotterranea utiliz- abbassamento della quota piezometrica intorno allo 0.66 m/anno
zata a tutti gli effetti (agricoltura, acqua potabile, allevamento riducendo l’attuale prelievo (pari a 10,000 m3/giorno per pozzo)
domestico e pollame) nell’area di East El-Oweinat e sovrasta di- di circa il 40%.
rettamente il basamento Precambriano. La falda acquifera si tro-
va in stato non confinato e le sezioni idrogeologiche mostrano che
lo spessore saturo della falda acquifera oscilla tra 150.2 e 651 m e
aumenta verso ovest. La direzione del flusso è verso nord-est con
un gradiente idraulico medio dello 0,6‰. La capacità calcolata
della falda nella zona di East El-Oweinat (4.340 km2) raggiunge
350 miliardi di metri cubi di acqua dolce.
Il confronto della fratimetria nei stessi pozzi di monitoraggio Abstract: El-Oweinat area is located in southwestern Egypt and is
durante 14 anni (2003 e 2016) rivela che l’abbassamento piezo- considered to be one of the new land reclamation projects in the Western
metrico è compreso tra 5 cm/anno e 80 cm/anno. Il tasso di pom- Desert. The Nubian Sandstone aquifer has high potentiality and good
paggio è aumentato da 600.000 m3/giorno nel 2003 a 3.600.000 groundwater quality. The results of geologic and hydrogeologic studies
m3/giorno nel 2016. La trasmissività media raggiunge i 2.060 reveal that the Six Hills sandstone aquifer represents the sole groundwa-
m2/giorno, riflettendo l’alto potenziale della falda acquifera di ter resource used for all purposes (agriculture, drinking, domestic, live-
arenaria nella zona di East El-Oweinat. stock and poultry) in East El-Oweinat area. The Six Hills sandstone
aquifer overlies directly the Precambrian basement rocks. The concerned
aquifer exists under unconfined conditions as it is exposed on the surface.
The hydrogeological cross sections show that the fully saturated thickness
of the Six Hills sandstone aquifer ranges between 150.2 m and 651
Keywords: hydrogeology, Six Hills sandstone aquifer, El-Oweinat area. m and increases towards the west. The groundwater generally flows
towards the northeast direction with an average hydraulic gradient of
0.6 ‰. The calculated groundwater volume of the Six Hills sandstone
Parole chiave: idrogeologia, acquifero arenario di Six Hills, El-
Oweinat.
aquifer in East El-Oweinat area (4,340 km2) reaches 350 bcm of fresh
water.
The comparison of the depth to water in the same monitoring wells dur-
ing 14 years (2003 and 2016) reveals that the head decline rate in
groundwater depths were ranging between 5 cm/year and 80 cm/year.
Saad Younes GHOUBACHI The pumping rate increased from 600,000 m3/day in year 2003 to
Geology Dept., Division of Water Resources, Desert Research Center 3,600,000 m3/day in 2016. The average transmissivity attains 2,060
Cairo, Egypt
Ghoubachi66@yahoo.com
m2/day reflecting the high potential of the Six Hills sandstone aquifer
in East El-Oweinat area.
The groundwater flow model (MODFLOW) has been used to investigate
the impact of groundwater withdrawal on groundwater levels for sustain-
able groundwater management. Four scenarios were applied to predict the
Ricevuto/Received: 13 February 2019-Accettato/Accepted: 16 September 2019 probable head changes in the Six Hills sandstone aquifer and their impact
Pubblicato online/Published online: 27 September 2019 on the availability of groundwater. The fourth scenario is recommended
This is an open access article under the CC BY-NC-ND license: in order to sustain the groundwater resources in the study area and keep
http://creativecommons.org/licenses/by-nc-nd/4.0/
the drawdown rates in the range of 0.66 m/year through reducing the
© Associazione Acque Sotterranee 2019 present discharging rates (10,000 m3/day/well) by about 40 %.
Acque Sotterranee - Italian Journal of Groundwater (2019) - AS30-378: 51 - 64 51
DOI: 10.7343/as-2019-378

Introduction                                                      characteristics of the Six Hills sandstone aquifer in East El-
  East El-Oweinat area is one of the most important               Oweinat area. In addition, a groundwater flow model with
developmental areas which drawn considerable attention of         MODFLOW (3D-Groundwater modeling with PMWIN)
Egyptian government and investors in the last few decades.        has been used to extrapolate the feasibility of groundwater
The soil and groundwater resources of this area cover the         exploitation and to determine the maximum drawdown
requirements of the reclamation projects and implementation       expected for the next 20 years through different groundwater
of new communities. East El-Oweinat area is located in the        extractions scenarios.
southwestern part of the Western Desert, between latitudes
22o 00` (Egyptian-Sudanese border) and 23° 00` N and              Geology
longitudes 27° 55` and 29° 00` E, covering an area of about         The study area is dominated by a sedimentary succession
4,200 km2 (1,037,400 acre) (Fig. 1). It is located 380 km         ranging in age from Cretaceous to Quaternary with
to the south of the capital city of El-Dakhla Oasis and is        exposures of igneous and metamorphic rocks belonging to
accessible from Cairo to Assuit, via Kharga and Dakhla by         the Precambrian basement rocks (Fig. 2). The Precambrian
good asphaltic roads about 1,200 km long. The huge sand           basement rocks are exposed on the surface in Bir Tarafwi area
plain occupies the majority of the East El-Oweinat area. The      and are represented by Tarafwi-Abu-Husein Uplift extending
ground surface elevation varies from 320 m asl in south to        in east-west direction (Ghoubachi 2004). This basement
200 m asl in the north.                                           uplift affected the Bir Tarafwi area (northeast El-Oweinat
                                                                  area), where the sedimentary cover in this area is relatively
                                                                  thin. In Bir Tarafwi area, the basement uplift acts as a barrier
                                                                  against the lateral groundwater flow towards north direction
                                                                  causing the outflow of some springs in this area (e.g. Bir
                                                                  Tarafwi and west Bir Tarafwi springs).

                Fig. 1 - Location map of the study area.          Fig. 2 - Geological map of East El-Oweinat area (Conoco 1987).
               Fig. 1 - Ubicazione dell’area di studio.
                                                                  Fig. 2 - Carta geologica dell’area di East El-Oweinat (Conoco 1987).

   The study area is characterized by extreme aridity with          Based on the data of the drilled wells, the basement rocks
minimal precipitation, virgin soils and huge groundwater          are reported in the subsurface at depths ranging between
storage. Maximum temperature during summer often                  161 m from ground surface in the northeastern part of the
exceeds 40°C, whereas minimum temperature during winter           study area (Well No. 20) and 710 m west of study area (Well
may decline close to freezing. Natural evaporation rate ranges    No. 6). While, the basement surface according to sea level
between 10 mm/day during January to 31 mm/day during              varies from +90 m above sea level (asl) at the eastern part
July, with an average of 22.2 mm/day. The relative humidity       of study area (Well No.20) to -406.22 m asl at the west
ranges between 11% in May and 41% in December (Nour               (Well No. 6) (Table 1) reflecting gradual dipping towards
1996). The cultivated areas in East El-Oweinat area have          the west direction (Fig. 3). The thickness of the sedimentary
increased from 42,600 acres in 2004 (Ghoubachi 2004) to           cover increases towards the west direction. The Six Hills
180,000 acres in 2016 (present work) in the frame of a plan       Formation is exposed on the surface in East El-Oweinat
of reclaiming 190,000 feddans by the year 2022 (Ebraheem          area and represents the oldest sedimentary rock unit and
et al. 2003). Therefore, the annual groundwater recharge          represents the sole aquifer in East El-Oweinat area. It overlies
for the Six Hills aquifer is too low to sustain the large scale   directly the Precambrian basement rocks and underlies the
irrigation system and further developmental activities (Heinl     thin Quaternary deposits represented by sand sheet and sand
and Thorweihe 1993; Nour 1996; Ebraheem et al. 2003).             dunes. It is made up of ferruginous sandstone and is assigned
   The present work delineates the hydrogeological                to the Late Jurassic to Early Cretaceous (Barthel and Boettcher

52                                                                Acque Sotterranee - Italian Journal of Groundwater (2019) - AS30- 378: 51 - 64
DOI: 10.7343/as-2019-378

1978). The maximum fully penetrated thickness reaches 712                        Hills Formation) in the west direction. In East El-Oweinat
m (Well No. 6) in the west, while the minimum thickness                          area, the majority of the fault trends are Northeast-Southwest
attains 161 m (Well No. 20) in northeast. Accordingly, the                       (Fig. 2; Ghoubachi 2004).
thickness of Six Hills Formation increases towards the west
direction. The Quaternary deposits represent by sand sheet                       Hydrogeology
and sand dunes. The name of sand sheet is assigned to a sand                       The Six Hills sandstone aquifer represents the sole source of
area marked by an extremely flat surface and absence of any                      water in East El-Oweinat area. This aquifer directly overlies
topographic relief. It is covered the Six Hills Formation in the                 the Precambrian basement rocks and underlies the sand sheet.
study area. The sand dunes are well developed only in East                       In addition, it is exposed on the surface in some areas in East
El-Oweinat area, especially in the western portion and occupy                    El-Oweinat area. The number of the pumping wells increased
an area of about 640 km2.                                                        from 355 wells in year 2002 (Ghoubachi 2004) to 1600 wells
                                                                                 in the present work (2016). The depths of these wells range
                                                                                 between 70 m (well no. 1) and 722 m (well no. 6), Table 2.
                                                                                   These wells are expected to have great impact on the
                                                                                 groundwater levels of the aquifer. The groundwater of the Six
                                                                                 Hills sandstone aquifer occurs under unconfined conditions.
                                                                                 The concerned aquifer is hydraulically connected with the
                                                                                 underlying Precambrian basement rocks, as a result of faulting
                                                                                 (Fig. 4). The groundwater salinity (total dissolved salts) of the
                                                                                 concerned aquifer varies between 225 ppm (Well No. 12) and
                                                                                 962 ppm (well no. 23), Table 2. In East El-Oweinat area, the
                                                                                 fully penetrated saturated thickness of the unconfined Six
                                                                                 Hills sandstone aquifer is calculated as the distance from the

Fig. 3 - Basement surface contour map of East El-Oweinat area.
Fig. 3 - Andamento della superficie del basamento dell’area di East
El-Oweinat.

  The main factor controlling the structural pattern of the
East El-Oweinat area is Misaha Graben, which occupies the
majority of the study area. This Graben fault extends about
250 km wide and is bounded to the west by Gebel Kamil
(basement rocks) and to the east by Bir Safsaf basement rocks.
It runs approximately in the NNW-SSE direction and is                            Fig. 4 - Hydrogeological cross-section, East El-Oweinat area.
responsible for formation of a large number of normal faults.                    Fig. 4 - Sezione idrogeologica dell’area di East El-Oweinat.
The majority of these faults throw towards the west direction
causing the large thickness of the sedimentary cover (Six
                                                  Tab. 1 - The encountered basement rocks in East El-Oweinat area.
                                             Tab. 1 - Rocce del basamento incontrate nell’area di East El-Oweinat.
                                                             Depth to basement rocks       Ground elevation          Basement surface
                           Well name           Well No.
                                                                     (m bgs)                   (m asl)                   (m asl)
                           GPC IV                  2                    420                      307.12                   -112.88
                           GPC VII                 6                     710                     303.78                  -406.22
                           GPC III                 8                     257                     288.8                     +31.8
                           GPC I                   12                    192                     273.26                   +81.26
                           Kiloptra 18             13                    233                       273                      +40
                           Piezometer 5            20                    161                       251                      +90
                           GPC VI                  24                    625                     290.33                   -334.67

Acque Sotterranee - Italian Journal of Groundwater (2019) - AS30- 378: 51 - 64                                                                   53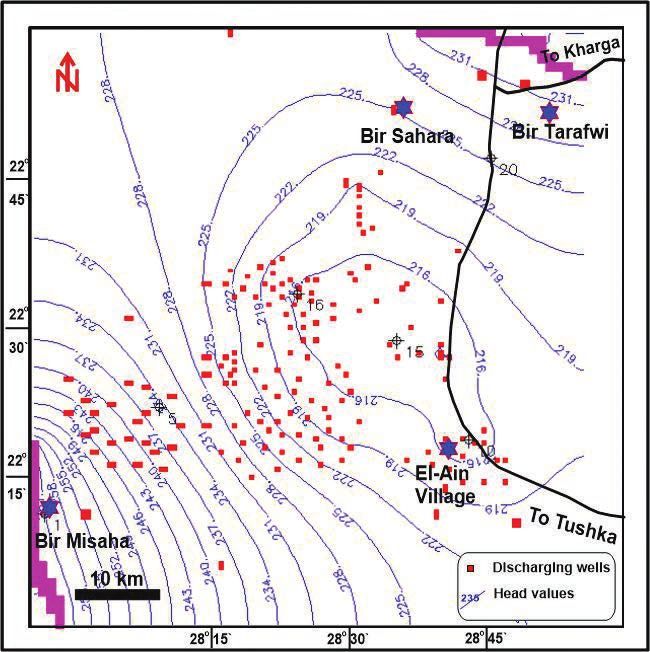
DOI: 10.7343/as-2019-378
Tab. 2 -Hydrogeological data of some pumping wells tapping the Six Hills sandstone aquifer, where T.D=Total Depth, G.E=Ground Elevation; D.T.W=Depth to Groundwater,
W.L=Goundwater Level, SI=Screen Interval and T.D.S=Total Dissolved Solids (salinity).
Tab. 2 -Dati idrogeologici di alcuni pozzi che insistono sull’acquifero di Six Hills. T.D. = profondità totale, G.E. = quota del piano campagna, D.T.W. = profondità
del livello di falda, W.L. = livello di falda, S.I. = intervallo quote di finestratura del pozzo, T.D.S = salinità espressa come solidi disciolti totali.
Well name Well No. T.D (m) G.E (m asl) D.T.W (m) W.L (m asl) S.I (m) T.D.S (ppm)
Bir Misaha 17 1 70 323 65 258 65-70 -
GPC IV 2 431 307.12 52.62 254.5 - -
El Gisha 3 300 309 - - - 333
El Gisha80 4 300 307 - - 200-300 224
El Gisha20 5 311 313 59.33 253.67 208-303 372
GPC VII 6 722 303.78 59 245.1 - -
Sanabl 7 300 297 - - 170-300 503
GPC III 8 253 288.8 39.62 249.08 - -
Sahari Co. 9 - 274 34.07 239.93 - 611
GPC V 10 435 274.36 39.20 235.16 - 502
Sahari 15 11 - 265 - - - 467
GPC I 12 192 273.26 35.02 238.24 - 225
Kiloptra18 13 260 273 35.20 237.8 146-234 426
Kiloptra75 14 350 269 34.79 234.21 180-350 633
Kiloptra41 15 330 266 29.5 236.5 170-330 671
Al Zahra 16 350 281 49.72 231.28 180-350 580
Pizometer1 17 - 280 44.80 235.2 - -
Gisha44 18 300 264 27 237 179-293 -
Gisha28 19 294 264 - 179-287 676
Pizometer5 20 186 251 10.80 240.2 99-124 -
Ain Tarfawi1 21 Ain 243 - -
Bir Sahara 22 - 259 20.15 238.85 - -
Ain Tarfawi2 23 Ain 244 - - - 962
GPC VI 24 632 290.33 49 241.98 - -
water table to the basement rocks. It ranges between 150.2 saturated thickness contour map for the concerned aquifer
m at the eastern side of study area (well no. 20) and 651 m at reveals an increase of the saturated thickness towards the west
the western side (well no. 6), Table 3. The constructed fully (Fig. 5).
Tab. 3 - Fully saturated thickness of some wells tapping the Six Hills sandstone aquifer,
East El-Oweinat area.
Tab. 3 - Valore dello spessore saturo valutato in alcuni sondaggi effettuati
nell’acquifero arenario di Six Hills, nell’area di East El-Oweinat.
Depth to Fully
Depth to basement Saturated
Well name Well No.
water (m) rocks (m Thickness
bgs) (m)
GPC IV 2 51 420 369
GPC VII 6 59 710 651
GPC III 8 39.62 257 217.38
GPC I 12 35.02 192 156.98
Kiloptra 18 13 35.20 233 197.8
Piezometer 5 20 10.80 161 150.2
GPC VI 24 49 625 576
Fig. 5 - Fully saturated thickness map of Six Hills sandstone aquifer.
Fig. 5 - Mappa dello spessore saturo per l’acquifero arenario di Six Hills.
54 Acque Sotterranee - Italian Journal of Groundwater (2019) - AS30- 378: 51 - 64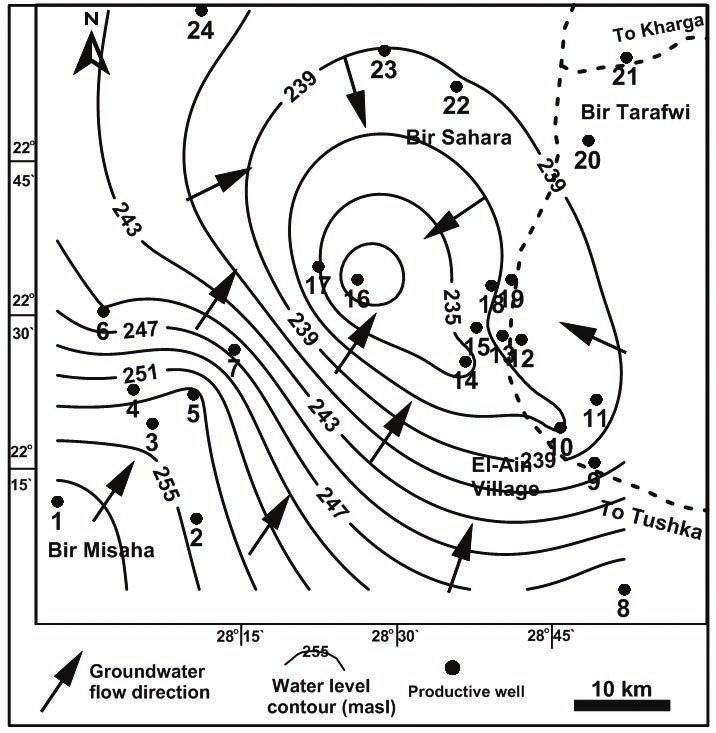
DOI: 10.7343/as-2019-378

   In East El-Oweinat area, the static depth to water was                                   the southwest side of the study area, while the lowest level is
measured in 2016 during the present work in 17 productive                                   231.28 m.a.s.l (well no. 16) located in the central part of the
and piezometer wells (Table 2). It varies between 10.8 m (Well                              study area of high discharge.
No. 20) at the northeastern side of the study area near Bir El-                                The constructed water table map also shows that the
Tarafwi Basement Uplift and 65 m (well no.1, Bir Misaha) in                                 regional groundwater of the Six Hills sandstone aquifer
the southwestern side of the study area. Shallow groundwater                                flows from southwest to the northeast direction, except the
in well no. 20 may be attributed to the basement uplift,                                    northeast portion of the study area where the groundwater
acting as a barrier to groundwater flow.                                                    flows to the center with an average hydraulic gradient of
   A comparison between the present depth to water during                                   0.6 %o. This is because this area is located in the highest
field work (2016) and in 2002 measured by (Ghoubachi 2004)                                  groundwater discharging area and the effect of the Tarafwi
for same wells show an increase in depth to water with time                                 basement uplift at north area causing return of groundwater
(Table 4 and Fig. 6).                                                                       flow to the south.
                                                                                               The huge increasing in groundwater yield of productive
                                                                                            wells is attributed to the increasing of the number of
                                                                                            productive wells.

Fig. 6 - Relationship between depth to water measured inside pumping wells and time.
Fig. 6 - Misura della profondità di falda misurata in alcuni pozzi nel tempo.

Tab. 4 - Temporal variations of the depth to water in some wells in East El-Oweinat area.
Tab. 4 - Variazioni della profondità di falda in alcuni pozzi nell’area di East
El-Qweinat
                               Depth to the water (m)
                    Well                                         Depth to water
 Well name
                    No.            2016             2002         Difference (m)

 GPC III               8          39.62            38.89                 0.73
 Ain 42                9          34.07            28.27                  5.8
 GPC V                 10         39.20              28                 11.20               Fig. 7 - Water table map of the Six Hills sandstone aquifer (Dec. 2016), East El-
                                                                                            Oweinat.
 GPC I                12          35.02             27.51                7.51
                                                                                            Fig. 7 - Carta piezometrica dell’acquifero arenario di Six Hills (dicembre
 Kiloptra 18           13         35.20            27.64                 7.56               2016), East El-Oweinat.
 Piezometer 5         20          10.80              10                  0.80
 Bir Sahara           22          20.15             18.6                 1.55                  The constructed water table map also shows that the
                                                                                            regional groundwater of the Six Hills sandstone aquifer
  The average depletion in depth to water during the last                                   flows from southwest to the northeast direction, except the
14 years in groundwater ranges between 0.73 m (well no. 8,                                  northeast portion of the study area where the groundwater
GPC III) and 11.20 m (well no. 10, GPC V) (Table 4). The                                    flows to the center with an average hydraulic gradient of
maximum drawdown is recorded in well no. 10 and is due                                      0.6 ‰. This is because this area is located in the highest
to intensive pumping in El-Ain Village (Capital of East El-                                 groundwater discharging area and the effect of the Tarafwi
Oweinat) farms of high groundwater discharge, while the                                     basement uplift at north area causing return of groundwater
low depletion recorded at well no. 8 is because this well is                                flow to the south.
located away from the farms. The average annual depletion                                      The huge increasing in groundwater yield of productive
groundwater reaches 36 cm/year with an annual discharged                                    wells is attributed to the increasing of the number of
of 13x108 m3/year.                                                                          productive wells.
  The water table map (Fig. 7) indicates that the highest                                      The aquifer hydraulic parameters in East El-Oweinat
observed water level attains 258 m asl (well no. 1) located in                              area are estimated based mainly on the interpretation of the

Acque Sotterranee - Italian Journal of Groundwater (2019) - AS30- 378: 51 - 64                                                                                         55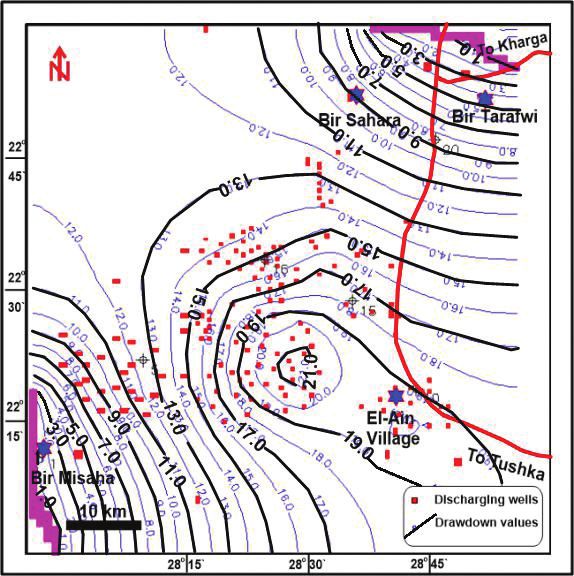
DOI: 10.7343/as-2019-378
constant discharge pumping tests according to Cooper and was used to simulate the groundwater flow system. It is a
Jacob method (1946). The results of the hydraulic parameters numerical representation that represents an approximation of
are listed in Table 5. the groundwater flow system by means of governing equations
The results show that the transmissivity values of the (Anderson and Woessner 1992). The steady state can be
studied aquifer range between 1020 and 3231 m2/day described by the following partial differential equation:
(Table 5) with an average of 2060 m2/day. The high
δ δh δ δh δ δh
transmissivity of Well No. 5 is attributed mainly to the high O= Kx + Ky + Kz
δ x δ x δ y δ y δ z δ z
water saturated thickness of this well. The transmissivity
values of the concerned aquifer indicate that the Six Hills where x,y and z are the Cartesian coordinates [L] Kx, Ky
sandstone aquifer is a high potential (>500 m2/day) according and Kz are the hydraulic conductivity [L/T ], and h represents
to Gheorhge (1979) classification. the hydraulic head [L].
The hydraulic conductivity is expressed by (K = T/D), on the other hand the transient conditions can be expressed
where is the hydraulic conductivity (in m/day), T is the by the following equation:
transmissivity (in m2/day) estimated from the pumping test
analyses and D is the aquifer saturated thickness in (m).The δh δ δh δ δh δ δh
Ss = +W Kx + Ky + Kz
aquifer hydraulic conductivity values average between 5,4 and δt δ x δ x δ y δ y δ z δ z
14.3 m/day (Table 5). where S represents the specific storage [L-1] , t is the time
The effective porosity (Feff ) of the Six Hills sandstone [T] and W is the source and/or sink [L3/T].
aquifer is calculated from the value of hydraulic conductivity
of according to the equation of Martoz (1968): Feff = 0.462 Model Discretization, Hydraulic properties and Boundary
+ 0.045Lnk, where Feff is the effective porosity in decimal Conditions
and k, the hydraulic conductivity in centimeters per second. The model domain was subdivided into a regular grid
The effective porosity of the studied aquifer ranges from 23% of 65 rows and 68 columns to cover the modeled area
(well no. 19) to 27% (Well No. 9) with an average value of as 1Km2/cell. So, a grid of 4420 cells was constructed to
24.5 % (Table 5). represent the hydrologic system of the Six Hills sandstone
In East El-Oweinat area, the estimated groundwater aquifer. Regarding the hydrological properties of the Six
quantity of the Six Hills sandstone aquifer depends principally Hills sandstone aquifer, a conceptual model is constructed
on the fully saturated thickness and effective porosity. It is to describe the groundwater flow system and the boundary
obtained approximately by equation: conditions controlling the flow through the groundwater
Q = D*A*Feff system (Fig. 8A). The constructed model indicated that the
Where Q is the groundwater quantity in m3, Feff is Six Hills sandstone aquifer is a one layered aquifer, occur
the average effective porosity in decimal (0.245), D is the under unconfined conditions and groundwater generally flows
average fully saturated thickness in meter (331m) and A is from southwest to northeast. General head boundary (GHB)
the aquifer area in m2 which is 434*107 m2 for the Six Hills was used to define the southwest and northeast boundaries
sandstone. The estimated groundwater quantity of the Six where the heads on the boundary and the fluxes are affected
Hills sandstone aquifer is 350 bcm (billion cubic meters) of by the rate of pumping. The GHB package is used to simulate
fresh water. the head dependent flow boundary (Cauchy boundary) and
it is defined by two cell values; GHB hydraulic conductance
Groundwater management Cb [L2 T-1] and Hydraulic head at the boundary hb [L]. The
flow through the GHB [L3 T-1] is calculated by Qb = Cb
A numerical groundwater flow model was developed to
(hb - h) where h is the hydraulic head in the aquifer. No
estimate the impact of the long-term groundwater extraction
flow boundary delineated the northeastern portion of the
from the Six Hills sandstone aquifer. In addition, the possible
simulated area where the impervious basement rocks occupy
means investigated to sustain the present reclamation projects
this portion of the study area (Fig. 8B)
in East El-Oweinat area. The MODFLOW (Chiang 2005)
Tab. 5 - Hydraulic parameters of some wells tapping the Six Hills sandstone aquifer (2016).
Tab. 5 - Parametri idraulici di alcuni pozzi che insistono nell’acquifero arenario di Six Hills (2016).
Fully saturated Hydraulic Effective
Pumping rate Depth to water Drawdown Transmissivity
Well No thickness Conductivity porosity
(m3/day) (m) (m) (m2/day)
(m) (m/day) (%)
5 6000 59.33 19.07 480 3231 6.7 24
9 6000 34.07 6.76 160 2289 14.3 27
18 5760 59 17.66 240 1701 7.1 24
19 6120 63.90 16.46 190 1020 5.4 23
56 Acque Sotterranee - Italian Journal of Groundwater (2019) - AS30- 378: 51 - 64
DOI: 10.7343/as-2019-378

                              Fig. 8 - A) Conceptual cross section for flow model. B) The boundary conditions and Model discreetization.
     Fig. 8 - A) Sezione del modello concettuale usato per definire il modello numerico di flusso. B) Condizioni al contorno e discretizzazione del modello.

Model Calibration                                                                  Model results
  Due to the importance of the calibration process, two                              A simulation period of 20 years was proposed from
calibration stages were implemented in the unsteady state                          year 2016 to year 2035 to predict the head changes in the
conditions using the groundwater head measurements in year                         groundwater system under different proposed plans. Four
2002 (Fig. 9). (Ghoubachi 2004) and the other one by using                         scenarios were applied to predict the probable head changes
the present measurements at year 2016. The results of the                          in the Six Hills sandstone aquifer and their impact on the
calibration were checked using the observation/calculated                          availability of groundwater in the study area as follows
head relation and by matching the measured and modeled                             (Table 6):
water table contour map (Fig. 10).

              Fig. 9 - A)The matched measured/calculated water table map. B) The calculated/observed head relation (unsteady calibration run year 2002).
Fig. 9 - A) Mappa del confronto fra piezometria misurata e piezometria simulata. B) Grafico di correlazione fra valori di quota piezometrica simulati ed osservati
(riferiti alla calibrazione del modello transitorio - anno 2002).

Acque Sotterranee - Italian Journal of Groundwater (2019) - AS30- 378: 51 - 64                                                                              57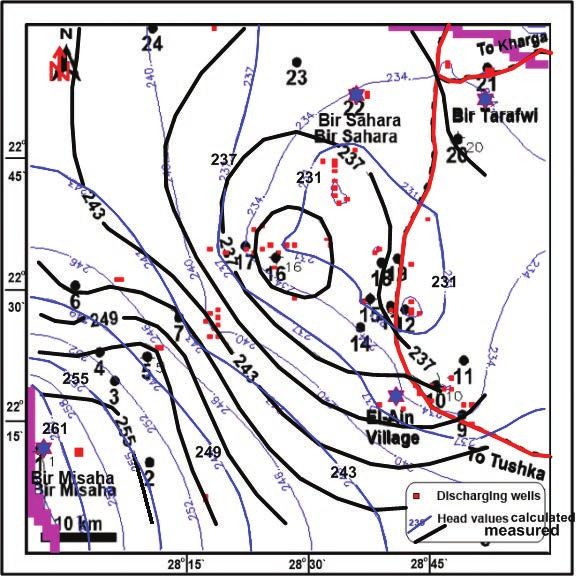
DOI: 10.7343/as-2019-378

              Fig. 10 - Calculated heads distribution map and the calculated/observed head relation of the study area (unsteady calibration run, year 2016).
Fig. 10 - A) Mappa del confronto fra piezometria misurata e piezometria simulata. B) Grafico di correlazione fra valori di quota piezometrica simulati ed osservati
(riferiti alla calibrazione del modello transitorio - anno 2016).

                                                                Tab. 6 - Drawdown at different scenarios.
                                          Tab. 6 - Abbassamento della quota piezometrica calcolato per i differenti scenari.
                                                                                     Expected Maximum Drawdown (m)
                      Scenario aspects
Scenario No.                                                  5 years                                  10 years                             20 years
                             Area                 SW           Central        NE          SW          Central        NE           SW         Central        NE
1                  Present conditions
                   (project capacity               0.5              5.5        0.5         0.5          9.0          1.0           0.9         12.6         1.8
                   1200 well)
2                  Full capacity project
                                                   1.0              14.4      1.2          1.5          22.5          1.5          2           32.0         2.0
                   (1600 well)
3                  Reduce pumping
                                                   0.8              9.6       0.8          1.0          15.0         1.0          1.0          21.0         1.0
                   rates by 25%
4                  Reduce pumping
                                                   0.5              7.0        0.5         0.8          9.6          0.8          1.2          13.2         1.2
                   rates by 40 %

The First Scenario (present conditions)                                                 As a result, the expected drawdown after 5 years will ranges
   This scenario investigates the impact of the present                               between 0.5 m in southwest and northeast areas to 5.5 m in
discharging rates on the groundwater levels of the Six Hills                          central of study area of high discharge. While the expected
sandstone aquifer in East El-Oweinat area. The extraction rate                        drawdown after 10 years (year 2025) will vary between 9 m in
is 3,000,000 m3/day for 1200 wells and the simulation period                          center of the study area. At the end period after 20 years, the
was 20 years. The model was run under these conditions.                               expected drawdown will range from 0.9 m in southwest and
Groundwater heads and drawdown values were calculated                                 northeast of the study area to 12.6 m in central part of the
using the result extract tool of the program (Fig. 11).                               study area of highly concentrated pumping wells.

58                                                                                    Acque Sotterranee - Italian Journal of Groundwater (2019) - AS30- 378: 51 - 64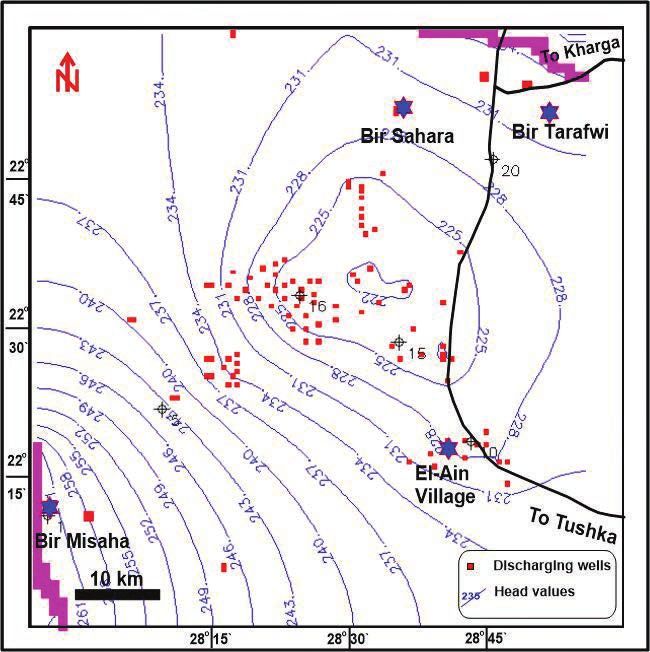
DOI: 10.7343/as-2019-378

                                  Fig. 11 - Predicted heads distribution and expected drawdown maps (first scenario) of the study area.
                              Fig. 11 - Mappa della piezometria e dei relativi abbassamenti previsti dal modello (primo scenario).

Acque Sotterranee - Italian Journal of Groundwater (2019) - AS30- 378: 51 - 64                                                            59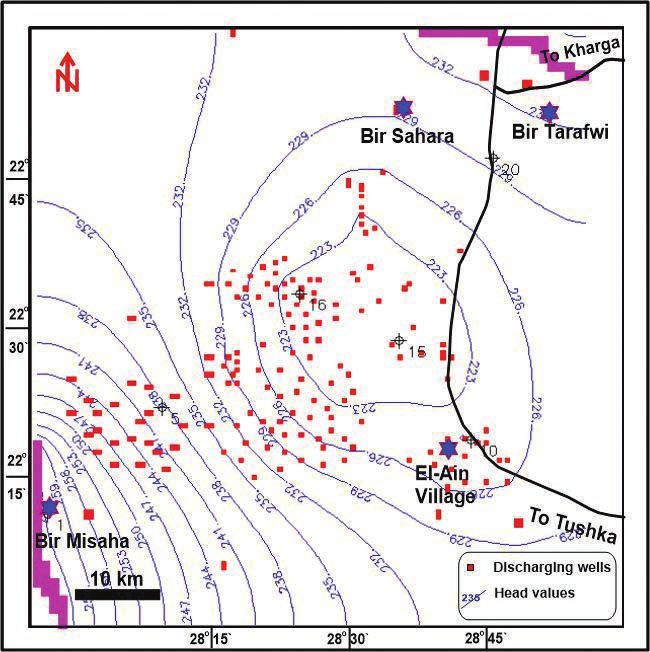
DOI: 10.7343/as-2019-378

The Second Scenario (full capacity project)                        end period after 20 years (2035 year). The pervious drawdown
  This plan examines the response of the Six Hills sandstone       values will take place in the central part of the study area of
aquifer to the process of the continuous increase of the pumping   high discharge from concentrated productive wells.
rate of the aquifer due to the new wells imposed in the aquifer
due to the increase of reclamation activities and executing        Conclusion and Recommendations
new investments in the study area. This scenario assumes a           The Six Hills sandstone aquifer represents the sole aquifer in
discharge rate i.e. 4,000,000 m3/day.These new pumping rates       East El-Oweinat area and this aquifer exists under unconfined
were assigned to the model domain in the form of discharging       conditions. The basement rocks are exposed on the surface
well groups. The number of wells will increase from 1200           northeast of the study area (Bir Tarafwi Uplift), while in
wells to 1600 wells where active reclamation processes are         subsurface the basement surface dips gradually towards the
expected. The model was run under these new conditions.            west direction and the sedimentary cover thickness increases
Groundwater heads and drawdown values of every time step           towards the west direction as well. As a result, the saturated
were calculated and the expected head and drawdown maps            thickness of the Six Hills sandstone aquifer increases towards
were constructed (Fig. 12). The extraction rate is 4,000,000       the west direction. Groundwater flows from southwest to
m3/day for 1600 productive wells. As a result, the expected        northeast direction. The calculated hydraulic parameters of
drawdown (year 2020) ranges between 1.2 m (southwest               the Six Hills sandstone aquifer show a high potential aquifer
and northeast parts of the study area of low discharge) and        comparison of groundwater depth in years 2002 and 2016
14.4 m in central part of the study area of high discharge         reveals that the average drawdown in groundwater level
(Fig. 11). While the expected drawdown (year 2025) varies          calculated from the monitoring wells is 0.36 m/year with
from 1.5 m in southwest and northeast parts of the study area      annual discharge of 13*108 m3/year.
to 22.5 m in center of study area. On the other hand, at the         The saturated thickness increases towards the west
end of the simulation time (year 2035) the expected drawdown       direction in East El-Oweinat area, it is recommended that
ranges between 2 m in the southwest and northeast parts of         the extension of reclamation areas on groundwater will be
the study area to 32 m in central part of the study area of high   in the western part of the East El-Oweinat area. Due to the
discharge.                                                         absence of subsurface data in the western portion of the East
                                                                   El-Oweinat area, it is recommended to drill some wells to
The Third Scenario                                                 reach the basement rocks to identify the subsurface section
  This Scenario suggests a plan to control and mitigate the        and to know the fully saturated thickness of the aquifer.
head deterioration of the investigated aquifer in the study          A numerical groundwater flow model was developed to
area especially central part. This scenario tries to look          estimate the impact of the long-term groundwater extraction
for the suitable pumping rates applied to the study area.          from the Six Hills sandstone aquifer to sustain the present
The discharging rate attains 4,000,000 m3/day for 1600             reclamation project in East El-Oweinat area. A simulation
productive wells. This rate was decreased by a ratio of 25%        period of 20 years was proposed i.e. from year 2016 to year
and the impact of this pumping ratio on the distribution of        2035. Four scenarios were applied to predict the probable
head and drawdown values were checked.                             head changes in the concerned aquifer and their impact on
  It is found that the total drawdown will range between 0.5       the availability of groundwater. From the model application
m in the southwest and northeast and 9.6 m in the center           results, we can conclude that the groundwater levels of
of the study area of high discharge over the stress period         the study area are expected to suffer from continuous
(2020 year), Figure 13. While the drawdown (2025 year)             groundwater head drop with the continuous increase in the
varies between 1 m in the southwest and northeast and 15           water extraction. About 32 m head drop is expected in the
m in center of the study area. On the other hand, the total        next 20 years with a drawdown rate of about 1.6 m/year in
drawdown of the Six Hills sandstone aquifer ranges from 1          the central area of high discharge. The study recommends the
m in the southwest and northeast parts of the study area (Bir      fourth scenario to sustain the groundwater resources in the
Misaha and Bir Tarafwi areas) to 21 m in central part of the       study area which keeps the drawdown rates in the range of
study area of high discharge.                                      0.66 m/year through reducing the present discharging rates
                                                                   (10,000 m3/day/well) by about 40 %.
The Fourth Scenario (Solution Scenario)
  In this scenario, the water extraction rate is reduced by
40% of the total discharge (4,000,000 m3/day) reaching rate
1,600,000 m3/day from 1,600 productive wells. This scenario
(no. 4) and Figure 14 show the drawdown contour map at year
2035.It is found that when reducing the present pumping
rates of the different wells by a ratio of 40%, the total
drawdown will exceed 7 m after 5 years (2020 year) and reach
9.6 m after 10 years (2025 year). It will attain 13.2 m at the

60                                                                 Acque Sotterranee - Italian Journal of Groundwater (2019) - AS30- 378: 51 - 64
DOI: 10.7343/as-2019-378
Fig. 12 - Predicted heads distribution and expected drawdown maps (second scenario) of the study area.
Fig. 12 - Mappa della piezometria e dei relativi abbassamenti previsti dal modello (secondo scenario).
Acque Sotterranee - Italian Journal of Groundwater (2019) - AS30- 378: 51 - 64 61DOI: 10.7343/as-2019-378
Fig. 13 - Predicted heads distribution and expected drawdown maps (thrid scenario) of the study area.
Fig. 13 - Mappa della piezometria e dei relativi abbassamenti previsti dal modello (terzo scenario).
62 Acque Sotterranee - Italian Journal of Groundwater (2019) - AS30- 378: 51 - 64DOI: 10.7343/as-2019-378
Fig. 14 - Predicted heads distribution and expected drawdown maps (fourth scenario) of the study area.
Fig. 14 - Mappa della piezometria e dei relativi abbassamenti previsti dal modello (quarto scenario).
Acque Sotterranee - Italian Journal of Groundwater (2019) - AS30- 378: 51 - 64 63DOI: 10.7343/as-2019-378
REFERENCES Ebraheem AM, Riad S, Wycisk P and Seif El Nasr AM (2003) Simula-
tion of impact of present and future groundwater extraction from
Anderson MP and Woessner WM (1992) Applied groundwater model-
the non-replenished Nubian Sandstone Aquifer in SW Egypt. En-
ing, Acadeic press, Inc., San Diego, California, 381 p.
viron Geol, 43 (1/2), pp. 188–196.
Barthel KW and Boettcher R (1978) Abu Ballas Formation (Tithonian/
Gheorhge A (1979) Processing and synthesis of hydrogeological data.
Berriasian; Southwestern Desert Egypt) a significant lithostrati-
Abacus Press, 390 p.
graphic unit of the former “Nubian Series” Mitteilungen der Bayer-
Ghoubachi SY (2004) Comparative hydrogeological studies of the Nu-
ischen Staatssammlung fur Palaontologic und historische Geologie:
bia sandstone aquifer system in East El-Oweinat and Bir El-Shab
V. 18, pp. 153-166.
areas, South Western Desert, Egypt: Ph. D. Thesis, Fac. Sci., Al-
Chiang WH (2005) 3D-Groundwater Modeling with PMWIN. A
Azhar Univ., Cairo, 303 p.
simulation system for modeling groundwater flow and transport
Heinl M, Thorweihe U (1993) Groundwater resources and management
processes. Second Edition, Springer Berlin Heidelberg New York,
in SW Egypt. In: Meissner, Wycisk P (eds) Geopotential and ecol-
397 p.
ogy. Catena, Cremlingen-Destedt, Catena Suppl 26, pp. 99–121.
Cooper H H and Jacob C E (1946) A generalized graphical method for
Marotz G (1968) Techische grundlageneiner wasserspeicherung imm
evaluating formation constants and summarizing well history: Am.
naturlichen untergrund habilitationsschrift, Universitat Stuttgart.
Geophys. Union Trans., V. 27: pp. 526-534.
Nour S (1996) Groundwater potential for irrigation in the East Owein-
Continental Oil Company CONOCO (1987) Geologic map of Egypt
at area, Western Desert, Egypt. Environmental Geology, V.27, pp.
(Scale 1:500000).
143-154
64 Acque Sotterranee - Italian Journal of Groundwater (2019) - AS30- 378: 51 - 64You can also read