Cork Oak Landscapes, Their Products and Climate Change Policies - Paulo Canaveira, Sara Manso, Tatiana Valada
←
→
Page content transcription
If your browser does not render page correctly, please read the page content below
Cork Oak Landscapes, Their Products and Climate Change                   1.

                         Cork Oak Landscapes, Their Products and
                         Climate Change Policies
                         Paulo Canaveira, Sara Manso, Tatiana Valada

Version No.Final                                                        Date: February 2015
Cork Oak Landscapes, Their Products and Climate Change                                        2.

Disclaimer

This study was commissioned by FFEM (Fonds Français pour l'Environnement Mondial); FAO (Food and
Agriculture Organisation of the United Nations); Silva Mediterranea; and IML (Institut Méditerranéen du
Liège).

The views expressed in this report are those of the authors and do not necessarily reflect the view of the
entities mentioned above or any of its staff or personnel and do not bind those entities in any manner.

This document has been prepared in good faith on the basis of information available at the date of
publication without any independent verification. Terraprima does not guarantee or warrant the accuracy,
reliability or completeness of the information in this publication nor its usefulness in achieving any purpose.

Acknowledgements

Terraprima would like to thank and acknowledge the cooperation of the Portuguese Institute for Nature
Conservation and Forestry (ICNF) for yielding information not previously published from the 6th National
Forest Inventory for use in this report.

We would also like to thank all those that provided data and comments to earlier versions of this report, in
particular to Christophe Besacier, Renaud Piazzetta, Joaquim Lima, Rachid Tarik Bouhraoua, Carolina
Varela, Pino Angelo Ruiu, Nuno Calado, Agostino Pintus, Cláudia Gonçalves, Marina Vitullo, Ivo Gama and
Miguel Alves.

Quotation and more information

This report should be quoted as:

Canaveira, P., Manso S. and T. Valada (2015). Cork Oak Landscapes, Their Products and Climate Change.
Terraprima Report, February 2015.

For more information on Terraprima and this report please contact:
ambiental@terraprima.pt
http://www.terraprima.pt/en/

Version No.Final                                                                             Date: February 2015
Cork Oak Landscapes, Their Products and Climate Change                                                                                                                        3.

Table of Contents
Table of Figures...................................................................................................................................... 4
Table of Tables ....................................................................................................................................... 5
Executive Summary ................................................................................................................................ 6
1      The Cork Oak Landscapes ................................................................................................................ 8
2      Current Trends in Emissions and Sequestration in Cork Oak Landscapes ......................................... 11
    2.1             Emissions and Removals in forest ecosystems ........................................................................................ 11
    2.2             Land-use change in Cork Oak Forests (Afforestation and Deforestation) ............................................... 12
    2.3             Emissions and Removals in existing forests of Cork Oak ......................................................................... 15
3      Challenges for Cork Oak Landscapes in Adapting to Climate Change ............................................... 20
    3.1             Elevated CO2 Concentration and CO2 Fertilization .................................................................................. 23
    3.2             Increased frequency of forest fires and other extreme events ............................................................... 25
    3.3             Effects on Communities and Ecosystems ................................................................................................ 26
4      Emissions and removals and Cork Oak Forest Products .................................................................. 28
    4.1             Carbon in Cork Products .......................................................................................................................... 29
    4.2             Substitution Effect in Cork Products........................................................................................................ 31
5      The UNFCCC (Political) Landscape and Cork Oak Landscapes .......................................................... 36
    5.1             The Kyoto Protocol .................................................................................................................................. 38
       5.1.1        Annex 1 Countries (France, Italy, Portugal, Spain) ...................................................................................................38
       5.1.2        Non-Annex 1 countries (Algeria, Tunisia, Morocco) .................................................................................................40
    5.2             The Cancun Agreements ......................................................................................................................... 41
       5.2.1        Annex 1 Countries that ARE also Parties to the Kyoto Protocol (France, Italy, Portugal, Spain) ..............................41
       5.2.2        Annex 1 Countries that ARE NOT Parties to the Kyoto Protocol...............................................................................41
       5.2.3        Non-Annex 1 countries (Algeria, Tunisia, Morocco) .................................................................................................42
    5.3             The ADP Process and the Paris Agreement ............................................................................................. 45
    5.4             Adaptation under the UNFCCC ................................................................................................................ 46
       5.4.1        National Adaptation Programmes of Action.............................................................................................................46
       5.4.2        Nairobi work programme on impacts, vulnerability and adaptation to climate change ..........................................46
       5.4.3        Cancun Adaptation Framework ................................................................................................................................47

6      Climate and Carbon Finance .......................................................................................................... 49
    6.1             Carbon Markets ....................................................................................................................................... 49
       6.1.1        Compliance Markets .................................................................................................................................................49
       6.1.2        Voluntary Markets ....................................................................................................................................................49
    6.2             Other (non-market) climate funding ....................................................................................................... 50
       6.2.1        General .....................................................................................................................................................................50
       6.2.2        REDD+ .......................................................................................................................................................................50
       6.2.3        Adaptation ................................................................................................................................................................51

7      Measures to Improve the Climate Performance of Cork Oak Landscapes ........................................ 53
    7.1             Adaptation Measures .............................................................................................................................. 53
    7.2             Mitigation Measures ............................................................................................................................... 54
    7.3             Promote the use of cork as a climate-friendly material .......................................................................... 54
    7.4             Knowledge is important for decision making .......................................................................................... 54
    7.5             Make an efficient use of climate related finance .................................................................................... 55
References ........................................................................................................................................... 57

Version No.Final                                                                                                                                                   Date: February 2015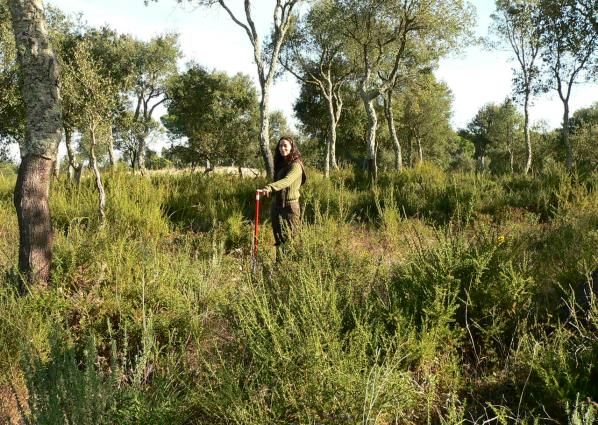
Cork Oak Landscapes, Their Products and Climate Change                                                                                           4.

Table of Figures

Figure 1: Cork Oak Forests - Natural Distribution ............................................................................................. 8
Figure 2: Distribution of Cork Oak Forests in 2010 ........................................................................................... 8
Figure 3: Simplified representation of the main Carbon Flows (in blue), Emissions (in orange) and Removals
(in green) ......................................................................................................................................................... 11
Figure 4: Main Greenhouse Gas Emissions and Removals in the Land Sector ................................................ 12
Figure 5: Changes in Total Area of Cork Oak Forests ...................................................................................... 13
Figure 6: Cork Oak Forest Dynamics in Portugal Afforestation 1995-2010 (left); Distribution in 2010 (center)
and Deforestation 1995-2010 (right) .............................................................................................................. 14
Figure 7: Changes in Tree Crown Cover in Cork Oak Forests in Portugal 1995-2010 Increase (left), No-
change (center) and Decrease (right) .............................................................................................................. 18
Figure 8: Observed Trends in Mean Annual Temperatures 1960-2012 .......................................................... 20
Figure 9: Observed Trends in Number of Consecutive Warm Days and Cool Nights 1960-2012 ................... 21
Figure 10: Observed Trends in Annual Precipitation 1960-2012 .................................................................... 21
Figure 11: Projected Changes in Mean Annual Temperature (left), Mean Summer Temperature (center) and
Mean Winter Temperature (left). Values for 2021-2050 (up) and 2071-2100 (down) as simulated by
ENSEMBLES Regional Climate Models for the IPCC SRES A1B emission scenario ........................................... 22
Figure 12: Projected Changes in Annual Precipitation (left) and Summer Precipitation (right). Precipitation
(%) between 1961-1990 and 2071-2100 as simulated by ENSEMBLES Regional Climate Models for the IPCC
SRES A1B emission scenario ............................................................................................................................ 23
Figure 13: Effect of long term (4 year) exposure to elevated CO2 (700 ppm) and ambient CO2 (350 ppm) on
(a) biomass accumulation and (b) leaf area cork under diferent nitrogen fertilization regime: higth N (8
mM) and low N (1 mM) in nutrient solution (source: original data in Maroco et al 2002) ............................ 24
Figure 14: Tree mortality in a burnt cork oak forest in Catalonia. When fires are particularly intense, tree
mortality can be very significant ..................................................................................................................... 25
Figure 15: Acacia dealbata regeneration in a burnt cork oak forest in Catalonia ........................................... 26
Figure 16: Decay of a Cork Oak Tree in Doñana National Park ..................................................................... 27
Figure 17: Illustration of Carbon Cycle in Forest Products (in this example: cork stopper for use in wine
bottle, with energy recovery of used cork) ..................................................................................................... 28
Figure 18: Illustration of the Substitution Effect in Forest Products (in this example: aluminium cap and cork
for the same function – sealing a bottle) ........................................................................................................ 28
Figure 19: Estimated Cork Production in the Mediterranean ......................................................................... 29
Figure 20: Estimated Production of Cork Stoppers by Country ...................................................................... 30
Figure 21: Estimated Production of Other Cork Products by Country ............................................................ 30
Figure 22: Annual Production of Cork Stoppers (left) and Other Cork Products (right) and Changes
(emissions and removals) in the Corresponding Cork Products Pool ............................................................. 31
Figure 23: Emissions and Removals of CO2 Associated with Cork Products ................................................... 31
Figure 24: LCA literature review of cork stoppers versus plastic or aluminium alternatives.......................... 32
Figure 25: Avoided Emissions due to the Use of Cork Stoppers (instead of aluminium or plastic stoppers) . 33
Figure 26: LCA literature review for the use of cork slab as an insulating material, versus its substitutes
(Bribián et al., 2011) ........................................................................................................................................ 33
Version No.Final                                                                                                                             Date: February 2015
Cork Oak Landscapes, Their Products and Climate Change                                                                                         5.

Figure 27: Graphical representation of the systems under analysis (from La Rosa et al., 2014) .................... 34
Figure 28: Graphical representation of the systems under analysis, without transportation (left) and
including transport to the building site (right) (adapted from La Rosa et al., 2014) ...................................... 34
Figure 29: Vinyl versus cork flooring (Quinones, 2011) .................................................................................. 35
Figure 30: Strategies to Address Climate Change ........................................................................................... 36
Figure 31: Map of UNFCCC Annex 1 and Non-Annex 1 Countries................................................................... 37
Figure 32: Illustration of the Application of Gross-Net: the accounting rule for afforestation and
reforestation .................................................................................................................................................... 39
Figure 33: Illustration of the Application of Reference Level: the accounting rule for forest management . 39
Figure 34 Illustration of the Application of Baseline: the accounting rule for afforestation and reforestation
clean development mechanism projects ........................................................................................................ 41
Figure 35 Illustration of the Application of REDD+ Reference Level: the “accounting” rule for reducing
emissions from deforestation and forest degradation ................................................................................... 44
Figure 36: Map of Countries Participating in UN REDD Programme ............................................................... 45

Table of Tables

Table 1: Annual Trends in Cork Oak Forest Area per Country......................................................................... 13
Table 2: Estimating Emissions and Removals based on NET or GROSS Afforestation and Deforestation ...... 15
Table 3: Emissions Associated with Afforestation with Cork Oak, depending on previous Land-Use ............ 15
Table 4: Main Natural Processes and Management Actions in Cork Oak Forests and their Impact in
Mitigation to Climate Change .......................................................................................................................... 16
Table 5: Evolution of mean volume per hectare in Cork Oak Forests ............................................................. 17
Table 6: Available data on cork products ........................................................................................................ 30
Table 7: Mandatory and Voluntary KP LULUCF Activities in the 1st and 2nd Commitment Periods ................ 38
Table 8: List of adaptation measures in cork oak forests ................................................................................ 53
Table 9: List of mitigation measures in cork oak forests ................................................................................. 54

Version No.Final                                                                                                                           Date: February 2015
Cork Oak Landscapes, Their Products and Climate Change                                       6.

Executive Summary

Cork oak landscapes exist in a relatively small portion of our planet, but they are extremely important for
the products they produce, the most iconic of which is cork, but also for the social and environmental
services they provide.

Climate change will affect all ecosystems and this report makes the link between climate change, climate
change policy and cork oak forests. It looks at how cork oak forests contribute to emissions and to carbon
sequestration (chapter 2), how cork oak forests will be affected by climate change (chapter 3) and how cork
products contribute to mitigation of climate change (chapter 4). It then provides a summary of the main
existing international climate change policies and instruments (chapter 5), in particular those related to
carbon markets (chapter 6). It concludes with a section suggesting measures to tackle address climate
change (mitigation and adaptation) in cork oak forests and to how to take better advantage of existing
climate related finance (chapter 7).

Cork oak landscapes are unique in their ecological characteristics, their management system and they are
the origin of an iconic and singular product: cork.

These forests are managed using a set of practices which affect their contribution to mitigate climate
change. On the negative side, deforestation, over grazing and over harvesting, land abandonment and
forest fires are contributing to emissions and forest degradation. On the positive side, afforestation and
changes in soil management practices are increasing carbon sequestration and forest resilience. However,
the actual balance of emissions and removals in any particular forest plot will depend on the effect of a set
of management practices on different carbon pools. Unfortunately, the availability of public data did not
allow the quantification of the emissions and removals in cork oak forests for the whole region and
further information needs to be compiled for this assessment to be made with the right level of detail.
There is therefore a need to go deeper into the understanding and data collection for a complete and
accurate estimation of emissions and removals in cork oak forests.

Cork oak forests are located in a region which already is and will increasingly be severely affected by
climate change. That reinforces “old” climate related risks and places new challenges on existing cork oak
forests. Amongst these challenges the most significant are the likely exposure to more frequent droughts
and water stress, increased fire risk leading to more frequent and more intense fires and possibly,
increased exposure to pests and diseases.

Under Mediterranean conditions the management actions to promote climate change mitigation and
climate change adaptation are often overlapping, as they contribute both to increase resistance and
resilience to climate change and to reduce emissions or to increase sequestration. This is clearly the case of
management actions that promote soil protection against erosion and soil organic matter, which lead to
soil carbon sequestration and to increased capacity to cope with droughts, or improvements in fire
prevention measures, which reduce fire emissions and maintain the health and vitality of cork oak forests.

Version No.Final                                                                            Date: February 2015
Cork Oak Landscapes, Their Products and Climate Change 7.
Many of the recommendations for climate friendly mitigation and adaptation practices make sense on
their own. However climate finance may have a pivotal role to foster large scale management changes,
as it can be used to:
provide financial viability to alternative practices, e.g. replacing “bad” (but profitable) practices
with climate friendly ones;
cover losses associated with temporary restrictions to current practices, e.g. excluding grazing
until soils or forest densities recover
overcome non-financial barriers, e.g. training and capacity building to cover knowledge and
information gaps;
overcome resistance to innovation, e.g. provide an incentive to change practices that have been
common in a certain region for extensive periods of time;
finance external and specialized input into designing better and locally adapted practices;
finance the information and monitoring system to measure the costs and the climate benefits
introduced by the measures
Climate finance is available in multiple formats and can be mobilised for different purposes, but ultimately
they may all converge to promote better forest management:
REDD+ finance can be used to finance capacity building and “reward” emission reductions in forest
landscapes (non-A1 countries)
NAMA finance can be used to finance climate mitigation resulting from activities that reduce
emissions or increase sequestration in the forest, agriculture and grazing sectors (non-A1 countries)
Adaptation finance can be used to promote forest resilience and resistance to climate change
(non-A1 countries)
Common Agriculture Policy finance can be used for both mitigation and adaptation (EU countries)
Life Programme finance can be used to promote best practices and demonstration projects in both
mitigation and adaptation (EU countries)
Voluntary carbon market finance can so far be used only for a limited number of practices (all
countries)
In the case of cork-oak forests most of the practices that contribute t climate change mitigation also foster
their adaptation. It is therefore important to understand, for each set of intended practices or actions,
which is the best format for finance.
Version No.Final Date: February 2015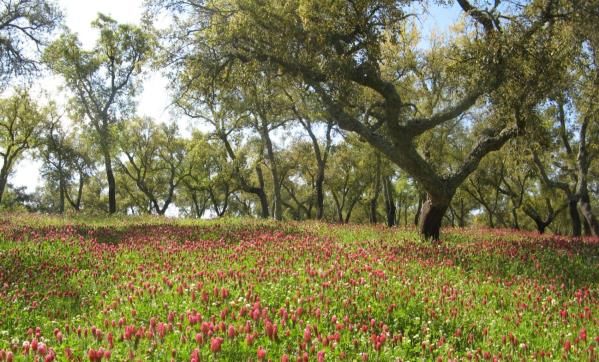
Cork Oak Landscapes, Their Products and Climate Change 8.
1 The Cork Oak Landscapes
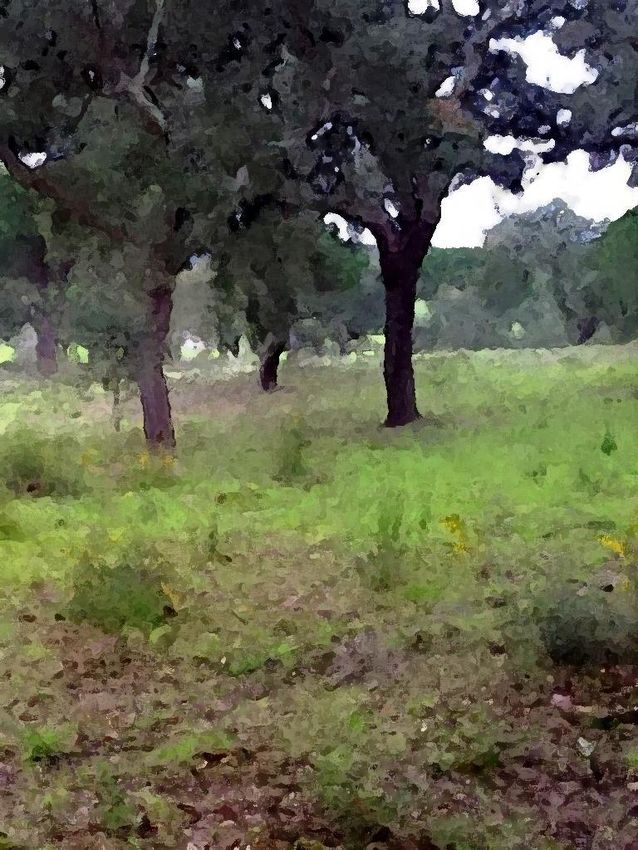
Cork oak forests are found only in the warmer parts of the humid and sub-humid western Mediterranean1.
They occur predominantly in the Iberian Peninsula and Morocco, but also on the western coast of Italy, in
southern France and the coastal plains and hills of Algeria and Tunisia (Figure 1). Cork oak forests cover
approximately 2.33 million ha, 1.57 million ha in Europe and 757 thousand ha in North Africa (Figure 2).
Figure 1: Cork Oak Forests - Natural Distribution
2
Figure 2: Distribution of Cork Oak Forests in 2010
1
http://www.fao.org/docrep/017/i3226e/i3226e.pdf
2
Based on the data presented in Figure 5
Version No.Final Date: February 2015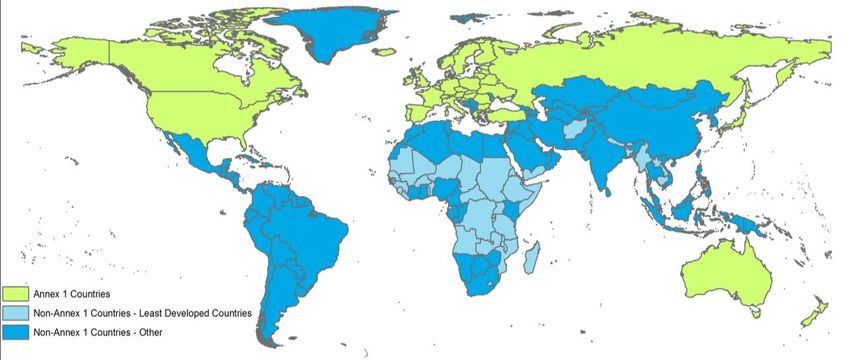
Cork Oak Landscapes, Their Products and Climate Change                                      9.

Climatically, cork oak forests occur in regions with average annual precipitation above 600 millimetres and
average temperature near 15oC. In Europe, it is low temperatures that appear to set the geographic limits
and most cork oak stands are located in areas below 800 meters in altitude and usually grow in acidic soils
on granite, schist, or sandy substrates or, more rarely, in limestone-derived soils or in neutral soils overlying
dolomitic bedrocks (Aronson, J., Pereira, J., and Pausas, J..2009).

Cork is the bark of cork oak trees and has evolved as an evolutionary response to protect the tree from fires
and drought, both common features in its natural distribution area. Cork is an extremely insulating material
and protects the tree from the extreme temperatures during fires. Epicormic buds are also protected by the
cork and guarantee a quick recovery of the affected trees after fire. Its characteristics also reduce the losses
of water by evaporation, another useful feature in times of extreme drought. Cork is composed mostly of
suberin (39%), lignin (22%) and polysaccharides (18%) (Pereira, H. (1988).). The high levels of suberin
present in cork (compared to other specie’s bark) make it a material which is impermeable, buoyant, fire
resistant, compressible, elastic, long lasting and resistant to abrasion.

An additional and distinctive characteristic is that, unlike most other trees, the cork oak bark renews itself
after harvesting and there is usually no mortality associated with the bark extraction. As bark production
depends on tree size, there is no incentive for harvesting the trees, and cork oak forests tend to have older
and larger trees than other forests types used for wood production, and frequently reach over 200 years of
age.

Recognising the unique characteristics of cork, humans started harvesting and using this material for
numerous purposes, and currently cork is the most valued product of cork oak forests. Cork became iconic
for its use for bottle stoppers in the wine industry. More recently, building on the chemical characteristics
of cork, cork industrial uses have expanded tremendously and it is now used in the automobile, military and
space industries, for footwear and clothing, in building and architecture, as tiles in floors, in furniture etc.
Certain materials obtained from corks as derivatives are used for such purposes like black agglomerate,
white agglomerate and rubbercork3.

Cork oak forests are often explored in agro-forestry systems, combining the presence and use of cork oak
trees with the use of its understory for direct grazing by pigs, cattle, sheep or goats or for extensive cereal
production. These systems are known as “montado” in Portugal or “dehesa” in Spain.

The products of cork oak landscapes are, therefore, more diverse than just cork, including meat, cereals,
but also natural products such as mushrooms, asparagus, bee honey, medicinal herbs. Cork oak landscapes
are also use for hunting, both small game (rabbits, partridges, etc) and large game (red deer, fallow deer,
wild boar). Beside the provisioning ecosystem services referred, cork oak woodlands also provide the
ecosystem services of regulating (soil conservation, water retention, watershed protection, erosion control,
amongst others examples), supporting (soil formation, nutrient cycling, primary production, etc.) and
cultural heritage (landscape amenity, recreation and tourism) (MA (Millennium Ecosystem Assessment).
2005.). Finally, the unique biodiversity of the Mediterranean region, of which the cork oak landscapes are
an essential part of, has made it one of the 34 global biodiversity hotspots identified by Conservation

3
    http://www.cork.pt/other-applications-of-cork.html
Version No.Final                                                                               Date: February 2015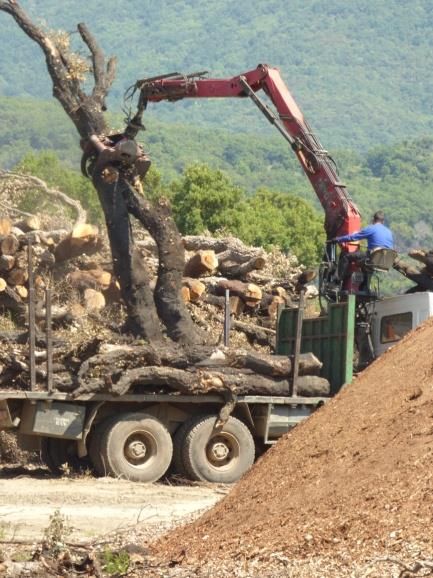
Cork Oak Landscapes, Their Products and Climate Change 10.
International4. WWF further states that “cork oak forests support one of the highest levels of biodiversity
among forest habitats, as well as the highest diversity of plants found anywhere in the world”5.
WWF has elected cork oak one of its 36 priority species programmes6 at global level and identifies the
following threats to cork oak forests:
increasing human pressure on resources, through overgrazing, over-harvesting and forest clearance;
forest conversion for fast growing tree plantations;
poor forest management practices;
land abandonment;
urban development in coastal areas;
forest fires;
perverse subsidies in the north;
poverty and lack of economic opportunities for rural populations in the south;
lack of forest management capacity and investment to integrate environmental and social issues into
management practices and land use planning;
cork market fluctuations.
These threats, will become exacerbated by climate change and will affect cork oak landscapes health and
increase their vulnerability to diseases, pests, and large-scale fires.
4
http://www.conservation.org/where/priority_areas/hotspots/europe_central_asia/Mediterranean-Basin/Pages/default.aspx
5
http://mediterranean.panda.org/about/forests/cork/about_cork/biodiversity/
6
http://wwf.panda.org/what_we_do/endangered_species/cork_oak/
Version No.Final Date: February 2015Cork Oak Landscapes, Their Products and Climate Change 11.
2 Current Trends in Emissions and Sequestration in Cork Oak Landscapes
2.1 Emissions and Removals in forest ecosystems
The IPCC structures the carbon cycle of forest ecosystems in Carbon Pools and for each pool both Gains and
Losses of Carbon should be estimated. Carbon Pools include living biomass (above and below ground);
Dead Wood and Litter; Soil Organic Matter; and Harvested Products. “Gains” are all processes that increase
the Carbon content of a pool, while “Losses” are those processes that reduce the Carbon content of pool.
The “losses” refer to emissions of various GHGs to the atmosphere (carbon dioxide CO2, methane CH4 and
nitrous oxide N2O) or simply to transfers of Carbon between different Carbon pools, while “gains” refer to
sequestration of CO2 from the atmosphere or transfers of carbon (organic matter) or increases of carbon
due to transfers of Carbon between different pools (Figure 3). Some processes and management activities
may also add emissions of other greenhouse gases, most notably methane and nitrous oxide (Figure 4).
Photosynthesis
Forest Fires
Forest Fires
Respiration
Respiration
Fire Wood
Mortality
Leaf fall Dead Wood
Living Biomass
Litter
Harvest waste
Harvest
Decay
Incineration
Soil Organic
Forest Products Respiration
Nat. Decay Matter
Figure 3: Simplified representation of the main Carbon Flows (in blue), Emissions (in orange) and Removals (in
green)
Version No.Final Date: February 2015Cork Oak Landscapes, Their Products and Climate Change 12.
Figure 4: Main Greenhouse Gas Emissions and Removals in the Land Sector
Understanding and quantifying all these processes is not a simple task and requires the combination of
many different information sources and an understanding of these flows in both space and time, as some
of these flows are relatively slow to materialize (e.g. sequestration or emissions from natural decay of
wood) while others can be of high magnitude over short periods (e.g., emissions from forest fires).
The National Inventory Reports7 presented to the UNFCCC by the countries in the cork-oak distribution area
present their results in aggregated manner and do not allow singling out emissions and removals associated
with this specific forest species, so it is not possible to present aggregated data from official sources.
Nevertheless, it is possible to identify a series of management activities that will contribute as a source of
emissions. These may come from deforestation, from mortality, from legal and illegal harvesting or pruning,
from degradation of soils and desertification, grazing, etc.
Other activities and characteristics of cork oak landscapes contribute in the opposite, more positive,
direction. The expansion of cork oak areas, the efforts to increase regeneration, soil restoration and
measures to fight desertification usually have a positive contribution in fighting climate change by removing
CO2 from the atmosphere.
In the absence of concrete detailed data for the countries concerned, this report will focus on proxy
information, i.e., variables that have a known contribution to emissions and removals, even if no
quantification is possible at this point in time.
2.2 Land-use change in Cork Oak Forests (Afforestation and Deforestation)
Land-use changes usually involve removing the vegetation of a particular land-use and replacing it with a
new type of use. They are also often associated with changes in soils (e.g., tillage). Therefore, land-use
changes are usually associated with the most dramatic emissions and removals on land and, therefore,
receive a lot of attention when estimating emissions and removals.
7
NIR from PRT, SPA, ITA, FRA https://unfccc.int/national_reports/annex_i_ghg_inventories/national_inventories_submissions/items/8108.php
Version No.Final Date: February 2015Cork Oak Landscapes, Their Products and Climate Change 13.
The balance of carbon involved in land use changes depends very strongly on the original and future land
use being considered. In general, transitions from low carbon stock land-uses (e.g. annual rain-fed crops) to
high carbon stock land-uses (e.g. forests) result in net-sequestration of carbon, whereas the reverse results
in net-emissions.
Therefore, to correctly quantify emissions and removals associated with land-use transitions to and from
cork oak forests one would need to know in detail where these transitions are taking place and which land-
uses are being replaced. Information of this type is usually collected in countries or regions where maps in
different points in time exist, or where the National Forest Inventories are based on permanent plots,
resampled at each inventory.
Overall, and as shown in Figure 5, areas covered in Cork-oak forests have increased from 1975 to 1990 at a
rate of about 14,102ha/year. From 1990 to 2000 the total area continued to grow, although at a slower
rate of about 10,507ha/year. However, this trend has been reversed from 2000 to 2011 with a recorded
decrease in total area of about 2,083ha/year.
Data also shows that these trends have not been uniform across the region (Table 1), with some countries
showing a consistent increase over time (Spain, Italy), a stabilization of total area (Portugal) and decreases
in area (Morocco, Algeria).
Cork Oak Forest Area per Country 1975-2011 Cork Oak Forest in the Mediterranean 1975-2011
800 2.500
Portugal Portugal
2.250 Spain
700 Spain
Morocco
Morocco 2.000 Algeria
600 Algeria
Tunisia
1.750
Italy Italy
500
Cork Oak Area (1000ha)
Cork Oak Area (1000ha)
Tunisia 1.500 France
France
400 1.250
1.000
300
750
200
500
100
250
0 0
Data Sources: Data Sources:
Portugal, Spain: Lamey A. 1893, National Forest Inventory + linear interpolation; Italy: Lamey A. 1893, FAO Forest Resources Assessment + linear Portugal, Spain: Lamey A. 1893, National Forest Inventory + linear interpolation; Italy: Lamey A. 1893, FAO Forest Resources Assessment + linear
interpolation; Algeria: Lamey A. 1893; Djema A. & Messaoudene, M. 2009, Pereira H. 2007; Abbas M., 2013; Puyo, J., 2006; Puyo, J., 2013 + linear interpolation; Algeria: Lamey A. 1893; Djema A. & Messaoudene, M. 2009, Pereira H. 2007; Abbas M., 2013; Puyo, J., 2006; Puyo, J., 2013 + linear
interpolation; Tunisia: Lamey A. 1893; Ben Jamaa 2011 + linear interpolation; France: Lamey A. 1893; Piazzetta R. 2005; Pereira H. 2007+ linear interpolation; Tunisia: Lamey A. 1893; Ben Jamaa 2011 + linear interpolation; France: Lamey A. 1893; Piazzetta R. 2005; Pereira H. 2007+ linear
interpolation; Morocco: Boissière, G.. 2005, FAO Forest Resources Assessment + linear interpolation; interpolation; Morocco: Boissière, G.. 2005, FAO Forest Resources Assessment + linear interpolation;
Figure 5: Changes in Total Area of Cork Oak Forests
Table 1: Annual Trends in Cork Oak Forest Area per Country
1975-1990 1990-2000 2000-2011
Algeria -1.534 -4.097 -3.266
France -743 -743 -353
Italy 1.292 5.190 2.268
Marocco 2.562 -45 -6.548
Portugal 5.490 2.558 -92
Spain 7.457 7.457 5.110
Tunisia -422 188 798
Total Cork Oak Area 14.102 10.507 -2.083
unit: ha/year
Version No.Final Date: February 2015Cork Oak Landscapes, Their Products and Climate Change 14.
Although relevant, it should be noted that changes in total area are per se is a poor indicator for the carbon
dynamics associated with afforestation and deforestation in any particular territory. National Forest
Inventories usually provide total area estimates and thus, comparing one inventory with the previous one
only allows the calculation of net-afforestation (if total area increased) or net-deforestation (if it
decreased). However, as annual emissions per hectare from deforestation are usually much larger than
annual sequestration per hectare from afforestation, it is very important to know the dynamics of each of
these activities separately.
For example, in Portugal, preliminary NFI6 data suggests that a net-total of 10,052 ha were lost between
1995 and 2010 (approx. -670ha/year). However, a closer look shows that this net-number actually results
from a gross deforestation of 86,379 ha and a gross afforestation of 76,168 ha (Figure 6).
Figure 6: Cork Oak Forest Dynamics in Portugal
Afforestation 1995-2010 (left); Distribution in 2010 (center) and Deforestation 1995-2010 (right)
Using the net or the gross afforestation and deforestation figures will result in very different annual
emissions and sequestration estimates. Table 2 illustrates, for the case of Portugal, the emission estimates
that result from using the net-deforestation or the gross-afforestation and gross-deforestation.
Version No.Final Date: February 2015Cork Oak Landscapes, Their Products and Climate Change 15.
Table 2: Estimating Emissions and Removals based on NET or GROSS Afforestation and Deforestation
Net-Deforestation Gross-Afforestation and
Gross-Deforestation
Total Area Estimated Annual Total Area Estimated Annual
(1995-2010) Emissions(-) or (1995-2010) Emissions(-) or
sequestration(+)8 sequestration(+)
Afforestation NA NA 76,168 ha +94,927 tonCO2
Deforestation NA NA -86,379 ha -433,941 tonCO2
Net-change -10,052 ha -50,488 tonCO2 -10,052 ha -339,014 tonCO2
In the estimation of emissions and removals associated with afforestation, it is also of paramount
importance to know what the land use was present before the afforestation took place. As carbon stocks
associated with each land use can be very different, the emissions associated with each transition can also
be quite different as illustrated in Table 3 for the case of Portugal.
Table 3: Emissions Associated with Afforestation with Cork Oak, depending on previous Land-Use
Land Use before Emission associated with Years before new cork oak forest
afforestation with cork oak afforestation tCO2/ha offsets initial emission
Pinus pinaster 110 47
Eucalyptus spp. 81 35
Quercus rotundifolia 49 21
Quercus spp. 75 32
Other broadleaves 162 69
Pinus pinea 74 32
Other coniferous 60 26
Non-irrigated annual crops 2 1
Irrigated annual crops 2 1
Rice paddies 2 1
Vineyards 23 10
Olive groves 33 14
Other permanent crops 36 16
Grassland 5 2
Shrubland 50 22
As the table shows, afforestation with cork oak is a much better mitigation option when the previous land
use was agriculture or grassland, and a relatively poor option when replacing other types of forest.
2.3 Emissions and Removals in existing forests of Cork Oak
Even when no land-use change is involved forests will still sequester carbon or emit carbon, particularly
when they are managed. The processes driving these changes are photosynthesis (tree and cork growth) or
carbon accumulation (increases in soil organic matter or litter and dead wood) and, simply speaking, all
processes that remove biomass and organic matter from forests (e.g. respiration, harvesting, cork
extraction and forest fires). Both natural processes and management play a vital role in the carbon balance
by altering the rate at which emissions and removals are taking place at any given point in space and time.
8
Considering only the carbon present in cork oak trees, and using the emission factors as presented in the National Inventory Report 2013 for
Portugal.
Version No.Final Date: February 2015Cork Oak Landscapes, Their Products and Climate Change 16.
Table 4 makes a summary of the impact of the main natural processes and management actions in cork oak
forests and relates them to their consequences in terms of emissions and removals.
Table 4: Main Natural Processes and Management Actions in Cork Oak Forests and their Impact in Mitigation to
Climate Change
Natural process / Consequence in emissions and removals
Management action
Tree planting / Increases tree density and average standing volume
assisting natural – contributes to removals
regeneration
Cork extraction / cork Increases emissions in the year of harvesting; likely compensated by removals in
growth the following years
– probably neutral over a full cork extraction cycle
May degrade tree health and vitality condition (if not implemented correctly, if
done in excess, too frequently or over a too large surface)
– contributes to emissions
Cork oak harvesting Decreases tree density and average standing volume
and thinning – contributes to emissions
Cork oak pruning Increases emissions in the year of pruning
– contributes to emissions
May improve tree health and vitality condition (e.g. when used to control pests or
diseases)
– contributes to removals (or avoids future emissions)
May degrade tree health and vitality condition (e.g. illegal collection of fire wood or
accorns)
– contributes to emissions
Cork oak natural Decreases tree density and average standing volume
mortality – contributes to emissions
Cork oak pests and
diseases
Tillage Decreases soil organic matter content
– contributes to emissions
May degrade tree root system and tree health and vitality condition
– contributes to emissions
Shrub control Increases emissions in the year of control; likely compensated by removals in the
following years
– probably neutral over a full shrub control cycle
Decreases fire probability and reduces damage and tree mortality in case of fire
– avoids future emissions
May improve soil organic matter (if shrub mowers are used to reduce shrub
biomass and biomass is left on the ground to decay)
– contributes to removals
May degrade soil organic matter (if tillage is used to destroy shrubs)
– contributes to emissions
Grazing by cows, May limit tree regeneration (especially in over-grazing situations)
sheep, goats, pigs – limits future removals
Grazing by large Decreases fire probability and reduces damage and tree mortality in case of fire
herbivores (deer, wild – avoids future emissions
boar) May degrade soil condition (especially in over-grazing situations)
– contributes to emissions
May improve soil organic matter (e.g. due to organic input; if improved pastures
are sown, etc.)
– contributes to removals
Agriculture under Decreases fire probability and reduces damage and tree mortality in case of fire
tree cover – avoids future emissions
May improve soil organic matter (if no till is used)
Version No.Final Date: February 2015Cork Oak Landscapes, Their Products and Climate Change 17.
Natural process / Consequence in emissions and removals
Management action
– contributes to removals
May degrade soil organic matter (if tillage is used)
– contributes to emissions
Liming & fertilization Increases system productivity, growth and may improve tree health and vitality
condition
– contributes to removals
Increases losses of nitrogen
– contributes to emissions (of N2O)
May improve soil organic matter (if no till is used)
– contributes to removals
May degrade soil organic matter (if tillage is used)
– contributes to emissions
Forest fires Causes direct fire emissions of several greenhouse gases (CO2, CH4 and N2O)
– contributes to removals
Consumes / degrades the layers of litter and dead wood
– contributes to emissions
Exposes surviving trees to increased post-fire mortality and to pests and diseases
– contributes to emissions
Increases soil loss and decreases soil organic matter content
– contributes to emissions
Drought & flooding May increase natural mortality or attacks by pests and diseases
– contributes to emissions
Soil erosion Increases soil loss and decreases soil organic matter content
Soil degradation – contributes to emissions
Desertification
Soil restoration Decreases soil loss and increases soil organic matter content
– contributes to removals
Estimating gains and losses for all these processes can be technically complicated and requires a lot of data.
One alternative is to estimate whether the net-effect of all these management activities and natural
processes is leading to a net-sequestration or a net-emission of GHG emissions is to compare how the
average standing volume of cork oak trees (and other carbon pools) is evolving over time. An increase will
mean that forests are accumulation carbon, i.e. sequestration is on average bigger that emissions, while a
reduction will mean the opposite, emissions are greater than the removals or sequestration. Although data
is limited, we can see that existing cork oak forests are increasing their average carbon stocks in most
countries, while Portugal shows a stabilised carbon stock, suggesting that cork oak forests are, on average,
acting as a carbon sink.
Table 5: Evolution of mean volume per hectare in Cork Oak Forests
1975 1985 1990 1995 1996 2000 2005 2007
Algeria
France
Italy 50
Morocco 28 30 39
Portugal 31 31
Spain 22 22 29
Tunisia 74 92 94
unit: m3 /ha
As with afforestation and deforestation, the trends in average carbon stocks may be hiding different trends
in different parts of the same country. Net-changes in carbon stocks are already a combination of areas
Version No.Final Date: February 2015Cork Oak Landscapes, Their Products and Climate Change 18.
that are gaining carbon with areas that are losing carbon. Quantifying these different trends and identifying
where they are taking place is important for understanding the processes that are improving or degrading
carbon stocks in order to better design proper mitigation policies. E.g. Figure 7 shows, for the case of
Portugal, that some areas are increasing tree crown cover, while others decreasing tree crown cover.
Understanding the processes that lead to the latter is important in order to stop those (likely) emissions
from continuing.
Figure 7: Changes in Tree Crown Cover in Cork Oak Forests in Portugal 1995-2010
Increase (left), No-change (center) and Decrease (right)
Version No.Final Date: February 2015Cork Oak Landscapes, Their Products and Climate Change 19.
BOX 1: CASE STUDY: Financing Soil Carbon through Sown Biodiverse Pastures and Improved Shrub Control
In 2009-2014, 3 projects were financed by the Portuguese Carbon Fund (PCF) to promote climate friendly changes in pasture
management in the South and Centre of Portugal. All projects impact the soil organic matter (SOM) by changing common
management practices in degraded soils. Increases in SOM induced by these changes were accounted as Carbon Sequestration,
and this environmental service was paid for by the PCF, as part of a Domestic Offset Programme. Increases in SOM also have
important adaptation benefits.
The overall impact is summarised in 3 indicators: 130000ha intervened; >1000 farmers involved; 1.5 MtCO2 of additional
sequestration.
The baseline situation for all projects was similar: degraded grasslands of “natural” herbaceous vegetation, which in time is
colonised by woody vegetation (shrubs) to which farmers react by resorting to tillage, further degrading the soil. This cycle repeats
itself every 4-8 years and the corresponding average levels of SOM are very low. The process also exposes soils to erosion, reduces
water storage capacity and may damage tree roots.
The projects offered two alternatives for farmers: Sown Biodiverse Pastures (SBP), for the cases where the degraded grasslands
were used for extensive grazing; Improved Shrub Control (ISC), for the cases where shrub control takes place mostly to reduce fire
risk and/or to allow for cork extraction.
SBP use a combination of up to 20 species and varieties of grasses and legumes, which increase productivity, do not require tillage
for maintenance, and thus result in increases of SOM at 10 cm depth of ~6.5tCO2/y for 10 years (//youtu.be/WR4tINbSXp4)
ISC replaces the conventional tillage by a biomass shredder that leaves the soil untouched, which results in increases of SOM at 30
cm of ~6 tCO2/y for 10 years.
All farmers received technical support to guarantee the proper implementation of the proposed management practices. Their
adhesion to the project was voluntary and regulated by individual contracts.
Degraded Sown Biodiverse
Grasslands Pastures
3x Soil C
content
• Root productivity
LOW • Soil Organic HIGH
Matter content
To know more please visit: https://www.youtube.com/watch?v=WR4tINbSXp4 ; http://terraprima.pt/en/projecto/2 ; http://terraprima.pt/en/projecto/1
Version No.Final Date: February 2015Cork Oak Landscapes, Their Products and Climate Change 20.
3 Challenges for Cork Oak Landscapes in Adapting to Climate Change
Impacts of climate change have the potential to affect global terrestrial carbon sink and to further increase
atmosphere CO2 concentration. Recent research confirms that carbon storage in soil organic matter is often
increased under elevated CO2 in the short-term (Allard et al. 2004 cited at IPCC 2007), yet the total soil
carbon sink may saturate at elevated CO2 concentrations, especially when nutrient input are low (Gill et al.
2002 and van Groeningen et al. 2006 cited at IPCC 2007).
Carbon stored in the terrestrial biosphere is vulnerable to be lost back to the atmosphere as a result of the
direct and indirect effects of climate change and forest degradation. The net transfer of carbon dioxide
from the atmosphere to the land is projected to weaken during the 21 st century. The direct effects of
climate change on stored terrestrial carbon include high temperatures, drought and windstorms, indirect
effects include increased risk of fires, pest and disease outbreaks.
Cork oak landscapes are located in the Mediterranean Basin, a region that is very sensitive to climate
change. Climate change modelling suggests that the Mediterranean region will experience change in terms
of:
precipitation patterns: reduction of total precipitation; redistribution of annual patterns; more inter-
annual variation; more frequent and longer droughts; etc.;
temperature patterns: increases in mean temperature; more frequent heat waves; etc.;
frequency and intensity of extreme events: storms, wild fires, etc.
These future trends are only reinforcing what is already being felt across the region. In fact, increases in
mean annual temperature in the cork oak area have been higher than in most of Europe (Figure 8) and
there is significant trend for reduction of both warm days and cool nights (Figure 9). Although less
significant, the changes in precipitation have also shown a decrease in annual rainfall (Figure 10)9.
Figure 8: Observed Trends in Mean Annual Temperatures 1960-2012
9
Figure 7 to Figure 10 retrieved from the European Climate Adaptation Platform
http://climate-adapt.eea.europa.eu/data-and-downloads?searchtext=&searchelements=OBSERVATIONS&searchtypes=MAPGRAPHDATASET
Version No.Final Date: February 2015Cork Oak Landscapes, Their Products and Climate Change 21.
Figure 9: Observed Trends in Number of Consecutive Warm Days and Cool Nights 1960-201210
Figure 10: Observed Trends in Annual Precipitation 1960-2012
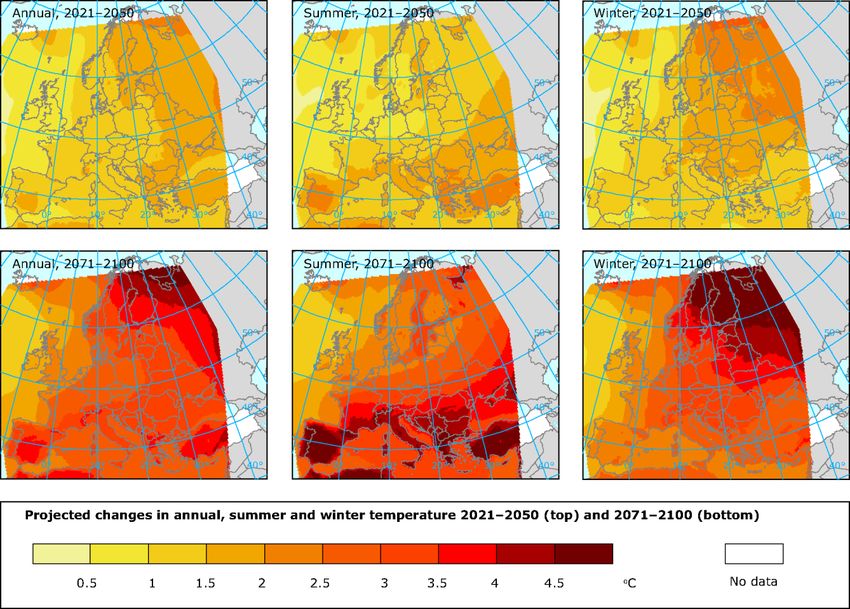
By the end of the twenty-first century, mean air temperature in the cork oak region is expected to rise by 2
to more than 4,5oC, an increase that will be felt most intensively in the summer than in the winter (Figure
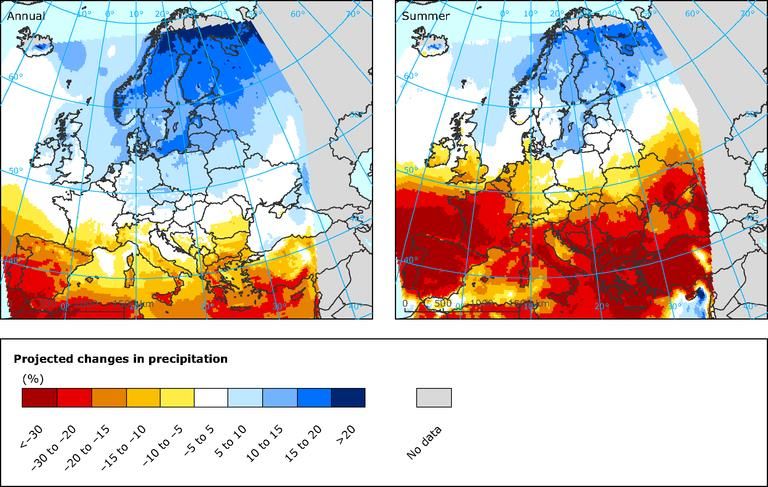
11). Total precipitation may decrease by as much as 30 percent (Figure 12). Furthermore, the
Mediterranean basin appears to be one of the primary climate change hotspots, which means that the
climate change will be felt more intensively in this region than in other places (Aronson et al. 2009).
10
Warm days are defined as being above the 90th percentile of the daily maximum temperature and cool nights as below the 10th percentile of
the daily minimum temperature (Alexander et al., 2006). Grid boxes outlined in solid black contain at least three stations and so are likely to be
more representative of the grid-box. High confidence in the long-term trend is shown by a black dot. Area averaged annual time series of
percentage changes and trend lines are shown below each map for one area in northern Europe (green line, 5.6 ° to 16.9 °E and 56.2 ° to 66.2 °N)
and one in south-western Europe (purple line, 350.6 ° to 1.9 °E and 36.2 ° to 43.7 °N).
Version No.Final Date: February 2015Cork Oak Landscapes, Their Products and Climate Change 22.
Figure 11: Projected Changes in Mean Annual Temperature (left), Mean Summer Temperature (center) and Mean
Winter Temperature (left). Values for 2021-2050 (up) and 2071-2100 (down) as simulated by ENSEMBLES Regional
Climate Models for the IPCC SRES A1B emission scenario
Version No.Final Date: February 2015Cork Oak Landscapes, Their Products and Climate Change 23.
Figure 12: Projected Changes in Annual Precipitation (left) and Summer Precipitation (right). Precipitation (%)
between 1961-1990 and 2071-2100 as simulated by ENSEMBLES Regional Climate Models for the IPCC SRES A1B
emission scenario
These past and future trends will affect cork oak landscapes in different ways, quite often placing new or
increasing environmental pressures on the maintenance of cork oaks forests.
Cork oak forests are naturally adapted to a particularly variable climate and are biologically equipped to
deal with a highly variable weather patterns, both between and within years. However, the adaptation to
climate change will be more difficult for species with low dispersal capacity and that occur in extensive
landscapes, because they must disperse over longer distances climate change will occur too quickly to allow
natural migration or adaptation (SIAM and IPCC AR5), which places cork oak as a vulnerable species to
climate change.
3.1 Elevated CO2 Concentration and CO2 Fertilization
Plants initial response to elevated CO2 is to increase its carbon assimilation rate and decrease transpiration,
or loss of water, due to partial stomatal closure, which would suggest more productivity and better water
efficiency. However, research seems to indicate that the combined changes in temperature and
precipitation in future decades will modify, and often limit, this direct effect of CO2 on plants. Some
experiments with trees grown under elevated CO2 concentration (e.g. Medlyn et al. (1999) and Maroco et
al. (2002)) show that biomass increase is not sustained over time and that the potential for CO2 fertilization
is not fully realized after long-term acclimation to elevated CO2 (Figure 13). Furthermore the impacts on soil
fertility and drought may overcome the potential benefits of CO2 fertilization.
Version No.Final Date: February 2015Cork Oak Landscapes, Their Products and Climate Change 24.
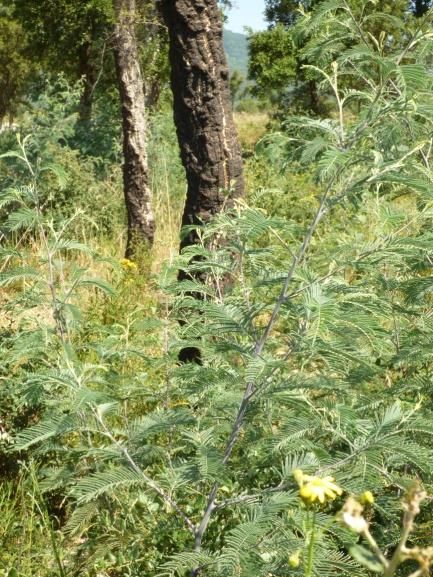
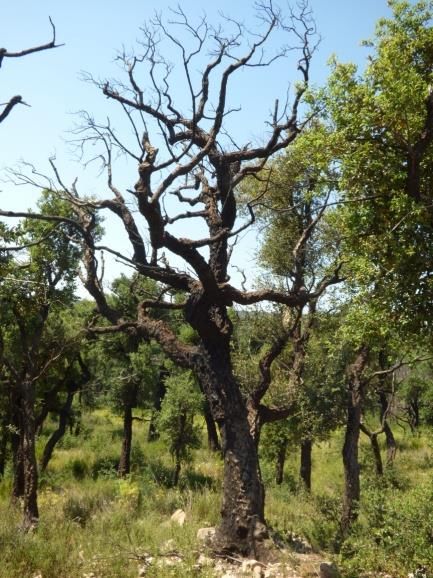
Figure 13: Effect of long term (4 year) exposure to elevated CO2 (700 ppm) and ambient CO2 (350 ppm) on (a)
biomass accumulation and (b) leaf area cork under diferent nitrogen fertilization regime: higth N (8 mM) and low N
(1 mM) in nutrient solution (source: original data in Maroco et al 2002)
These experiments show that the effect of increase CO2 concentration, per se, may not be significant. In
fact the net primary productivity (NPP) simulations, based on an “optimal” distribution of forest vegetation,
suggested the opposite; i.e. a decrease in NPP in most countries due to the increasing water deficits (SIAM).
The irregular rainfall patterns that characterise the Mediterranean will become exacerbated by climate
change which will increase not only the severity of plant water stress, cause overheating and damage in
leaves, but also increase the rate of nutrient losses from soil (Aronson et al. 2009). All these factors
combined seem to suggest a higher mortality of cork oak or at least a loss of primary productivity.
The effects of rising temperature on carbon balance on the cork oak may be negative, in summer, due to an
increase in plant respiration relative to carbon uptake and assimilation and positive in autumn and winter,
by reducing the limitations on photosynthesis related to low temperatures. A secondary flush of shoot
growth in autumn may be stimulated (Aronson et al. 2009).
Additionally, climate change will also affect many limiting factors such as pests, weeds, competition for
resources, soil, water and air quality, etc., which are neither well understood at large scale, nor well
implemented in leading models. Plant physiologists and modellers alike recognise that the effects of
elevated CO2 measured in experimental settings and implemented in models may overestimate actual field
and farm level responses (Tubiello and Ewert, 2002; Fuhrer, 2003; Karnosky, 2003; Gifford, 2004; Peng et
al., 2004; Ziska and George, 2004; Ainsworth and Long, 2005; Tubiello et al., 2007a, 2007b).
Nadal-Sala et al. (2013) defends that some Spanish forests may start performing as a net carbon sources
during the second half of this century, due to an increase in aridity, depending on the magnitude of the
climate change projections considered. Furthermore, for the same reason, the relative amount of
evapotranspiration will be also increased due to a rising atmospheric evaporative demand.
Version No.Final Date: February 2015You can also read