Tackling the next crisis - Climate change in Asia - HSBC Centre of Sustainable Finance
←
→
Page content transcription
If your browser does not render page correctly, please read the page content below

Free to View
                                                              Economics & Climate Change – Asia

By: Joseph Incalcaterra, Wai-Shin Chan, Pranjul Bhandari,                                       September 2020
Noelan Arbis, Yun Liu, Jingyang Chen, and Aayushi Chaudhary                              www.research.hsbc.com

   Tackling the next crisis
   Climate change in Asia
   Rising sea levels are already inundating
   some of Asia’s largest cities, while
   erratic weather patterns jeopardise
   food security

   The region can no longer avoid
   addressing climate change without
   imperilling local populations and
   long-term growth

   We take a first look at the economics
   of climate change in Asia, and assess
   implications for policymakers and
   investors

Disclosures & Disclaimer: This report must be read with the disclosures and the analyst certifications in
the Disclosure appendix, and with the Disclaimer, which forms part of it.
Free to View ● Economics & Climate Change - Asia
September 2020
Onto the next one
The world has yet to emerge from the worst pandemic in recent
memory, but it is time to shift attention to what will likely be the
defining crisis of the century: climate change. It is, of course,
nothing new. But for Asia, the economic and social impacts are
already materializing: rising sea levels are inundating major cities
while erratic weather jeopardizes food security. Fiscal and
monetary policies will need to adjust. While it is easy to lay the
blame on developed economies, Asia has contributed nearly all of
global emissions growth since 1990, and the region’s increasing
reliance on coal is a pressing concern. Shifting energy demand
patterns due to COVID-19 and more competitive renewable energy
costs beg for a re-think of energy investment plans. Without
urgent changes in Asia, we believe the world will not be able to
effectively address climate change. We take a first look at Asia’s
climate challenges from an economics perspective.
Climate change is an urgent problem for Asia
Studies suggest that of the 20 global cities most vulnerable to rising sea levels, 15 are in
Asia: 5 in ASEAN, 5 in South Asia, 4 in mainland China, and 1 in Japan (see page 10).
Climate change has resulted in increasing frequency and severity of extreme weather
events: floods, typhoons, droughts, monsoons. This is jeopardizing long-run food security in
India, China, and Southeast Asia, with implications for inflation and development.
Asia, however, is also a major contributor to climate change
Since 1990, Asia has contributed 87% of the growth in total incremental greenhouse gas
emissions, according to data sourced from Our World in Data. The region will continue to
drive emissions due to relatively high economic growth and urbanization. Moreover, most
countries in the region plan to meet burgeoning electricity needs with coal-fired power
plants, which already account for c46% of global CO2 emissions (according to the IEA).
While energy accounts for c75% of carbon dioxide emissions, in Southeast Asia,
deforestation has historically been a key driver of regional emissions, especially in
Indonesia. The problem has recently improved, but more work is needed.
The region has made commitments
All economies have pledged some form of emissions reduction under the Paris Agreement,
but not all are meeting their goals. Policymakers will need to rethink priorities, and investors
should grasp the fact that based on the current trajectory, the region’s policy actions will
prevent the world from attaining the goals set forth in the Paris Agreement.
1
Free to View ● Economics & Climate Change - Asia
                                                                                                                                                               September 2020

                                                      A summary of the major economic implications

                                                      Climate change actions need to be integrated with development goals across the region.
It is impossible to
                                                      Some of the region’s economies hardest hit by climate change, such as India, Indonesia, and the
accomplish development
goals without accounting for                          Philippines continue to face an enormous challenge of reducing poverty, and improving access to
climate change risks                                  healthcare, education, and safe food and drinking water. Ignoring the impact of human-induced
                                                      climate change can only delay the achievement of these goals, which would be detrimental for
                                                      reducing inequality and driving sustainable long-term growth.

                                                      Fiscal

                                                      As we discuss on page 8, rising sea levels are already imperilling Asian cities, and annual GDP
The COVID-19 related hit to
                                                      losses may range from 0.2-0.9% of GDP a year for China, India, and Indonesia (Schinko et al, 2020).
energy demand provides an
impetus to reconsider                                 The total cost to address the issue may be as much as 52% of 2050 GDP in the case of Vietnam, or
significant investment in coal                        31% for India (Diaz, 2016). Moreover, studies indicate that fiscal tools such as price policies (i.e.
power plant                                           carbon taxation) coupled with investment and public guarantees can be effective in fighting climate
                                                      change. Even a modest carbon tax can allow for significant changes in electricity generation plans,
                                                      resulting in a shift from coal-fired power towards increasingly cost-effective renewable energy
                                                      generation, which in China and India now cost less than new coal-generated electricity. COVID-19
                                                      provides an impetus for policymakers to reconsider long-term energy plans.

                                                      Meanwhile, numerous economies such as India, Indonesia, Malaysia, and Vietnam will have to
                                                      embark on fiscal reforms in order to lower public debt over time following the pandemic. One
                                                      potential way to do this would be asset swaps, i.e. selling completed government owned assets such
                                                      as roads and airports, and using the funds for building new assets. This is where climate change can
                                                      be brought in. The new assets that authorities set to build should be consistent with its goals on
                                                      mitigating and adapting to the risks of climate change.

                                                      Inflation and monetary policy

                                                      In this report, we will look closely at the impact of climate change on food security, which has
Policymakers will
                                                      clear implications for inflation-based monetary policy. We also believe there is a more direct role
increasingly take into
account climate change                                for climate change in monetary and macro-prudential policy formulation. In India, the RBI could
objectives                                            include climate risks in stress tests and scenario analyses and extend central bank support to
                                                      green finance initiatives. In China, the PBoC has gradually used monetary pools to incentivize
                                                      green finance and incorporated green loans into its Macro-Prudential Assessment. In
                                                      Singapore, the MAS has already started to stress test climate change-related risks, while in
                                                      Malaysia, BNM is looking at the impact climate change will have on financial and real assets in
                                                      the country, trying to ascertain the impact on the financial system.

Table 1: An overview of climate-change related indicators

                                            World          USA             EU           CH             IN            ID          MY            PH            SG            TH              VN     JN     KR
Share CO2 emissions (%)                     100.0          14.8            9.4         27.5           7.3           1.7          0.7           0.4           0.1           0.8             0.6    3.2    1.8
Share of global GDP (%)                     100.0          24.4           17.8         16.4           3.3           1.3          0.4           0.4           0.4           0.6             0.3    5.8    1.9
Share of global popul. (%)                  100.0           4.3            5.8         18.2          17.8           3.5          0.4           1.4           0.1           0.9             1.3    1.6    0.7
GHG emissions per capita*                       6.6         18.1           9.8           8.2          2.4           8.5           5.2          1.4         11.2            6.0             3.4    9.9   12.9
GDP per capita (USDth)                          11           65            39            10             2             4           11             3          65               8               3    40     32
Emissions intensity of GDP**                    0.4          0.3           0.2           0.6          0.4           0.5           0.3          0.2          0.1            0.3             0.3    0.3    0.4
Energy intensity level of                         5          5.1           4.4           6.1          4.2           3.5           4.2          3.1          3.1            5.1             5.6    3.7    6.4
primary energy***
Fossil-fuel based electricity (%)             65.2          67.1          41.5         73.0          81.9         89.3          90.0          74.6         96.9          91.5          63.3      80.3   67.7
Source: World Bank, Our World in Data, Global Carbon Tracker, IEA, HSBC. NB: *Tonnes of C02 equivalent emissions per capita,**CO2 emissions (kg per PPPUSD of GDP), ***MJ/PPPUSD of GDP)

                                                      This is a redacted version of the report published on 23-Sep-20. Please contact your HSBC
                                                      representative or email AskResearch@hsbc.com for information.

2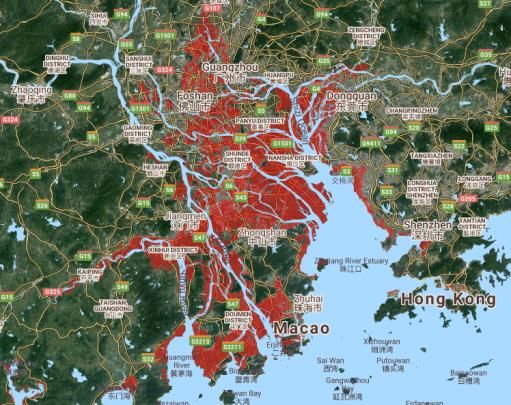
Free to View ● Economics & Climate Change - Asia
                                                                  September 2020

Contents

Onto the next one                  1
A summary of the major economic
implications                    2

An intro to climate change         4
A short introduction to climate
change                             4

That sinking feeling               9
Rising sea levels                  9

Food security                     14
A closer look at India, ASEAN,
and China                         14
India                             15
ASEAN                             16
China food security               20

A (big) part of the problem       22
Looking within                    22
Paris Agreement                   25
Energy: The elephant in the room 27
Coal: The elephant in the room    28
Scope for renewables adoption     31
Deforestation in Southeast Asia   33
Addressing deforestation          34

Disclosure appendix               35

Disclaimer                        37

                                                                                 3
Free to View ● Economics & Climate Change - Asia
September 2020
An intro to climate change
The world has collectively increased its GHG emissions every year,
with a few blips for economic slowdowns
COVID-19 may cause global emissions to fall around 4-7% in 2020e,
but without a structural change, emissions will likely bounce back
There is room for progress in Asia, especially on carbon pricing
Wai-Shin Chan, CFA
A short introduction to climate change
Head, Climate Change Centre;
Co-Head, ESG Research
The Hongkong and Shanghai Climate change in short
Banking Corporation Limited Greenhouse gas (GHG) molecules trap heat because they absorb certain wavelengths of
radiation (heat re-radiated from the Earth’s surface) but then re-radiate this energy in all
directions – in effect trapping some of that energy on Earth instead of allowing it to be re-
radiated back into space. The Earth is only habitable because of our atmosphere and its ability
to trap heat and so, essentially, GHGs are good in moderation. A change in the climate
(average weather) occurs when the atmospheric concentrations of GHGs undergo a rapid
increase (or decrease) in a (short) timeframe such that the Earth’s systems cannot adapt. In a
nutshell, this is climate change.
There are six main types of GHG: CO2, CH4, N2O, SF6, PFCs, HFCs.
GHG emissions: The problem is not specifically emissions of GHGs, but concentrations of
GHGs in the atmosphere. The higher the atmospheric concentration of GHGs, the greater the
ability to trap heat. Atmospheric concentrations increase not strictly because of emissions, but
when these emissions reach and stay in the atmosphere because we did not capture them (to
prevent them reaching the atmosphere), or because we destroyed the sinks that absorb them.
Chart 2: Atmospheric concentrations of carbon dioxide (CO2) rise relentlessly
ppm 2019 2018 2017 2016 2015
2014 2012 2013 2011 2010
420
415
410
405
400
395
390
385
380 The 1960s average was Each month in 2016 to 2019 has been
around 320 ppm above 400 ppm
375
370
Jan Feb Mar Apr May Jun Jul Aug Sep Oct Nov Dec
Source: Earth System Research Laboratory (NOAA).
4
Free to View ● Economics & Climate Change - Asia
                                                                                         September 2020

Annual emissions: The world has collectively increased its GHG emissions every year, with a
few blips for economic slowdowns. According to Le Quéré et al (May 2020), COVID-19 may
cause global emissions to fall 4-7% in 2020; however, unless there is a structural change in the
global economy, emissions will likely pick up again in the coming years.

Chart 3: Annual emissions chart by gases
  GtCO2e
                            Carbon Dioxide (CO2)        Methane (CH4)       Nitrous Oxide (N2O)          F-Gases
  50
  45
  40
  35
  30
  25
  20
  15
  10
   5
   0
       1852
       1857
       1862
       1867
       1872
       1877
       1882
       1887
       1892
       1897
       1902
       1907
       1912
       1917
       1922
       1927
       1932
       1937
       1942
       1947
       1952
       1957
       1962
       1967
       1972
       1977
       1982
       1987
       1992
       1997
       2002
       2007
       2012
       2017
Source: PRIMAP

The consequences of climate change
The impacts of climate change are both physical and social in nature. The physical impacts are
now so striking that they are almost a “new normal” with records broken in terms of heat waves,
storms, floods, and wildfires almost every year. The social effects – how climate change hits
livelihoods, vulnerable communities etc. is also becoming more prominent. The marches,
strikes, and protests by the general population across many parts of the world have further
highlighted the gulf between the urgency as shown by the science and the impacts, and the
delayed action and indifference shown by some governments.

Chart 4: Extreme weather events are on the rise and causing more damage
 # No. of events                                                                                                   USD bn
 (bars)                    Drought            Ex Temp             Flood             Storm             Wildfire
                                                                                                                   (lines)
  200                                                                                                                  80
  180                                                                                                                  70    Thousands
  160
                     Bars represent events                                                                             60
  140                  (LHS) while lines
  120              represent damages (RHS)
                                                                                                                       50
  100                                                                                                                  40
   80                                                                                                                  30
   60
                                                                                                                       20
   40
   20                                                                                                                  10
    0                                                                                                                  0
                 1950-59       1960-69        1970-79       1980-89       1990-99           2000-09     2010-19
Source:EMDAT

The Paris Agreement on Climate Change
In 2015, the world collectively adopted the Paris Agreement on Climate Change. The main aim
is to keep the rise in global average temperatures to well-below 2°C above pre-industrial levels
and preferably to 1.5°C in order to significantly reduce the risks and impacts of climate change.

                                                                                                                             5
Free to View ● Economics & Climate Change - Asia
September 2020
As of 11 September 2020, 189 Parties, covering 96.1% of global GHG emissions had ratified
the Agreement.
The UN’s climate science body, the Intergovernmental Panel on Climate Change (IPCC)
released a ‘Special Report on Global Warming of 1.5 °C’ in 2018. Its key finding was that the
threshold of 1.5°C of warming will be reached by 2040 on current emissions levels unless global
carbon dioxide (CO2) emissions decline by 45% by 2030 and reach ‘net zero’ by 2050. There
are many benefits to limiting warming to 1.5°C compared with 2°C including: ‘avoided physical
impacts’ such as roughly 10cm more in sea level rises, significantly more ice-free Arctic
summers and double the biodiversity loss, at 2°C. There are also social angles such as impacts
on livelihoods, health and food security. The marginal abatement costs are 3-4x higher for 1.5°C
vs 2°C.
In 2019, the IPCC has also released a ‘Special Report on Climate Change and Land’ and ‘The
Ocean and Cryosphere in a Changing Climate’. The current series of special reports is part of
the sixth assessment cycle (AR6) which will be published over 2021-22.
Limiting global warming to 1.5ºC would require rapid, far-
reaching and unprecedented changes in all aspects of
society.
Intergovernmental Panel on Climate Change (IPCC)
The urgency of decarbonisation
Essentially, the global economy must become less carbon-intensive (i.e. decarbonise). This
transition to a lower carbon world should be economy-wide, affecting for example energy,
industry, transportation, buildings and cities, and agriculture.
Chart 5: The global emissions trajectory must change significantly downwards
GtCO2e Below 1.5°C Below 2°C Historical Emissions
80 Below 1.5°C Below 2°C
70 Emissions are
2018 emissions: 55GtCO2e still rising
60 although at a
Emissions trajectory required for 2 C modestly slower
50 (41GtCO2e in 2030; 21GtCO2e in 2050) growth rate.....
40 2010: 50GtCO2e
....this means
30 2000: 40GtCO2e that any delay to
policy requires
20 1990: 36GtCO2e even deeper
Emissions trajectory required for 1.5 C cuts are required
10 to get back "on
(24GtCO2e in 2030, 6GtCO2e in 2050) track"
0
2000
2002
2004
2006
2008
2010
2012
2014
2016
2018
2020
2022
2024
2026
2028
2030
2032
2034
2036
2038
2040
2042
2044
2046
2048
2050
Source: Emission Gap report 2019
6Free to View ● Economics & Climate Change - Asia
September 2020
Pledging to reduce emissions
Some 186 Parties (to the UN’s climate framework) have submitted a climate pledge – Nationally
Determined Contributions’ (NDCs) – covering emissions reductions as well as preparing for the
impacts of climate change by building up resilience. These NDCs come in all shapes and sizes
– some deal with mitigation, some adaptation, others both. They have different targets and
timeframes. There is a push to standardise them through annual climate negotiations but this is
difficult because of competing priorities, most especially amongst developed (known as Annex
1) and developing (known as Non-Annex 1) economies.
In June 2017, the US announced its intention to withdrawal from the Agreement; the formal exit
will take place on 4 November 2020. We do not expect any other Parties to withdraw.
Whose responsibility is it to reduce emissions?
Climate pledges are “nationally determined” which means there is no “central body” which
allocates the targets – Parties can choose whichever metric and ambition level depending on
their economic circumstances. There has historically been some disagreement over the varying
targets: which economies should do more or less, which have the finances, which need the
finances, etc.
This debate stems from emissions responsibility: current annual emissions, historical cumulative
emissions, or emissions per capita. We do not think there is a right or wrong answer here –
there are many points to consider on all sides. We do believe, as the UNFCCC is working
towards, that all economies should contribute to both reducing emissions and preparing for the
consequences.
Putting a price on carbon emissions
Carbon pricing is a mechanism that tries to capture the external costs of GHG emissions such
as healthcare, asset or crop damage; however, these external costs are not easy to quantify.
Pricing comes in various forms, depending on market conditions, the developmental state of the
economy, the climate commitments of the jurisdiction and the level of support from the
businesses and public involved. There are many considerations that determine potential
success such as the volume, form and source of emissions, the scope of coverage, price levels
and what the revenues are used for.
Chart 6: Overview of key carbon pricing schemes by emitter
Norway, #84, 63% Switzerland, #89, 35%
54 47
Sweden, #83, 40%
55
N Zealand,#66 52% Singapore, #57, 80%
81 100
France, #21, 37%
Ireland, #19, 48% 474 S Africa, #18 10%
Global GHG emission-wise rank
482 Australia, #16, N/A
533
557 Mexico, #13, 47% Canada, #14, 70%
S Korea, #12, 68%
Japan, #7, 68% 742 722
Europe, #4, 45% 746
China, #1, N/A
1,290 US, California, #3, 85%
4,380 13,000 6,510
1991 2005 2008 2010 2011 2012 2013 2014 2015 2018 2019
GHG emissions (MtC02), 2017 Country, #rank, %GHGs covered under carbon pricing
Source: PRIMAP, HSBC. Note: Y-axis denotes rank i.e. China is #1 emitter, Switzerland is #89
7Free to View ● Economics & Climate Change - Asia
September 2020
A number of governments around the world (national and sub-national) have tried to price
emissions with varying success (Figure 6). In the ASEAN region, Singapore enacted a carbon
tax which came into force in 2019, a mere two years after the first announcement during the
budget of February 2017. It covers all facilities with GHG emissions of 25KtCO2e or more and
is designed to tackle emissions at source. The tax has been set at SGD5/tCO2e (USD3.7) for
the 2019-23 period and may increase to SGD10-15/tCO2e (USD7.3-11) by 2030 after a review
in 2023. The covered facilities together account for about 80% of the country’s total GHG
emissions. Revenues from the tax will be used to further reduce emissions.
In 2011, China approved pilot regions to trial carbon emissions trading. These were launched in
2013-14 to see what worked and did not work for Chinese businesses. A soft national
emissions trading scheme was launched in December 2017 with participation from the power
generation and heat sector. The pilot schemes are currently still in operation and the World
Bank expects China to relaunch its National ETS in 2020.
This is a redacted version of the report published on 23-Sep-20. Please contact your HSBC
representative or email AskResearch@hsbc.com for information.
8Free to View ● Economics & Climate Change - Asia
September 2020
That sinking feeling
Rising sea levels are threatening metropolises such as Mumbai, Ho
Chi Minh City, Shanghai, Bangkok, and Jakarta
When exacerbated by groundwater depletion, some cities such as
Jakarta are literally sinking, begging for urgent action
Countries will have to make significant investments in mitigating
infrastructure, and in some cases, shifting populations
Rising sea levels
One of the most tangible impacts of climate change has been rising sea levels. The causes are
Rising sea levels is already
happening, and it threatens
mainly two-fold: thermal expansions caused by the warming of the ocean (water expands as it
the region’s most important warms) coupled with the increased melting of glaciers and ice sheets in the Arctic and
cities Antarctica. The science shows that ice melting is the main cause of sea level rise and that its
rate is accelerating (chart 7). Sea levels have risen about 2.6 inches between 1993 and 2014,
and based on a “conservative estimate” in a recent NASA study, they may rise by 26 inches
(65cm) by 2100. This poses immense risks to low-lying islands and coastal cities, with the risk
exacerbated by an increased rate of devastating storms. To make matters worse, in many
coastal locations, the pumping of ground water, upstream flood control, and other human-
induced factors increase vulnerability.
Asia is on the front-lines. According to an initial OECD study on the topic, of the top 20 cities with
The phenomenon
disproportionately impacts
the highest share of population exposed to sea-level-induced flooding by the 2070s, 15 are in
Asia Asia (see Table 10): 5 in ASEAN, 5 in Southeast Asia, 4 in mainland China, and 1 in Japan. As a
rule of thumb, cities built on the river deltas or estuaries, typically soft marshy land already prone
to flooding, are most at risk. Unfortunately, these are precisely the locations where Asia’s largest
and most economically, politically, and socially important metropolises are found. Take ASEAN
Chart 7: Rising sea levels is the most time-sensitive aspect of climate change
Global Mean Sea Lev el (mm) monthly 3m running mean
80
60
40 Trend=3.5mm/year
20
0
-20
-40
-60
1993 1995 1997 1999 2000 2002 2004 2006 2008 2010 2011 2013 2015 2017 2019
Source: CSIRO, ACE CRC, CRC Australia
9Free to View ● Economics & Climate Change - Asia
September 2020
as an example: Ho Chi Minh City and Bangkok host approximately 9% of their respective national
populations and contribute 26% and 33% to GDP, respectively. Both China and India’s
respective financial hubs, Shanghai and Mumbai, rank among the top-10 most impacted cities.
Parts of Tokyo are also extremely vulnerable. Rising sea levels cannot be ignored.
Chart 8. Affected urban population as a % Chart 9. Affected urban contribution as a
of national population in Asia, latest % of national GDP in Asia, latest
% %
16 35
30
12
25
20
8
15
10
4
5
0 0
Ningbo
Tianjin
Tokyo
Rangoon
Jakarta
Hai Phong
Kolkata
Shanghai
HCMC
Bangkok
Mumbai
Guangzhou
Ningbo
Khulna
Tianjin
Tokyo
Dhaka
Rangoon
Jakarta
Hai Phong
Kolkata
Chittagong
HCMC
Shanghai
Bangkok
Mumbai
Guangzhou
Source: CEIC, OECD, World Bank, PopulationStat, Statistics of Tokyo, PwC, and Source: CEIC, OECD, HSBC
various media reports
Another World Bank report yielded similarly alarming results when assessing the impact of
rising sea level on developing countries depending on various scenarios ranging from 1 to 5
meter increases. On an aggregate level, the affected population in East Asia and Southeast
Asia would rise from 2% (37 million) in the 1m scenario to almost 9% (162 million) in the 5m
Table 10: A ranking of the global cities most vulnerable to rising sea levels: It’s an Asia story
Future exposed City GDP ($bn, Country GDP
Rank Country Urban population ('000) % of population % of GDP 2019) ($bn, 2019)
1 India Kolkata 14,014 1.0 0.5 15 2,888
2 India Mumbai 11,418 1.1 3.0 85 2,888
3 Bangladesh Dhaka 11,135 6.3 312
4 Mainland China Guangzhou 10,333 1.1 2.4 341 14,364
5 Vietnam HCMC 9,216 9.4 26.2 68 260
6 Mainland China Shanghai 5,451 1.7 3.8 551 14,364
7 Thailand Bangkok 5,138 8.5 32.9 179 544
8 Myanmar Rangoon 4,965 15.3 15.5 12 76
9 USA Miami 4,795
10 Vietnam Hai Phong 4,711 2.1 4.6 12 260
11 Egypt Alexandria 4,375
12 Mainland China Tianjin 3,790 1.1 1.4 204 14,364
13 Bangladesh Khulna 3,641 0.6 312
14 Mainland China Ningbo 3,305 0.6 1.2 173 14,364
15 Nigeria Lagos 3,229
16 Cote D'ivoire Abidjan 3,110
17 USA New York - Newark 2,931
18 Bangladesh Chittagong 2,866 2.4 312
19 Japan Tokyo 2,521 11.0 19.5 989 5,080
20 Indonesia Jakarta 2,248 3.9 18.3 204 1,119
Source: CEIC, OECD, World Bank, PopulationStat, Statistics of Tokyo, PwC, and various media reports
10Free to View ● Economics & Climate Change - Asia
September 2020
Chart 11: Share of population impacted by Chart 12: Share of GDP impacted by rising
rising sea levels sea levels
% of population impacted by rising sea levels % of GDP impacted by rising sea levels
30 25
25 1-meter sceario 3-meter scenario 20 1-meter scenario 3-meter scenario
20 15
15
10
10
5
5
0
0
Cambodia
Sri Lanka
Taiwan
Vietnam
Mainland China
Indonesia
India
South Korea
Brunei
Philippines
Malaysia
Thailand
Pakistan
Myanmar (Burma)
Bangladesh
Mainland China
Indonesia
Sri Lanka
Taiwan
Myanmar
Cambodia
South Korea
Vietnam
Brunei
India
Philippines
Malaysia
Thailand
Pakistan
Bangladesh
Source: World Bank, HSBC Source: World Bank, HSBC
scenario, with similar ratio of GDP impacted. The impact varies across countries, but based on
metrics such as impacted area, population, GDP, and agriculture, Southeast Asia stands out –
in particular Vietnam (charts 11 and 12).
Unfortunately, with the use of new elevation data, recent studies have shown that the impact is
far greater than previously estimated. For example, a long-anticipated report prepared by the
United Nations Intergovernmental Panel on Climate Change (IPCC) in 2019 suggests that
coastlines are much more exposed to rising seas than previously anticipated. It argues that past
scenarios, such as the OECD report cited above, underestimated land loss and population
displacement by one-third (Asia Times, 8 January 2020)
Meanwhile, Climate Central (2019) employed a new model called CoastalDEM in assessing
New estimates from 2019
suggest rising sea levels will
global exposure to rising seas more accurately than the previous Shuttle Radar Topography
impact an even greater share Mission (SRTM) model, particularly in densely populated areas. It shows that around 300 million
of population people globally are vulnerable to rising sea levels in 2050, much higher than a previous
estimate of 79 million (Table 13). We show what this looks like on page 12. The risk is mostly
concentrated in Asia, with the below six countries accounting for up to 80% of the exposed
global population (table 13). In Vietnam, Indonesia and Thailand, rising water levels threaten a
much larger population under the new model. In addition, the research also shows that land
home to 200 million people could face permanent inundation by 2100.
Table 13: Top 6 countries of current population below the elevation of an average annual
flooding in 2050
Country SRTM (million) CoastalDEM (million)
Mainland China 29 93
Bangladesh 5 42
India 5 36
Vietnam 9 31
Indonesia 5 23
Thailand 1 12
Global 79 300
Source: Climate Central, Oct 2019
In addition to frequent flooding, rising sea levels can also result in parts of cities literally sinking
(Table 14). In fact, Jakarta is considered one of the fastest sinking cities in the world, due in
large part to subsidence, or the extraction of ground water from aquifers. The city has “sunk” 4m
in the past 30 years, with North Jakarta in particular sinking by 2.5m in the last decade
11Free to View ● Economics & Climate Change - Asia
September 2020
Table 14. Top 10 fastest sinking major cities
Country City
Indonesia Jakarta
Philippines Manila
Vietnam HCMC
USA New Orleans
Thailand Bangkok
Japan Osaka
Bangladesh Dhaka
Mainland China Shanghai
Italy Venice
Egypt Alexandria
Source: John Englander and Bangkok Post
(World Economic Forum, 2018). The combination of subsidence and rising sea levels is forcing
the government to take action. In fact, the Indonesian government announced a drastic plan of
capital relocation, which is expected to take 10 years and cost USD33bn (World Economic
Forum, 2019), shifting some population from Jakarta (mostly civil servants). Meanwhile, the
Philippines is facing similar problems. Manila is sinking at an annual rate of 10cm, also driven
by unchecked usage of water from groundwater sources (Bangkok Post, 2 September 2019).
In terms of impact on the broader economy, Vietnam is highly sensitive to rising sea levels (see
charts 11 and 12). Around 40-45% of land in Ho Chi Minh City is less than 1m above sea level, and
154 out of the city’s 322 communes and wards have history of frequent flooding (McKinsey Global
Institute, April 2020). This has serious implications, given the significance of HCMC to Vietnam.
Home to 9 million people, its contribution to Vietnam’s GDP is as high as 26% of GDP in 2019.
Fortunately, investments in mitigating infrastructure are already underway, but we believe further
fiscal resources will be required, posing a challenge for the Vietnamese government given already-
elevated levels of public debt.
But how costly will it to be protect against rising sea levels? We look to research from the ADB
Fully protecting against
rising sea levels could cost
(Asuncion and Lee, Working paper 507, 2017). By 2100, economic losses from rising sea levels
up to 52% of 2050 GDP in the may account for as much as 9.3% of global GDP. Hillen et al (2010) estimates that construction
case of Vietnam of dikes and sea walls tend to cost USD6.02 million per km of coastline per vertical meter of
protection. Diaz (2016) then estimates that for Asian economies, a full protection strategy could
cost up to 52% of 2050 GDP in the case of Vietnam (see chart 15 below).
Chart 15: Protecting against rising sea levels can be costly for some
Total protection costs from rising sea levels, % of 2050 GDP
60
52
48
50
40 37
33
31 31 30
30
19
20
12
8 7
10
0
0
VN SL CH BA IN TH SI JP MA ID PH CA
Source: Diaz, Delavane B. 2016. “Estimating Global Damages from Sea Level Rise with the Coastal Impact and Adaptation Model
12Free to View ● Economics & Climate Change - Asia
September 2020
16: Ho Chi Minh City: Land projected to be 17: Bangkok: Land projected to be below
below tideline by 2050 under base case tideline by 2050 under base case
Source: Climate Central (coastal.climatecentral.org) Source: Climate Central (coastal.climatecentral.org)
18: Mumbai: Land projected to be below 19: Manila: Land projected to be below
tideline by 2050 under base case tideline by 2050 under base case
Source: Climate Central (coastal.climatecentral.org) Source: Climate Central (coastal.climatecentral.org)
20: Pearl River Delta: Land projected to be 21: Shanghai: Land projected to be below
below tideline by 2050 under base case tideline by 2050 under base case
Source: Climate Central (coastal.climatecentral.org) Source: Climate Central (coastal.climatecentral.org)
13Free to View ● Economics & Climate Change - Asia
September 2020
Food security
More extreme weather events such as typhoons, monsoons,
droughts are jeopardizing food security in the region…
…exacerbating already vulnerable food supply chains in countries
such as India and the Philippines
We take a closer look at climate change-induced food security
implications for India, ASEAN, and China
A closer look at India, ASEAN, and China
Food Security is a situation that exists when all people, at all times, have physical, social and
economic access to sufficient, safe and nutritious food that meets their dietary needs and food
preferences for an active and healthy life. Climate change exacerbates the negative effects of
land degradation and desertification (loss of fertile soil, increased soil erosion, and lack of
organic material in the soil) through warming, precipitation and extreme weather events. This in
turn affects food security (and nutrition) although the effects vary by region and locality.
In Asia, we look largely at the impact of an increasing rate of extreme weather events. Based on
Parts of Asia were already
vulnerable from a food
previous analysis, regional economies already rank quite poorly when it comes to climate
security perspective change-induced vulnerability, which has implications for both regional and global food supply. In
this section, we look closer at food security implications for India, China, and ASEAN. In India,
we look predominantly at the impact of extreme temperatures, in ASEAN, we ascertain the
impact of typhoons and droughts, and in China we look at increased flooding.
Table 22. Agricultural sector risk scores (lower score implies higher risk)
Vulnerability score Agricultural sector risk score Agricultural sector risk rank
China 36.5 3 1
Indonesia 32.3 3.5 2
India 28.8 3.5 2
Malaysia 36.4 8.2 4
Vietnam 27.7 17.1 5
Thailand 35.5 24.4 6
Australia 51.7 36.2 7
Bangladesh 27.7 46 8
Philippines 24.8 54.8 9
Japan 34.3 64.6 10
Korea 41 360.8 11
Sri Lanka 20.5 437.8 12
New Zealand 48.9 1911.4 13
Singapore 53.1 n/a n/a
Source: FAO, HSBC
Note: The agricultural score is a product of vulnerability score and global share of commodities. Vulnerability score is calculated by taking each country’s exposure to climate
change and their potential to respond to climate change.
14Free to View ● Economics & Climate Change - Asia
September 2020
India
The three pillars of food security – availability, accessibility and absorption – are closely linked to
local and global environmental conditions. India’s challenges are further exacerbated by the fact that
it is forecasted be the most populous country in the world by 20271.
Availability: Impact on food production
Rising temperature and increased variability in rainfall impacts soil fertility and its moisture content. It
also increases the incidence of locust and pest attacks. Various studies have tried to quantify the
impact these changes on crop yields.
An IMF report has estimated a fall in crop yields by up to 25% by 2080 for developing countries2.
Another study by the National Innovations on Climate Resilient Agriculture based on simulation
models projects that rice yields in India may fall by 7% by 20503. An RBI study focused on India
estimates that one standard deviation increase in high temperature days pulls down crop yields by
12.6% and real wages by 9.8%4. Putting them together, these studies predict a fall in the yields of
major crops by 7-25% over the next 30 to 50 years. Unless appropriate measures are implemented,
India’s food security will remain vulnerable to weather-induced disruption.
Furthermore, the impact of climate change is not limited to crop production. It can also be felt across
animal husbandry and fisheries. Studies show that heat stress have a negative impact on fertility and
reproductive behaviour of cows and buffaloes.
Likewise, changes in ocean temperature, currents, acidification, too, have an impact on fish
production. A global FAO report projects a fall in maximum catch potential in the range of 2.8% to
12.1% in the world’s exclusive economic zones by 2050 based on different greenhouse gas
emission scenarios5.
Accessibility: Impact on income and inflation
Climate change is likely to impact access to food, both directly and indirectly. India is home to
370 million poor people and they are likely to face a double whammy of rising food prices and
falling farm incomes6.
Calculating the income impact for farmers is a bit tricky due to opposite forces at play. On the one
hand lower yields are likely to lower income. But on the other hand, lower supply tends to push prices
higher. The economic survey of India finds that the loss in income due to lower yields tend to
outweigh the gains from rising prices, resulting in lower farm income (see table 23).
Table 23: Impact of climate change on agriculture yields and farm revenue
_______ Agriculture yields ________ ______ Farm revenue ________
In percentage Extreme Extreme rainfall Extreme Extreme
temperature shock shock temperature shock rainfall shock
Average Kharif 4.0 12.8 4.3 13.7
Irrigated 2.7 6.2 7.0 7.0
Unirrigated 7.0 14.7 5.1 14.3
Average Rabi 4.7 6.7 4.1 5.5
Irrigated 3.0 4.1 3.2 4.0
Unirrigated 7.6 8.6 5.9 6.6
Source: Economic Survey 2018, IMD, ICRISAT, HSBC
______________________________________
1 World Population Prospects report, United Nations, 2019
2 "Global Warming and Agriculture", William R. Cline, IMF quarterly magazine, March 2008
3 "Climate Change Poses Serious Threats to India's Food Security", Siraj Hussain, The Wire, September 2019
4 "Climate Change: Macroeconomic impact and policy options for mitigating risks", RBI bulletin, April 2020
5 "Impacts of climate change on fisheries and aquaculture", Food and Agriculture Organization of the United Nations, 2018
6 "Charting pathways out of multidimensional poverty: Achieving the SDGs", Global Multidimensional Poverty Index (MPI)
by the United Nations Development Program (UNDP) Human Development Report, 2020
15Free to View ● Economics & Climate Change - Asia
September 2020
At a national level, rising temperatures and changing monsoon rainfall patterns could cost India
2.8% of GDP per capita by 20507.
The impact of climate change is not just a long-term phenomenon. An RBI study correlating
food inflation with precipitation index (computed as rainfall deviation from long-run average)
throws up evidence of significant short term impact as well. It finds a strong correlation (of 0.7 in
a 12-month rolling coefficient analysis, starting January 2012) between changing precipitation
trends and food inflation, particularly vegetable inflation. Furthermore, the impact of rainfall
lingers for 5-6 months in case of both overall food inflation and vegetable inflation.
Utilization: Impact on nutrition and physical productivity
As per the 2019 Global Hunger Index, India ranked 102 out of 117 countries. There are 189
million undernourished people in India8. Overuse of fertilizer, land degradation and poor water
quality impact both the quality and the quantity of food production. And poor and unsanitary living
conditions, lack of healthcare and pollution tend to adversely impact the absorption of nutrients in
the body. Challenges of climate change could only intensify these undernourishment troubles.
ASEAN
Food security has been, and continues to be a paramount consideration for ASEAN policymakers. In
ASEAN nations continue to
see bouts of food inflation,
2008, the issue came to the limelight as regional prices of major cereals like rice, wheat, and maize
such as the Philippines in rose by c40%. Such a bout of food inflation has acute implications for development and poverty
2018 and Vietnam in 2019 reduction, given that it impacts the bottom 20% of the population the most. Looking back, a number
of factors played a role in driving the food crisis: restrictive trade policies, higher oil prices, and
greater demand for biofuel. Improvements have been made since, but as we saw in the Philippines
inflation scare in 2018, the region still has food supply vulnerabilities. Climate change will increasingly
make things worse.
24. Oceanic Niño Index shows increase in intensity of oscillation in oceanic temperature
over time with the last El Nino being the most intense in 2015
Index
2.5
2.0 El Niño
1.5
1.0
0.5
0.0
-0.5
-1.0
-1.5
La Niña
-2.0
Nov-50 Apr-56 Sep-61 Feb-67 Jul-72 Dec-77 May-83 Oct-88 Mar-94 Aug-99 Jan-05 Jun-10 Nov-15
OceanicNino
Oceanic NiñoIndex
Index(3(3months
monthsaverage)
average)
Source: NOAA
For example, storms that strike Southeast Asia have been intensifying over the last four
decades (Scientific American, September 2016). In fact, researchers found that typhoon
intensity had increased basin-wide since the late 1970s and suggested that another 14 percent
increase in intensity could be expected by the end of the century (Wei Mei and Shang-Ping Xie,
2016), as the ocean takes up the excess heat trapped by greenhouse gases. The researchers
concluded that the proportion of storms that strike land as category 4 and 5 in the Western
______________________________________
7 "South Asia’s Hotspots: The Impact of Temperature and Precipitation Changes on Living Standards", World bank, 2018
8 "The State of Food Security and Nutrition in the World", World Food Programme, 2020
16Free to View ● Economics & Climate Change - Asia
September 2020
Pacific is rising because of warmer coastal waters. This suggests that typhoon-induced damage
on agricultural production in places like the Philippines and Vietnam is set to increase.
One of the major climate distortions that the region faces typically comes from the El Niño or La
New research suggests that
climate change is increasing
Niña: phenomena that involve fluctuating ocean temperatures in the central and eastern Pacific.
the intensity of El Niños, El Niño is characterized by unusually warm ocean temperatures Pacific, which can exacerbate
yielding more ferocious extreme weather events. While the literature on the linkage between El Niño and climate
typhoons and droughts change is somewhat inconclusive, new research finds that climate change is increasing the
frequency of extreme El Niño events, leading to intensifying droughts, worsening floods, and
shifting storm patterns.9 In particular, El Niños are now forming closer to the Asian continent
compared to before, increasing the risk of intense typhoons striking land. For example, before
1978, 12 of 14 El Niños forms east of the International Dateline, while since 1978, all 11 have
formed in the central or western Pacific Ocean.
25. Both intensity and frequency of El Niño and La Niña conditions are rising
Jan Feb Mar Apr May Jun Jul Aug Sep Oct Nov Dec
1990
1991
1992
1993
1994
1995
2015
2016
2017
2018
2019
2020
Source: NOAA, HSBC
Chart 24 shows temperature fluctuations since the 1950s. A rise in the Oceanic Niño Index
(ONI) beyond 0.5 results in El Niño conditions, while a drop below -0.5 results in La Niña
conditions. Since the 1970s, the fluctuations increased in terms of both frequency and intensity,
implying greater disruptions from both El Niño and La Niña. In Chart 25, we compare two
periods – post 2015 and early 1990s. The later period (post 2015) shows much higher
frequency of these incidents happening.
Implications for inflation and trade
Historically, El Niño conditions are accompanied by a spike in food prices in the ASEAN region,
especially towards the end of the El Niño period due to shock in supply typically stemming from
drought conditions. Chart 26 shows food inflation for ASEAN-6 and the grey shaded area
highlights the El Niño periods. In particular, rice production tens to fall sharply during El Niño
periods, and relatively restrictive trade policies across the region could exacerbate such spikes.
A “super” El Niño can cause thousands of deaths from severe heat, flooding, and coastal
storms. According to the UN, the 1997-1998 “super” El Niño caused USD96bn in damage10.
______________________________________
9 Proceedings of the National Academy of Sciences, Historical change of El Nino properties sheds light on future changes
of extreme El Nino, 28 June 2019
10 https://www.un.org/press/en/2000/20001027.unep76.doc.html
17Free to View ● Economics & Climate Change - Asia
September 2020
26. El Niño periods tend to have higher food prices
% y-o-y
25.0
20.0
15.0
10.0
5.0
0.0
-5.0
2000 2001 2002 2003 2004 2005 2007 2008 2009 2010 2011 2012 2014 2015 2016 2017 2018 2019
Indonesia Malaysia Philippines Singapore Thailand Vietnam, RHS
Source: CEIC, NOAA, HSBC
We find that in ASEAN, Philippines and Indonesia are most vulnerable, largely due to broader
and pre-existing concerns about food security. The Global Food Security Index (GFSI) data by the
Economist Intelligence Unit (Chart 27) allows us to frame the conversation. The index is based on
three core issues namely affordability, availability and quality across a set of 113 countries in the
world. Philippines is the worst performer among ASEAN-6 in this index due to lower affordability of
essential food items and the impact on nutrition in the country. As a result, the country is unable to
fulfil the dietary needs of people below the poverty line, leading to stunted development indicators.
Most worryingly, however, is that much of the Philippines arable land is in the typical typhoon
trajectory, and typhoons are expected to occur more frequently.
Active government policy is essential to combat food insecurity in the region. The Philippines
seeks to end hunger and all forms of malnutrition by 2030. This is a commitment that the
country made during its adoption of the global 2030 Sustainable Development Agenda, which
involves attaining, where applicable, 17 sustainable development goals (SDG) and
accompanying 169 targets during the United Nations General Assembly in September 2015.
Increasing investments in rural infrastructure, agricultural research, technology development, and
plant and livestock gene banks are crucial to enhance agricultural productivity. Moreover,
preventing trade restrictions and distortions in regional agricultural markets are needed to ensure
the proper functioning of food commodity markets and help limit extreme food price volatility. In the
Philippines, the removal of quantitative import restrictions on rice, which exacerbated a rice
27: The Philippines and Indonesia have the 28: Which corresponds to lingering
lowest food security rankings… development issues, such as stunting
Index %
100 45
40
80 35
30
60
25
40 20
15
20 10
5
0
0
PH ID VN TH MA SI
Overall Affordability Thailand Malaysia Vietnam Indonesia Philippines
Availability Quality and Safety 2000 2019
Source: EIU, HSBC Source: IFPRI, HSBC
18Free to View ● Economics & Climate Change - Asia
September 2020
29: Most economies rely on imports for 30: Governments have focused on
consumption of cereals increasing rice yields to improve resilience
Cereal import as % of total supply
100 6.0 Rice yield
80
5.0
60
40 4.0
20 3.0
0
2.0
-20
-40 1.0
-60
0.0
-80 1961 1969 1977 1985 1993 2001 2009 2017
TH VN ID PH MA Indonesia Malaysia Philippines
2000-2002 2015-2017 Thailand Vietnam
Source: FAO, HSBC Source: FAO, HSBC
inflation shock in 2018, was a positive development. In Indonesia, food security has been one of
President Jokowi’s top priorities. For the last five years, the policy direction of the Food Security
Agency in Indonesia has been focused on three main areas – food availability, food accessibility
and food utilisation. The government has ensured ample availability of rice through increased
imports, which has kept food prices in Indonesia relatively stable.
Across the region, there has been a strong focus on increasing rice yields to improve self-
sufficiency, given that all countries except Thailand and Vietnam are reliant on imports (chart
29). To understand the problem of food security more thoroughly, we analysed rice production
and consumption data, given that rice is the primary food staple in the region. Chart 30 shows
rising rice yields in ASEAN.
However, the high level of dependence on rice is a problem. Much of the population is replacing
local, more nutritious cereal options (e.g. sorghum, corn, tubers, and root vegetables) with processed
white rice in their diet, which contains less fibre and nutrients. This directly contributes to factors such
as stunting, which directly impacts the health and productivity of the population, and it remains a
serious challenge, especially in Indonesia and the Philippines (Charts 28, 31, 32). As such, there
needs to be a focus on nutrition security, not just food security, when it comes to policy.
31. Proportion of undernourished people 32. Mortality rate in children under five
in the population has fallen years is lowest in Malaysia and Thailand
% %
30 6
25 5
20 4
15 3
10 2
5 1
0 0
Malaysia Thailand Indonesia Vietnam Philippines Malaysia Thailand Vietnam Indonesia Philippines
2000 2019 2000 2019
Source: IFPRI, HSBC Source: IFPRI, HSBC
19Free to View ● Economics & Climate Change - Asia
September 2020
China food security
Global warming limits China’s food production potential
Studies have shown that for every 1°C increase in temperature, crop yield will decrease by
10%. Under high temperature conditions, the growth period of crops is shortened and the
growth rate is reduced, which may offset the effect of extending the annual growth period.
According to China Meteorological Administration, every time the temperature rises by 1°C, the
growth period of rice in China will be shortened by an average of 7-8 days, and the growth
period of winter wheat will be shortened by an average of 17 days.
As the growth period is shortened, the time for crops to accumulate dry matter through
photosynthesis is reduced, and the quality will also decrease. On the premise that the current
planting system, planting varieties and production levels remain unchanged, the production
potential of China's farming industry may decrease by 5%-10% by 2030, with the output of
irrigated and rain-fed spring wheat expected to decrease by 17.7% and 31.4%, respectively
(China Meteorological Administration, 2009). From 2071 to 2100, China's winter wheat
production potential will drop by 10%-30%, rice production potential will drop 10%-20%, and
corn production potential will drop 5%-10%, according to the same source.
More frequent natural disasters raise concerns over impact on food supply and inflation
While China has barely gotten back on its feet from the COVID-19 crisis, heavy rainfalls and
floods along the Yangtze River starting in May have made the path to recovery bumpier for the
economy. In fact, if we look retrospectively at the history of natural disasters in China, it is quite
obvious that catastrophic floods have become more frequent in China in the recent decade
(based on the level of direct economic loss caused by floods every year, see Chart 33).
Between 1997 and 2009, China only experienced one major flood in 1998. However, in the
recent decade (2010-2020), major floods hit every three to four years, which is likely a result of
the rising intensity and frequency of El Niño.
Chart 33: Catastrophic flooding has become more frequent in China in the recent decade
RMB bn
400
350
300
250
200
150
100
50
0
1997 1999 2001 2003 2005 2007 2009 2011 2013 2015 2017
Direct economic losses caused by floods
Source: China Floods and Droughts Communique (2018), HSBC
More catastrophic floods can impact China's economic growth in many ways, including
destroying assets, affecting industrial production and reducing services demand. In addition,
concerns have been rising over the potential impact of natural disasters on food supply and
food inflation in China, particularly as food prices raised sharply on a sequential basis in the
recent months due to supply disruptions. Looking retrospectively, we found that catastrophic
floods can reduce vegetable supply and lift its prices most significantly, while the impact on
meat and grain is relatively smaller. Therefore, it is indeed possible if major floods become
increasingly frequent in the future, food inflation may see more volatility going forward.
20Free to View ● Economics & Climate Change - Asia
September 2020
Chart 34: Flooding starting May has lifted q-o-q growth in food prices in China
% q-o-q
8
6
4
2
0
-2
-4
-6
Jan Feb Mar Apr May Jun Jul Aug Sep Oct Nov Dec
2010 2013 2016 2020 Average
Source: Wind, HSBC
That said, we believe China's better management of floods and other natural disasters has helped
contain their overall adverse impact on agriculture in the recent years, and is likely to help mitigate
the threats posed by natural disasters on food security in the future. As shown in Chart 35, the
area of crops affected by natural disasters has shown a downward trend. While summer rainfall
along the Yangtze River in 2016 was at a similar level as in 1998, the area of farms affected was
much smaller than in 1998. Meanwhile, the construction of water conservancy projects is not only
conducive to fighting floods, but has also helped mitigate the impact of droughts. In the past 20
years, the drought-affected area of crops has also drastically fallen.
Chart 35: Area for crops affected by natural disasters has been falling in the recent years
60 mn hectares
50
40
30
20
10
0
1980 1985 1990 1995 2000 2005 2010 2015
Floods Droughts Other natural disasters
Source: Wind, HSBC
21Free to View ● Economics & Climate Change - Asia
September 2020
A (big) part of the problem
Asia has accounted for a staggering 87% of global greenhouse gas
(GHG) emissions growth since 1990
Countries in the region have made commitments under the Paris
Agreement, but the scope and progress of the pledges vary
Curbing Asia’s burgeoning coal consumption and reversing high
rates of deforestation are key to realizing a “1.5°C” world
Looking within
Asia is not just on the receiving end of climate change: it has become an integral part of the problem.
Asia accounted for 87% of
global greenhouse gas
According to data from Global Carbon Project, the region accounted for 87% of global greenhouse
emission growth since 1990 gas (GHG) and 78% of CO2 emissions growth since 1990. China alone has accounted for 60% of
the increase in global GHG, with India and ASEAN filling in much of Asia’s remaining contribution
(chart 36). This leads us to a simple conclusion: stemming and ultimately reversing the explosive
emissions growth from Asia is necessary if the world has any chance of addressing climate change.
But it gets more complicated. While it is true that developed economies managed to reduce
greenhouse gas emissions thanks to policy initiatives promoting greater energy efficiency, they
also effectively shifted the most polluting industries, such as steel production and
petrochemicals, to emerging markets, de-industrializing at home while enjoying cheaper
imported products. Moreover, we acknowledge that high emissions growth in developing
markets is unavoidable as economies urbanize and develop from a low base. But this does not
mean that Asia should be absolved of responsibility: coal consumption continues to grow despite the
availability of other low-cost options, especially in China, Indonesia, Vietnam, and India, and
preventable deforestation was a major emissions contributor in Southeast Asia. While it is fortunate
that all regional economies signed the Paris Agreement, pledging sizeable reduction in emissions
through 2030, the scope and progress of the pledges are mixed.
Chart 36. Asia accounted for c90% of incremental greenhouse gas emissions since 1990
Increase in Greenhouse Gas emissions (MtCO2e)
1200
1000
800
600
400
200
0
-200
-400
1992-1996 1997-2001 2002-2006 2007-2011 2012-2016
China India ASEAN Japan Korea Rest of World
Source: World Bank, Our World in Data, Global Carbon Project, HSBC
22Free to View ● Economics & Climate Change - Asia
September 2020
Chart 37. Carbon dioxide emissions have once again started to rise, driven by China
and India
1750 Increase in carbon dioxide emissions (MtCO2e)
1500
1250
1000
750
500
250
0
-250
-500
-750
-1000
90 91 92 93 94 95 96 97 98 99 00 01 02 03 04 05 06 07 08 09 10 11 12 13 14 15 16 17 18
USA EU China India ASEAN ROW World
Source: World Bank, Our World in Data, Global Carbon Project, HSBC
While we tend to focus on overall greenhouse gases (GHG) in this report, in Chart 37, we look more
closely at carbon dioxide, which accounts for 81% of GHG and for which we have more timely
country and sector-level data. Chart 37 shows how mainland China drove a sharp increase in global
emissions growth in the early 2000s, which coincided with an extended period of robust
manufacturing and industrial growth after the country was admitted to the World Trade Organization.
More recently, India’s contribution has grown rapidly, overtaking China in multiple years since 2012.
Meanwhile, in 2015, ASEAN accounted for the 95% of global CO2 emissions due to forest fires.
The data show the stark reality how Asia is driving a renewed increase in global emissions since a
trough in 2015. Failure to contain emissions means there is simply no way for the world to meet a
1.5°C Paris Agreement compatible goal (refer to page 6). In Chart 38, we show each country’s
growth in total CO2 emissions since the turn of the century. While emission growth has broadly
moderated since the signing of the Paris Agreement, key exceptions are unsurprisingly Asia’s three
fastest growing economies: Vietnam, Bangladesh, and India. This reflects the tight correlation
between economic development and emissions growth. According to the Environmental Kuznets
Curve, greenhouse gas emissions, or environmental degradation, tend to increase with per capita
economic growth. As economies urbanize and develop, energy use rises. However, the EKC
suggests that emissions per capita tend to subside at higher levels of per capita income.
While some recent studies have cast doubt about the EKC (World Development, David Stern, The
Rise and Fall of the Environmental Kuznets Curve, August 2004), we find that the data in Asia
Chart 38. Total emissions growth by country (add Korea, Japan)
20 Growth in CO2 emissions
15
10
5
0
-5
-10
VN BA India ID MY PH USA China World TH SG EU28
2000-2015 2015-2017 2018
Source: Our World in Data, Global Carbon Project, World Bank, HSBC
23You can also read