Cost-effectiveness of MRI targeted biopsy strategies for diagnosing prostate cancer in Singapore
←
→
Page content transcription
If your browser does not render page correctly, please read the page content below
Cheng et al. BMC Health Services Research            (2021) 21:909
https://doi.org/10.1186/s12913-021-06916-0

 RESEARCH ARTICLE                                                                                                                                    Open Access

Cost-effectiveness of MRI targeted biopsy
strategies for diagnosing prostate cancer in
Singapore
Li-Jen Cheng1†, Swee Sung Soon1†, Teck Wei Tan2, Cher Heng Tan3,4, Terence Sey Kiat Lim5, Kae Jack Tay6,
Wei Tim Loke7, Bertrand Ang8, Edmund Chiong9,10 and Kwong Ng1*

  Abstract
  Background: To evaluate the cost-effectiveness of six diagnostic strategies involving magnetic resonance imaging
  (MRI) targeted biopsy for diagnosing prostate cancer in initial and repeat biopsy settings from the Singapore
  healthcare system perspective.
  Methods: A combined decision tree and Markov model was developed. The starting model population was men
  with mean age of 65 years referred for a first prostate biopsy due to clinical suspicion of prostate cancer. The six
  diagnostic strategies were selected for their relevance to local clinical practice. They comprised MRI targeted biopsy
  following a positive pre-biopsy multiparametric MRI (mpMRI) [Prostate Imaging – Reporting and Data System (PI-
  RADS) score ≥ 3], systematic biopsy, or saturation biopsy employed in different testing combinations and
  sequences. Deterministic base case analyses with sensitivity analyses were performed using costs from the
  healthcare system perspective and quality-adjusted life years (QALY) gained as the outcome measure to yield
  incremental cost-effectiveness ratios (ICERs).
  Results: Deterministic base case analyses showed that Strategy 1 (MRI targeted biopsy alone), Strategy 2 (MRI
  targeted biopsy ➔ systematic biopsy), and Strategy 4 (MRI targeted biopsy ➔ systematic biopsy ➔ saturation
  biopsy) were cost-effective options at a willingness-to-pay (WTP) threshold of US$20,000, with ICERs ranging from
  US$18,975 to US$19,458. Strategies involving MRI targeted biopsy in the repeat biopsy setting were dominated.
  Sensitivity analyses found the ICERs were affected mostly by changes to the annual discounting rate and
  prevalence of prostate cancer in men referred for first biopsy, ranging between US$15,755 to US$23,022.
  Probabilistic sensitivity analyses confirmed Strategy 1 to be the least costly, and Strategies 2 and 4 being the
  preferred strategies when WTP thresholds were US$20,000 and US$30,000, respectively.
  Limitations and conclusions: This study found MRI targeted biopsy to be cost-effective in diagnosing prostate
  cancer in the biopsy-naïve setting in Singapore.

* Correspondence: ng_kwong_hoe@moh.gov.sg
†
 Li-Jen Cheng and Swee Sung Soon contributed equally to this work.
1
 Agency for Care Effectiveness, Ministry of Health, Singapore, 16 College
Road, Singapore 169854, Singapore
Full list of author information is available at the end of the article

                                         © The Author(s). 2021 Open Access This article is licensed under a Creative Commons Attribution 4.0 International License,
                                         which permits use, sharing, adaptation, distribution and reproduction in any medium or format, as long as you give
                                         appropriate credit to the original author(s) and the source, provide a link to the Creative Commons licence, and indicate if
                                         changes were made. The images or other third party material in this article are included in the article's Creative Commons
                                         licence, unless indicated otherwise in a credit line to the material. If material is not included in the article's Creative Commons
                                         licence and your intended use is not permitted by statutory regulation or exceeds the permitted use, you will need to obtain
                                         permission directly from the copyright holder. To view a copy of this licence, visit http://creativecommons.org/licenses/by/4.0/.
                                         The Creative Commons Public Domain Dedication waiver (http://creativecommons.org/publicdomain/zero/1.0/) applies to the
                                         data made available in this article, unless otherwise stated in a credit line to the data.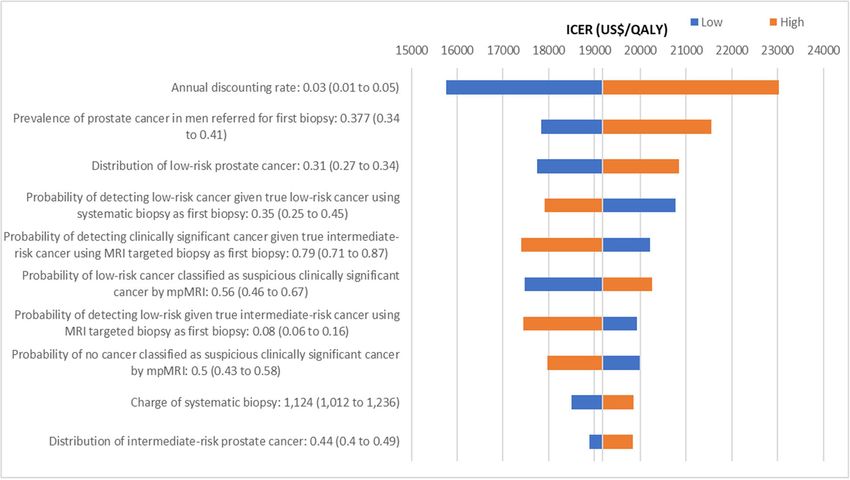
Cheng et al. BMC Health Services Research   (2021) 21:909                                                        Page 2 of 16

Introduction                                                     diagnostic sequences can shed light on resource alloca-
Prostate cancer is the second most common cancer di-             tion in prostate cancer diagnosis in the initial and repeat
agnosed and the fifth most fatal cancer amongst men              biopsy settings. This is particularly pertinent as mpMRI
globally [1]. In Singapore, prostate cancer is the third         and MRI targeted biopsy are becoming the standard of
most common cancer in men, accounting for 14.1% of               care in diagnosing prostate cancer [16, 17].
cancers diagnosed and 5.8% of total cancer deaths in               This study aims to evaluate the cost-effectiveness of
men from 2013 to 2017 [2]. The discordant incidence              six diagnostic strategies involving MRI targeted biopsy
and mortality reflect prostate cancer’s indolent growth          for diagnosing prostate cancer in initial and repeat bi-
and low fatality especially when diagnosed without me-           opsy settings from the Singapore healthcare system
tastasis [3, 4], and potential overdiagnosis of clinically in-   perspective.
significant cancer partly contributed by the limitations
of prostate-specific antigen (PSA) testing [5, 6]. Cur-          Methods
rently, there is no population-wide screening recom-             Patient population
mended for the early detection of prostate cancer in             The starting model population was men aged 65 years
Singapore. Individual men aged 50 to 70 years with life          clinically suspected of having localized prostate cancer
expectancy exceeding 10 years may be offered PSA test-           based on elevated serum PSA above 4 ng/ml, abnormal
ing after discussing its potential benefits and harms [7].       digital rectal examination (DRE), or both, and referred
   Distinguishing clinically significant prostate cancer         for a first prostate biopsy. The starting age of 65 years
from clinically insignificant ones is central to the             was used as it corresponded with the estimated age re-
management of prostate cancer. While the definition              cording a marked increase in age-specific incidence rate
of clinical significance continues to evolve [8], the            of prostate cancer in Singapore [18]. Men presenting de
underpinning approach is accurate detection and                  novo with metastases due to prostate malignancy were
characterization of clinically significant cancer to im-         excluded as they almost never require MRI targeted bi-
prove morbidity and mortality while minimizing ad-               opsy for initial prostate cancer diagnosis due to the pres-
verse effects of unnecessary treatments. Limiting                ence of locally advanced cancer in addition to their
treatment of clinically insignificant cancers that do            metastases.
not threaten life expectancy can reduce overdiagnosis
and overtreatment [9].                                           Diagnostic strategies
   Contemporary non-targeted transrectal or transperi-           Table 1 shows six diagnostic strategies relevant to the
neal prostate biopsies rely on real-time ultrasound guid-        local practice that were evaluated in the model. They in-
ance. Despite good imaging of the prostate gland                 volved MRI targeted biopsy, systematic biopsy, and
boundaries and its adjacent organ structures, ultrasound         saturation biopsy, employed in different testing combi-
cannot distinguish malignant lesions from benign ones            nations and sequences. In Singapore’s context, MRI tar-
[10]. Ultrasound alone is also insufficient to target spe-       geted biopsy refers to MRI-ultrasound (US) fusion
cific lesions as about 40% are isoechoic [11]. The inabil-       targeted biopsy combined with systematic biopsy as a
ity to target specific lesions can lead to sampling errors       combined technique has been shown to improve detec-
and inaccurate risk stratification which can affect subse-       tion of clinically significant cancer [19–22]. Locally, a
quent clinical management decisions. Targeted biopsy             12-core systematic biopsy is the more common system-
techniques can potentially circumvent these limitations.         atic biopsy performed. This definition of MRI targeted
Accumulating evidence supports the use of prebiopsy              biopsy is consistent with a recent Cochrane review [23].
multiparametric magnetic resonance imaging (mpMRI)                 A positive prebiopsy mpMRI with a Prostate Imaging
followed by magnetic resonance imaging (MRI) targeted            – Reporting and Data System (PI-RADS) score of 3 to 5
biopsy as they detect more high-grade cancers with               was subjected to further testing by MRI targeted biopsy.
fewer biopsy cores, while reducing detection of low-             In the initial biopsy setting, patients with negative
grade clinically insignificant cancers [12–15]. To assess        mpMRI did not proceed to biopsy; in repeat biopsy set-
the value of such tests, cost-effectiveness studies can be       tings, patients with negative mpMRI received systematic
conducted to simulate costs and effects of a new testing         biopsy alone if there was persistent clinical suspicion.
strategy and subsequent treatment options compared to            Although saturation biopsy is also a form of systematic
existing strategies. Most published cost-effectiveness           biopsy, it typically involves extracting 20 or more cores
studies focus on a single biopsy protocol which do not           [24]. Saturation biopsy was assumed to be template
reflect the use of MRI targeted biopsy in real life when         prostate mapping biopsy using a 5 mm sampling frame
multiple diagnostic strategies are used. A comprehensive         [25]. All prostate biopsies can be performed transrectally
comparison of all clinically relevant diagnostic strategies      or transperineally with local or general anesthesia, and
involving MRI targeted biopsy positioned in various              are associated with bleeding, infection, and urinary
Cheng et al. BMC Health Services Research          (2021) 21:909                                                                           Page 3 of 16

Table 1 Diagnostic strategies evaluated in the model
Strategy                                                                                     Diagnostic pathway
Strategy 1                                                                                   MRI targeted biopsy
Strategy 2                                                                                   MRI targeted biopsy ➔ Systematic biopsy
Strategy 3                                                                                   MRI targeted biopsy ➔ Saturation biopsy
Strategy 4                                                                                   MRI targeted biopsy ➔ Systematic biopsy ➔ Saturation biopsy
Strategy 5                                                                                   Systematic biopsy ➔ MRI targeted biopsy
Strategy 6                                                                                   Systematic biopsy ➔ MRI targeted biopsy ➔ Saturation biopsy
Abbreviation: MRI magnetic resonance imaging
Note:
1. MRI targeted biopsy refers to the administration of MRI targeted biopsy combined with systematic biopsy following a positive mpMRI.
2. Arrow (➔) refers to next sequence of diagnostic test following a negative biopsy result.

retention risks [26, 27]. The model assumed that pa-                              dearth of real-world local data on downstream manage-
tients received a maximum of three biopsies for initial                           ment pathways and resources, distribution of care strat-
diagnosis of prostate cancer if clinical suspicion                                egies, and distribution of localized prostate cancer across
remained.                                                                         cancer risks, a survey was co-developed and adminis-
                                                                                  tered to clinician experts from October 2018 to January
Model structure and key specifications                                            2019. Each of the five local public healthcare institutions
A model combining a decision tree and Markov sub-                                 offering MRI targeted biopsy, and a specialty cancer cen-
models was developed in consultation with local clini-                            ter, was represented by a clinician expert to provide and
cians to ensure face validity (see Fig. 1). The decision                          coordinate inputs from their practice setting. A total of
tree described the detection of prostate cancer and eval-                         six responses were received. Clinician experts that pro-
uated the likelihood of men classified as having no can-                          vided inputs included urologists, radiologists, and med-
cer, or localized prostate cancer of various risk levels                          ical oncologist.
conditional on their true disease status. The Markov
sub-models described disease progression conditional                              Natural history and management strategies
upon the risk level of the detected localized prostate                            Based on the number of patients suspected of prostate
cancer. These sub-models included the natural history of                          cancer referred to public healthcare institutions for the
localized prostate cancer, downstream management                                  first biopsy in the past 5 years, the estimated prevalence
strategies and death.                                                             of prostate cancer in men referred for the first biopsy
  The model was simulated over 20 years using annual                              was 37.7%. The risk of disease progression from local-
cycle length, in line with the estimated life expectancy                          ized prostate cancer to metastasis and the risk of death
for men at age 65 years in Singapore [28]. During the                             depends on age, tumor risk, and prostate cancer man-
simulated time horizon, patients moved through the                                agement strategy [30]. The model used the European
model based on different transition probabilities to ac-                          Association of Urology (EAU) risk groups for localized
crue costs and effects for each diagnostic strategy.                              prostate cancer – low-risk, intermediate-risk, and high-
  The outcome measure of the model was quality-                                   risk prostate cancer defined by PSA levels, International
adjusted life years (QALYs). Incremental cost-                                    Society of Urology Pathology (ISUP) grades, or clinical
effectiveness ratios (ICERs) were calculated from pair-                           tumor categories [16]. Low-risk prostate cancers were
wise comparisons of incremental costs and QALYs of                                clinically insignificant, while intermediate or high-risk
the six diagnostic strategies. An annual discounting rate                         prostate cancers were clinically significant [31].
of 3% was applied to both costs and effectiveness. All                               Conventional prostate cancer management strategies
analyses were conducted from the Singapore healthcare                             considered in the model included active surveillance
system perspective, and all costs were in 2020 United                             which involved active disease monitoring and potentially
States (US) dollars ($, USD1 = SGD1.36) [29].                                     curative therapy if the cancer progressed [9]; watchful
  The model was built using TreeAge Pro 2018 R2.0                                 waiting which is palliative in nature [16]; and active
(TreeAge Software, Inc., MA). Analyses were performed                             treatment involving radical prostatectomy or radiother-
using Monte Carlo simulation (seed number set at 16).                             apy with or without androgen deprivation therapy [16].
                                                                                  In the model, after a biopsy-confirmed diagnosis of lo-
Model input parameters                                                            calized prostate cancer, management strategies were
Model input parameters were obtained from published                               assigned based on the patient’s risk stratification, disease
data where possible and available. To overcome the                                status, and whether the treatment intent was curative or
Cheng et al. BMC Health Services Research (2021) 21:909 Page 4 of 16 Fig. 1 (See legend on next page.)
Cheng et al. BMC Health Services Research      (2021) 21:909                                                                           Page 5 of 16

 (See figure on previous page.)
 Fig. 1 Simplified schema of model structure. Abbreviations: CRPC, castration-resistant prostate cancer; mpMRI, multiparametric magnetic
 resonance imaging; PI-RADS, Prostate Imaging – Reporting and Data System scores. Notes. 1. MRI targeted biopsy refers to the administration of
 MRI targeted biopsy combined with systematic biopsy following a positive mpMRI. 2. Diagnostic tests used only in repeat biopsy settings (i.e. as
 second or third biopsy) are represented in dotted lines.

palliative (see Additional file 1 for distribution of care                    All prostate cancer-related deaths were assumed to
strategies for localized prostate cancer of various                         occur following metastatic disease. In any health state,
risks). Upon detection of intermediate or high-risk lo-                     men could die from causes other than prostate cancer
calized prostate cancer, patients experienced watchful                      by applying the general population’s all-cause mortality
waiting, active treatment, metastasis, or death; low-                       rates for resident males [33].
risk localized prostate cancer patients including true
low-risk or misclassified intermediate-risk experienced                     Model validation
watchful waiting, active treatment, active surveillance,                    To ensure face validity, inputs from surveyed clinician
metastasis, or death. Patients on active surveillance                       experts provided insights to diagnostic and management
remained on the same management strategy unless                             pathways for prostate cancer, model inputs and assump-
prompted by disease progression to undergo active                           tions used in the model. For external validity, 15-year
treatment, or transition to watchful waiting from age                       overall survival rates from the PREDICT Prostate multi-
of 75 years, whichever earlier [16] .                                       variate model were compared with the current model’s
   Undiagnosed patients and patients on active surveil-                     predicted overall survival output (see Additional file 4
lance were assumed to follow progression rates associ-                      for more details on this comparison) [34].
ated with watchful waiting [30]. Patients with true
intermediate-risk cancer but misclassified as low-risk                      Diagnostic performance and uptake
cancer received treatments for low-risk localized pros-                     Table 2 shows the diagnostic performance of various
tate cancer but followed progression rates for                              tests and the estimated biopsy uptake rates in local clin-
intermediate-risk localized prostate cancer. Only patients                  ical practice. Diagnostic performance of the various tests
with misclassified low-risk prostate cancer on active sur-                  varied in initial and repeat biopsy settings due to differ-
veillance were likely to experience metastasis before they                  ing prostate cancer risks [23, 35]. Patients with positive
switched to active treatment. In line with clinician ex-                    biopsy findings had their disease staged and received ap-
perts’ inputs, an estimated 50% of patients with misclas-                   propriate management. The model assumed that only
sified low-risk prostate cancer in the active surveillance                  patients who were truly intermediate-risk could be sus-
cohort switched to active treatment every year. Patients                    ceptible to be misclassified and managed as low-risk. In
receiving radical prostatectomy and radiotherapy experi-                    negative biopsies, all false negative cases were assumed
enced the same progression risk [16]. Patients whose                        to have persistently elevated PSA level, while an esti-
cancer diagnoses were missed by biopsy remained under                       mated 75% of those with true negative results remained
observation or watchful waiting at age of 75 years and                      clinically suspicious for prostate cancer. These were in-
did not receive any active treatment until onset of meta-                   dications for a subsequent biopsy a year later. The distri-
static disease.                                                             bution of patients with localized prostate cancer of
   A proportion of patients receiving active treatment                      varying risk was 31% low risk, 44% intermediate risk,
could experience biochemical recurrence to trigger fur-                     and 25% high risk (see Additional file 5 for more details
ther treatments such as salvage treatment [32]. When                        on this distribution).
symptomatic metastases developed, they either received
active or palliative care. Some patients with metastatic                    Health utilities
disease may further progress to castration-resistant pros-                  A QALY is an outcome measure derived by adjusting
tate cancer (CRPC) despite hormonal therapy with or                         the length of time by quality of life measured in health
without the early use of docetaxel or novel oral hormo-                     utilities on a scale of 0 (death) to 1 (perfect health) [36].
nal agents in the castrate-sensitive state, necessitating                   Table 3 shows health utilities inputs in the model. Util-
the use of other CRPC therapies such as abiraterone,                        ities for men with the modelled starting age of 65 years
enzalutamide, radium-223, docetaxel and cabazitaxel                         with no diagnosed cancer was taken from a multi-
(see Additional file 2 for distribution of treatments for                   country population norms study using the EQ-5D-3L
metastatic cancer and castration-resistant prostate can-                    [37]. The model considered utility decrements associated
cer and Additional file 3 for percentage of treatment-                      with age [38], utilities associated with localized prostate
related complications).                                                     cancer of various risk levels and metastases [39], and
Cheng et al. BMC Health Services Research            (2021) 21:909                                                                                     Page 6 of 16

Table 2 Diagnostic performance of diagnostic tests and uptake of subsequent biopsy
Diagnostic test                                                         Uptake True localized           Diagnostic test findings                Sources
                                                                               cancer status
mpMRI                                                                   100%       No cancer            • No suspicion of cancer or             NICE, 2019; Brown
                                                                                                          suspicion of low-risk cancer:         et al., 2018
                                                                                                          50%
                                                                                                        • Suspicion of low-risk cancer:
                                                                                                          17%
                                                                                                        • Suspicion of intermediate or
                                                                                                          high-risk cancer: 50%
                                                                                   Low-risk cancer      • No suspicion of cancer or
                                                                                                          suspicion of low-risk cancer:
                                                                                                          44%
                                                                                                        • Suspicion of low-risk cancer:
                                                                                                          16%
                                                                                                        • Suspicion of intermediate or
                                                                                                          high-risk cancer: 56%
                                                                                   Intermediate or      • No suspicion of cancer or
                                                                                   high-risk cancer       suspicion of low-risk cancer:
                                                                                                          13%
                                                                                                        • Suspicion of low-risk cancer: 5%
                                                                                                        • Suspicion of intermediate or
                                                                                                          high-risk cancer: 87%
First biopsy: systematic biopsy without prior mpMRI                     100%       Low-risk cancer      • P (Low|Low): 35%                      Brown et al., 2018;
                                                                                                                                                Drost et al., 2019
                                                                                   Intermediate         • P (Low|Intermediate): 17%
                                                                                   cancer               • P (Intermediate|Intermediate):
                                                                                                          59%
                                                                                   High-risk cancer     • P (High|High): 100%
First biopsy: MRI targeted biopsy after a suspicious mpMRI              100%       Low-risk cancer      • P (Low|Low): 35%
result
                                                                                   Intermediate         • P (Low|Intermediate): 8%
                                                                                   cancer               • P (Intermediate|Intermediate):
                                                                                                          79%
                                                                                   High-risk cancer     • P (High|High): 100%
Second biopsy: systematic biopsy following a negative                   71%        Low-risk cancer      • P (Low|Low): 45%
systematic biopsy
                                                                                   Intermediate         • P (Low|Intermediate): 10%
                                                                                   cancer               • P (Intermediate|Intermediate):
                                                                                                          35%
                                                                                   High-risk cancer     • P (High|High): -
Second biopsy MRI targeted biopsy following a suspicious                71%        Low-risk cancer      • P (Low|Low): 45%
mpMRI result and no cancer on prior systematic biopsy
                                                                                   Intermediate         • P (Low|Intermediate): 6%
                                                                                   cancer               • P (Intermediate|Intermediate):
                                                                                                          88%
                                                                                   High-risk cancer     • P (High|High): -
Third biopsy: saturation biopsy                                         71%        Low-risk cancer      • Sensitivity: 95%                      Expert opinion
                                                                                                        • Specificity: 100%
                                                                                   Intermediate         • Sensitivity: 95%
                                                                                   cancer               • Specificity: 100%
                                                                                   High-risk cancer     • Sensitivity: 95%
                                                                                                        • Specificity: 100%
Abbreviation: mpMRI multi-parametric magnetic resonance imaging
Notes
1. MRI targeted biopsy refers to the administration of MRI targeted biopsy combined with systematic biopsy following a positive mpMRI.
2. P (Low|Low): probability of detecting low-risk cancer given that low-risk cancer exists; P (Low|Intermediate): probability of detecting low-risk cancer given that
intermediate-risk cancer exists; P (Intermediate|Intermediate): probability of detecting intermediate-risk cancer given that intermediate-risk cancer exists;
P(High|High): probability of detecting high-risk cancer given that high-risk cancer exists.
3. Estimated uptake rates were from surveyed clinician experts from public healthcare institutions.
4. From the surveyed clinician experts, based on the number of patients suspected of prostate cancer referred to public healthcare institutions for the first biopsy
in the past five years, the estimated prevalence of prostate cancer in men referred for the first biopsy was 37.7%.
5. The uncertainty of model inputs was explored by simultaneously and randomly sampling the parameters from assigned distributions – beta distribution for
health utilities values and multivariate normal distributions using Cholesky decomposition matrix for parameters characterizing disease progression.
Cheng et al. BMC Health Services Research (2021) 21:909 Page 7 of 16
Table 3 Health utilities weights and decrements in the model
Parameter Value (range) Source Other remarks
Cancer health state
No cancer 0.85 (0.83 to 0.86) Clemens –
et al. 2014
Low-risk localized 0.84 (0.836 to 0.844) Stewart At baseline, the utility value for patients at the metastasis state is 0.67. The utility is
prostate cancer et al. 2005 reduced to 0.4 when they progress to castration-resistant prostate cancer. In the
last two months before death, metastatic patients’ utility was assumed to increase
Intermediate-risk 0.81 (0.803 to 0.817)
to 0.67 as they would receive palliative care to maintain quality of life.
localized prostate cancer
High-risk localized 0.71 (0.701 to 0.719)
prostate cancer
Metastasis 0.67 (0.660 to 0.680)
Utility benefit of active 0.01 Korfage Utility benefit was derived from the difference before and after the active
treatment et al. 2005 treatment in Korfage et al. (2005). Utility values at the active treatment health state:
0.85 for low-risk prostate cancer; 0.82 for intermediate-risk; 0.72 for high-risk.
Castration-resistant 0.40 (0.3 to 0.5) Bayoumi –
prostate cancer et al. 2000
Utilities decrement
Age 0.0002587 + 0.0000332* Ara and –
(age^2-(age-1)^2) Brazier
2010
Biopsy complication – 0.00677 (0.00577 to Brown Utility change post-saturation biopsy of −0.176 (−0.15 to −0.2) was obtained from
saturation biopsy 0.00769) et al. 2018 PROMIS individual patient data: 0.176*2/52 = 0.00677; Utility change post-systematic
biopsy: 0.101*2/52 = 0.00388.
Biopsy complication – 0.00388 (0.00349 to NICE (2019)
systematic biopsy 0.00427)
Treatment complication 0.1 Krahn et al. Erectile dysfunction and urinary urgency are lifelong complications.
– erectile dysfunction 2003
Treatment complication 0.06
– urinary urgency
Treatment complication 0.11
– bowel problem
Recurrence 0.0206 (0 to 0.08893) Ramsay Utility value for chemical recurrence reported in Ramsay et al. (2012) is 0.73 for
et al. 2012 patients with high-risk prostate cancer, based on a baseline utility for men without
cancer of 0.95, which was higher than that used in our model (0.85). Utility decre-
ment associated with chemical recurrence applied in the model was therefore cal-
culated by deducting the baseline utility of high-risk prostate cancer by the
adjusted value for chemical recurrence: 0.71–0.73*(0.85/0.9) = 0.0206.
Notes
1. The uncertainty of model inputs was explored by simultaneously and randomly sampling the parameters from assigned distributions – beta distribution for
health utilities values and multivariate normal distributions using Cholesky decomposition matrix for parameters characterizing disease progression.
impact of biopsies on utilities [31, 35]. Varying compli- biochemical recurrence were associated with utility dec-
cation rates arising from saturation or systematic biop- rements [41, 42].
sies led to different utility decrements [31, 35]. Patients
with undetected cancer or on active surveillance were Costs
assumed to have the same utilities as patients on watch- In line with a healthcare system perspective, only direct
ful waiting. Utilities of patients with CRPC were lower medical resources were considered. Table 4 shows that
than those without CRPC assuming no substantial de- cost inputs included charges associated with the diag-
cline in utilities until CRPC developed [40]. Metastatic nostic strategies, management and treatment of prostate
patients receiving palliative care were assumed to have cancer, and management of complications.
the same utilities as those not receiving CRPC care.
Health utility benefits associated with active treatment Sensitivity analyses
was assumed to be equal for low, intermediate, and One-way sensitivity analyses were conducted over the
high-risk localized cancers, and remained constant until range of predefined values for specific model parameters
metastasis occurred. Treatment complications and using the reported 95% confidence intervals fromCheng et al. BMC Health Services Research (2021) 21:909 Page 8 of 16
Table 4 Cost inputs (in USD) in the model
Item Mean Unit Source Other remarks
value
Cost inputs for diagnosis
Urology visit 82 Per visit Public healthcare –
institutions
PSA test 41 Per test Public healthcare –
institutions
Systematic biopsy 1108 Per MOH Casemix and –
session Subvention System
(2017)
Saturation biopsy 1563 Per MOH Casemix and –
session Subvention System
(2017)
mpMRI 827 Per Public healthcare –
session institutions
MRI targeted biopsy (inclusive of mpMRI, 2223 Per Public healthcare –
MRI-US fusion targeted biopsy and sys- session institutions
tematic biopsy)
Cost inputs for management and treatment strategy for localized prostate cancer
Observation 122 Per year Public healthcare 1 visit to the urologist and PSA testing per year
institutions
Watchful waiting 163 Per year Public healthcare 1.5 visits to the urologist and PSA testing per year
institutions
Radical prostatectomy 17,023 Per MOH Casemix and Laparoscopic surgery
episode Subvention System
(2017)
Radiotherapy (curative) 18,382 40 Public healthcare External beam only, with image-guided radiotherapy
treatment institutions
sessions
Androgen deprivation therapy 439 3-monthly Drug Utilisation In curative treatment, androgen deprivation therapy included
Data (2017) only Luteinizing hormone-releasing hormone (LHRH) agonist.
The 3-monthly cost of LHRHa was the weighted mean selling
price calculated based on all LHRHa (leuprorelin acetate, goser-
elin, leuprorelin and triptorelin) in Drug Utilization Data (2017).
Cost inputs for management and treatment strategy for metastasis and castration-resistant prostate cancer
Metastatic care - first line therapy 2194 Per year • Survey of local –
experts
Metastatic care – second line therapy 18,349 Per year
• Drug Utilization
Treatment for castration-resistant pros- 26,458 Per year Data (2017)
tate cancer • MOH Casemix and
Subvention
System (2017)
Hospice care 202 Per day Assisi Hospice –
Abbreviations: MRI magnetic resonance imaging, PSA prostate-specific antigen, US ultrasound, USD US dollar
Note:
1. After positive mpMRI, MRI targeted biopsy (using MRI-US fusion targeted biopsy) is administered with systematic biopsy. The total cost of MRI targeted biopsy
when administered with systematic biopsy (inclusive of mpMRI) is $2223 per session.
2. The uncertainty of model inputs was explored by simultaneously and randomly sampling the parameters from assigned distributions – beta distribution for
health utilities values and multivariate normal distributions using Cholesky decomposition matrix for parameters characterizing disease progression.
published literature or ± 10% of point estimate. Except performed for the pair of strategies with the highest
for costs of mpMRI and biopsies in the evaluated diag- ICER in the deterministic base case analyses. The
nostic strategies, costs were considered known parame- least costly strategy was used as the reference strategy
ters and were not evaluated in the one-way sensitivity for the pairwise comparison.
analyses. If more than two strategies were considered Multivariate probabilistic sensitivity analyses with
cost-effective, one-way sensitivity analyses were 1000 second-order Monte Carlo simulations (50,000Cheng et al. BMC Health Services Research (2021) 21:909 Page 9 of 16
Fig. 2 Cost-effectiveness plane of base case analyses. Abbreviations: mpMRI, multiparametric magnetic resonance imaging; MRI, magnetic
resonance imaging; QALY, quality-adjusted life years; USD, US dollars. Notes. 1. Strategy 1: MRI targeted biopsy. Strategy 2: MRI targeted biopsy ➔
Systematic biopsy. Strategy 3: MRI targeted biopsy ➔ Saturation biopsy. Strategy 4: MRI targeted biopsy ➔ Systematic biopsy ➔ Saturation
biopsy. Strategy 5: Systematic biopsy ➔ MRI targeted biopsy. Strategy 6: Systematic biopsy ➔ MRI targeted biopsy ➔ Saturation biopsy. 2. MRI
targeted biopsy refers to the administration of MRI targeted biopsy combined with systematic biopsy following a positive mpMRI. 3. Strategies 1,
2, 4 are on the cost-effectiveness frontier, indicating that they achieve the most QALY per USD spent; Strategies 3, 5, 6 are dominated as they are
more costly and gave fewer QALYs.
first-order simulation trials) were performed. The uncer- repeat biopsy setting (Strategies 5 and 6) were domi-
tainty of model inputs was explored by simultaneously nated, incurring more costs with less QALY gain. Simi-
and randomly sampling the parameters from assigned larly, Strategy 3 was dominated, suggesting saturation
distributions. Cost-effectiveness acceptability curves pre- biopsy, when used, should be reserved as the last option
sented the cost-effectiveness probability of each diagnos- within a testing sequence.
tic strategy over a range of willingness-to-pay (WTP)
thresholds. Sensitivity analyses
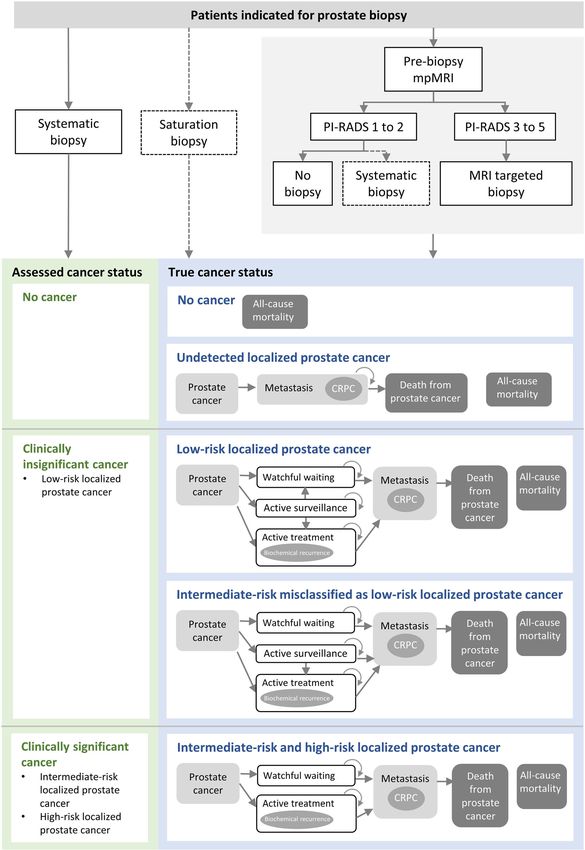
One-way sensitivity analyses were performed for Strategy
Results 4 compared with Strategy 1 as the reference strategy as
Base case analyses Strategy 1 had the lowest cost. Figure 3 showed that
Figure 2 showed strategies 1, 2 and 4 on the cost- ICER was most sensitive to annual discounting rate,
effectiveness plane, indicating that these strategies prevalence of prostate cancer in men referred for first bi-
achieved the most QALYs per USD spent. Strategy 1 opsy, probability of detecting low-risk cancer given true
had the lowest cost, while Strategies 2 and 4 gave ICERs low-risk cancer using systematic biopsy as first biopsy,
ranging from US$18,975 to US$19,458 when compared and the probability of low-risk cancer classified as suspi-
to Strategies 1 and 2 respectively (see Table 5). When cious clinically significant cancer by mpMRI (see Add-
Strategy 4 was compared to Strategy 1, the ICER was itional file 6 for summary of one-way sensitivity analyses
US$19,175. Strategies 1, 2, 4 involved MRI targeted bi- parameters and results of Strategy 4 vs Strategy 1). All
opsy used in the biopsy-naïve patients in the initial bi- ICERs remained between US$15,755 to US$23,022 per
opsy setting and were considered cost-effective, QALY gained when model parameters were varied (see
assuming a WTP threshold of US$20,000. On the other Additional file 7 for full chart of ICER tornado diagram
hand, strategies that involved MRI targeted biopsy in the for Strategy 4 vs Strategy 1).Cheng et al. BMC Health Services Research (2021) 21:909 Page 10 of 16
Table 5 Base case analyses of diagnostic strategies
Diagnostic strategy Comparator 20 years horizon 25 35
years years
horizon horizon
Costs Incremental Effectiveness Incremental ICER (cost in USD ICER (cost in USD
(USD) costs (QALYs) effectiveness per QALY per QALY gained)
gained)
Strategy 1*: MRI targeted biopsy – 9655 – 10.2236 – – – –
Strategy 2*: MRI targeted biopsy ➔ Strategy 1 10,062 408 10.2451 0.0215 18,975 16,211 14,084
Systematic biopsy
Strategy 3: MRI targeted biopsy ➔ Strategy 2 10,333 271 10.2408 −0.0042 Dominated by Strategy 2
Saturation biopsy
Strategy 4*: MRI targeted biopsy ➔ Strategy 2 10,357 295 10.2602 0.0152 19,458 15,915 14,106
Systematic biopsy ➔ Saturation
biopsy
Strategy 5: Systematic biopsy ➔ MRI Strategy 4 10,855 498 10.2358 −0.0245 Dominated by Strategy 4
targeted biopsy
Strategy 6: Systematic biopsy ➔ MRI Strategy 4 11,086 729 10.2516 −0.0086 Dominated by Strategy 4
targeted biopsy ➔ Saturation biopsy
Abbreviations: ICER incremental cost-effectiveness ratio, mpMRI multi-parametric magnetic resonance imaging, QALY quality-adjusted life year; USD, US dollar
Note:
1. MRI targeted biopsy refers to the administration of MRI targeted biopsy combined with systematic biopsy following a positive mpMRI.
2. Arrow (➔) refers to next sequence of diagnostic test following a negative biopsy result
3. The diagnostic strategies are organized from the least costly to most mostly strategy based on the analyses for 20-year time horizon. The incremental cost and
effectiveness of each strategy is calculated by comparing against the preceding strategy that is not dominated. A dominated strategy is more costly and less
effective than the strategy in the immediately preceding row. The strategies with asterisk (*) are not dominated; those without asterisk are dominated.
4. When Strategy 4 was compared against Strategy 1, the ICER was US$19175.
Fig. 3 ICER tornado diagram for Strategy 4 vs Strategy 1 (top 10 drivers). Abbreviations: ICER, incremental cost-effectiveness ratio; MRI, magnetic
resonance imaging; mpMRI, multi-parametric magnetic resonance imaging; PSA, prostate-specific antigen. Notes. 1. Strategy 1: MRI targeted
biopsy. Strategy 4: MRI targeted biopsy ➔ Systematic biopsy ➔ Saturation biopsy. 2. MRI targeted biopsy refers to the administration of MRI
targeted biopsy combined with systematic biopsy following a positive mpMRI. 3. Blue bars denote the ICERs when the parameter’s lower bound
limit is tested; red bars denote the ICERs when the parameter’s upper bound limit is tested.Cheng et al. BMC Health Services Research (2021) 21:909 Page 11 of 16
Fig. 4 Cost-effectiveness plane of probabilistic sensitivity analyses. Abbreviations: mpMRI, multiparametric magnetic resonance imaging; MRI,
magnetic resonance imaging; QALY, quality-adjusted life years; USD, US dollars. Notes. 1. Strategy 1: MRI targeted biopsy. Strategy 2: MRI targeted
biopsy ➔ Systematic biopsy. Strategy 3: MRI targeted biopsy ➔ Saturation biopsy. Strategy 4: MRI targeted biopsy ➔ Systematic biopsy ➔
Saturation biopsy. Strategy 5: Systematic biopsy ➔ MRI targeted biopsy. Strategy 6: Systematic biopsy ➔ MRI targeted biopsy ➔ Saturation
biopsy. 2. MRI targeted biopsy refers to the administration of MRI targeted biopsy combined with systematic biopsy following a positive mpMRI.
3. Strategies 1, 2, 4, 6 are on the cost-effectiveness frontier, indicating that they achieve the most QALY per USD spent; Strategies 3, 5 are
dominated as they are more costly and gave fewer QALYs.
Probabilistic sensitivity analyses in Fig. 4 found that becoming more commonly used [16, 17], a more pertin-
Strategies 1, 2, 4, and 6 were on the cost-effectiveness ent resource allocation question should be – what are
frontier, while Strategies 3 and 5 remained dominated. the cost-effective ways to deploy MRI targeted biopsy,
The ICERs for Strategies 1, 2, 4, and 6 ranged from given the many possible diagnostic sequences within a
US$15,990 to US$58,097 (see Additional file 8 for prob- clinical care pathway. By varying the position of MRI
abilistic sensitivity analyses of all strategies for base targeted biopsy in six diagnostic strategies, single and
case). The cost-effectiveness acceptability curves in Fig. 5 multiple biopsy strategies containing MRI targeted bi-
confirmed that Strategy 1 was the least costly, and Strat- opsy could address how its introduction in a testing
egy 2 was potentially cost-effective at WTP of strategy could impact its cost-effectiveness. To the best
US$20,000 and Strategy 4 at WTP of US$30,000. How- of our knowledge, no other study has evaluated the cost-
ever, the probability of Strategy 2 being cost-effective effectiveness of MRI targeted biopsy within a testing
was less than 50%. Strategy 6 could only be considered sequence.
cost-effective when WTP increased to US$60,000. This study also incorporated relevant clinical consider-
ations to estimate long-term costs and effectiveness of
Discussion various diagnostic strategies in single and multiple bi-
This study found that all strategies including MRI tar- opsy settings. Diagnostic accuracy inputs on MRI tar-
geted biopsy in the initial biopsy setting were cost- geted biopsy for different risk groups were drawn mainly
effective except when saturation biopsy was used imme- from a recent Cochrane review which comprehensively
diately as a second biopsy. Many published cost- reviewed the evidence on MRI targeted biopsies based
effectiveness analyses only evaluated MRI targeted bi- on 17 studies in initial biopsy setting and 8 studies in
opsy as a first biopsy compared with systematic transrec- the repeat biopsy setting [23]. This avoids mixing cost
tal ultrasound-guided (TRUS) biopsy based on a single and health impact of detecting clinically significant and
biopsy protocol [43–46]. With MRI targeted biopsy clinically insignificant prostate cancer [45, 47].Cheng et al. BMC Health Services Research (2021) 21:909 Page 12 of 16 Fig. 5 Cost-effectiveness acceptability curves. Abbreviations: mpMRI, multiparametric magnetic resonance imaging; MRI, magnetic resonance imaging; QALY, quality-adjusted life years; USD, US dollars. Notes. 1. Strategy 1 (shown in blue squares): MRI targeted biopsy. Strategy 2 (shown in red triangles): MRI targeted biopsy ➔ Systematic biopsy. Strategy 3 (shown in yellow circles): MRI targeted biopsy ➔ Saturation biopsy. Strategy 4 (shown in green triangles): MRI targeted biopsy ➔ Systematic biopsy ➔ Saturation biopsy. Strategy 5 (shown in blue diamonds): Systematic biopsy ➔ MRI targeted biopsy. Strategy 6 (shown in purple ovals): Systematic biopsy ➔ MRI targeted biopsy ➔ Saturation biopsy. 2. MRI targeted biopsy refers to the administration of MRI targeted biopsy combined with systematic biopsy following a positive mpMRI Downstream management strategies were comprehen- biopsy gave greater utility decrements and costs arising sively modelled to ensure that diagnostic outcomes and from higher complication rates than systematic biopsy. follow-up care included expensive CRPC drug therapies The discordant results for Strategy 6 in the determin- such as abiraterone, enzalutamide, and cabazitaxel. istic base case analyses and probabilistic sensitivity ana- While early detection of treatable clinically significant lyses could be explained by the modest difference in the cancer is the aim of any prostate biopsy, new develop- incremental effectiveness between Strategy 4 and Strat- ments in downstream management of patients with de- egy 6, and the multiplicative effect of input parameters tected cancer or those with persistent clinical suspicion in a nonlinear model. In both initial and repeat biopsies, of prostate cancer despite previous negative biopsies can MRI targeted biopsy improved detection of clinically sig- potentially create an undesirable situation where their nificant cancer and clinically insignificant cancer [23]. consequent management accrue higher costs and lower Compared to Strategy 4, Strategy 6 had marginally utilities. higher detection rate of clinically significant cancer by The consistently favorable results of Strategies 1, 2 0.02%, and clinically insignificant cancer by 0.2% [23]. and 4 showed that early use of MRI targeted biopsy as a For strategies with similar diagnostic performance like first biopsy was potentially cost-effective but could be in- Strategies 4 and 6, any change in costs and QALYs fluenced by when saturation biopsy was used. Strategy 3 resulting from a complex nonlinear model with multi- where saturation biopsy was the second biopsy was plicative effects of input parameters can introduce fur- shown to be dominated, whereas Strategy 4 had an ICER ther uncertainty in the cost-effectiveness result. As of US$19,458 when saturation biopsy was used as the probabilistic sensitivity analyses are preferred for esti- third biopsy, implying later use of saturation biopsy mating mean costs and outcomes in nonlinear models could improve the cost-effectiveness of MRI targeted bi- [48, 49], the results lend support for using MRI targeted opsy in the initial biopsy setting. Despite high sensitivity biopsy in the initial and repeat biopsy settings. Although of 95% in detecting localized prostate cancer, saturation Strategy 1, a single biopsy protocol, is least costly, it has
Cheng et al. BMC Health Services Research   (2021) 21:909                                                      Page 13 of 16

limited applicability in cases with persistently high clin-    PSA testing was not yet widely adopted. Recent im-
ical suspicion.                                                provements in contemporary treatment modalities such
   Despite a lack of published literature comparing diag-      as robotic surgery and more precise radiotherapy are ex-
nostic strategies that varied position of the MRI targeted     pected to give better QALY benefits. The more recent
biopsy, published literature found greater inconsistency       PIVOT trial enrolled men from 1994 to 2002 during the
in the cost-effectiveness of MRI targeted biopsy in the        early era of PSA testing but did not report time to pro-
repeat biopsy setting. MRI targeted biopsy compared            gression for each risk group as required by this model
with TRUS systematic biopsy in the initial biopsy setting      [54, 55]. As such, the progression rates of patients re-
were consistently cost-effective [43–47, 50]; published        ceiving radical prostatectomy in the SPCG-4 trial repre-
literature on MRI targeted biopsy as a second biopsy re-       sented a conservative estimate of the treatment
ported wide ranging results from £5778 per QALY to             modality, while those receiving watchful waiting best ap-
being dominated when compared with TRUS systematic             proximated the natural history of prostate cancer with-
biopsy [31, 35, 50], indicating less consistent findings in    out treatment [31].
this setting. This could be due to the mounting diagnos-         Third, this study did not include a potential diag-
tic challenge as the yield of clinically significant cancer    nostic strategy with two consecutive MRI targeted bi-
progressively declines with each subsequent biopsy [51]        opsies due to its low frequency of use in local clinical
and the variable downstream care strategies in different       practice and lack of clarity in the guidelines. This
practice settings. Recent guidelines also indicated varied     diagnostic strategy could take place if there were con-
strength when recommending MRI targeted biopsy use             cerns that the first MRI targeted biopsy was not opti-
in repeat biopsy settings [16, 17].                            mal due to technical reasons or if the second mpMRI
   Successful implementation of any diagnostic strategies      showed changes in the lesion(s) after a negative initial
in a practice setting requires several considerations. The     biopsy. Future studies could consider including this
effectiveness of MRI targeted biopsy depends on the            strategy when there is more published data or greater
quality assurance of mpMRI. Although PI-RADS scores            clarity in guidelines.
help standardize the acquisition, interpretation and             Fourth, model inputs such as the prevalence of pros-
reporting of prostate mpMRI, the learning curve of             tate cancer in men referred for biopsy, the distribution
interpreting mpMRI remains steep and inter-observer            of localized prostate cancer risks, and allocation of care
differences persist. Radiology practices performing pros-      and treatment strategies were informed through surveys
tate mpMRI should engage in in-house training and              of clinician experts working in the local public health-
continual quality improvement programs to ensure a             care institutions. This was due to a lack of published
minimum competency standard is maintained [46, 52].            real-world local data. To ensure representativeness of
With evidence supporting prostate mpMRI as a triage in         the findings, each public healthcare institution offering
the initial biopsy setting [35], the utilization of mpMRI      prostate biopsy had at least one urologist providing in-
and its corresponding waiting time are likely to increase      put. Additional inputs from radiologists were also
but potentially with corresponding reduction in un-            sought. As model inputs and assumptions were devel-
necessary biopsies.                                            oped for a starting age of 65 years, its findings cannot
   This study has several limitations. First, the diagnostic   readily apply to other starting ages without a separate
input of MRI targeted biopsy was based upon a review           undertaking to ensure rigor and relevance of model in-
that included all MRI targeted biopsy techniques includ-       put and assumptions.
ing cognitive MRI targeted biopsy and in-bore MRI tar-           Fifth, health utility scores were from published litera-
geting [23]. Variations in these targeted techniques,          ture derived from Australia, Canada, Netherlands,
scanning protocols, varying thresholds for mpMRI posi-         United Kingdom, and USA due to a lack of published
tivity to trigger biopsy could contribute to heterogeneity.    local information [39–41, 56, 57]. Given a lack of local
Despite these sources of heterogeneity, current evidence       published health utilities, these sources present the best
has not demonstrated clear superiority of one MRI-             available published evidence that met the data needs of
based biopsy technique over another [16]. Sensitivity          the model. While the emotional toll of a cancer diagno-
analyses performed in this study using published 95%           sis could adversely impact quality of life, similar utilities
confidence intervals also helped ensure the robustness of      between no cancer and localized low-risk prostate can-
the results.                                                   cer were applied based on available published utilities.
   Second, probabilities of metastatic progression and         The small difference is expected given the typically slow-
treatment effects were sourced from the SPCG-4 trial           progressing nature of prostate cancer. When varied in
which provided up to 18 years’ follow-up data [30, 53].        one-way sensitivity analyses, they did not materially im-
Although the trial provided good long-term follow-up           pact the ICERs (see Additional file 8 for probabilistic
data, it recruited patients between 1989 and 1999 when         sensitivity analyses of all strategies for base case).
Cheng et al. BMC Health Services Research                   (2021) 21:909                                                                                      Page 14 of 16

Conclusions                                                                                  Declarations
To conclude, this study found Strategy 1, Strategy 2, and
                                                                                             Ethics approval and consent to participate
Strategy 4 – where MRI targeted biopsy was used in                                           No permission was required to access aggregated cost and utilisation data
biopsy-naïve patients in the initial biopsy setting – to be                                  for MOH, and published literature.
cost-effective diagnostic options for prostate cancer. The
                                                                                             Consent for publication
findings are useful to inform decision making in funding
                                                                                             Not applicable.
different diagnostic options within the Singapore public
healthcare system.                                                                           Competing interests
                                                                                             E.C. received speaker honorarium from Athena medical company.
Abbreviations
                                                                                             Author details
CRPC: Castration-resistant prostate cancer; DRE: Digital rectal examination;                 1
                                                                                              Agency for Care Effectiveness, Ministry of Health, Singapore, 16 College
EAU: European Association of Urology; ICER: Incremental cost-effectiveness
                                                                                             Road, Singapore 169854, Singapore. 2Department of Urology, Tan Tock Seng
ratio; ISUP: International Society of Urology Pathology;
                                                                                             Hospital, Singapore, Singapore. 3Department of Diagnostic Radiology, Tan
mpMRI: Multiparametric magnetic resonance imaging; MRI: Magnetic
                                                                                             Tock Seng Hospital, Singapore, Singapore. 4Lee Kong Chian School of
resonance imaging; MRI-US: Magnetic resonance imaging - ultrasound; PI-
                                                                                             Medicine, Nanyang Technological University, Singapore, Singapore.
RADS: Prostate Imaging – Reporting and Data System; PSA: Prostate-specific                   5
                                                                                              Department of Urology, Changi General Hospital, Singapore, Singapore.
antigen; QALY: Quality-adjusted life year; TRUS: Transrectal ultrasound-                     6
                                                                                              Department of Urology, Singapore General Hospital, Singapore, Singapore.
guided; US: United States; USD: United States dollar; WTP: Willingness-to-pay                7
                                                                                              Urology Service, Ng Teng Fong General Hospital, Singapore, Singapore.
                                                                                             8
                                                                                              Department of Diagnostic Imaging, National University Hospital, Singapore,
                                                                                             Singapore. 9Department of Urology, National University Hospital, Singapore,
Supplementary Information                                                                    Singapore. 10Department of Surgery, Yong Loo Lin School of Medicine,
The online version contains supplementary material available at https://doi.                 National University of Singapore, Singapore, Singapore.
org/10.1186/s12913-021-06916-0.
                                                                                             Received: 19 April 2021 Accepted: 18 August 2021
  Additional file 1: Table S1. Distribution of care strategies for localized
  prostate cancer of various risks.
  Additional file 2: Table S2. Distribution of treatments for metastatic                     References
  cancer and castration-resistant prostate cancer.                                           1. Cancer IAfRo. Global Cancer Registry (GLOBOCAN). Lyon: World Health
                                                                                                 Organization: International Agency for Research on Cancer; 2018.
  Additional file 3: Table S3. Percentage of the treatment-related
                                                                                             2. Registry; SC. 50 years of cancer registration - Singapore Cancer Registry:
  complications.
                                                                                                 Singapore; 2019.
  Additional file 4: Table S4. Comparison of overall survival of men from                    3. Rawla P. Epidemiology of prostate Cancer. World J Oncol. 2019;10(2):63–89.
  published prostate cancer data and current study’s modelled population.                        https://doi.org/10.14740/wjon1191.
  Additional file 5: Table S5. Distribution of patients with localised                       4. American Cancer Society. Cancer Facts & Figures 2020. Atlanta: American
  prostate cancer across risk status.                                                            Cancer Society; 2020.
                                                                                             5. Draisma G, Etzioni R, Tsodikov A, Mariotto A, Wever E, Gulati R, et al. Lead
  Additional file 6: Table S6. Summary of one-way sensitivity analyses
                                                                                                 time and overdiagnosis in prostate-specific antigen screening: importance
  parameters and results - Strategy 4 vs Strategy 1.
                                                                                                 of methods and context. J Natl Cancer Inst. 2009;101(6):374–83. https://doi.
  Additional file 7: Fig. S1. ICER tornado diagram for Strategy 4 vs                             org/10.1093/jnci/djp001.
  Strategy 1 (full chart).                                                                   6. Etzioni R, Penson DF, Legler JM, di Tommaso D, Boer R, Gann PH, et al.
  Additional file 8: Table S7. Probabilistic sensitivity analyses of all                         Overdiagnosis due to prostate-specific antigen screening: lessons from U.S.
  strategies for base case.                                                                      prostate Cancer incidence trends. J Natl Cancer Inst. 2002;94(13):981–90.
                                                                                                 https://doi.org/10.1093/jnci/94.13.981.
                                                                                             7. Singapore; AoM. Report of the Screening Test Review Committee.
Acknowledgements                                                                                 Singapore: Academy of Medicine, Singapore; 2019.
This study was part of a health technology assessment (HTA) evaluation on                    8. Matoso A, Epstein JI. Defining clinically significant prostate cancer on the
MRI-US fusion targeted biopsy conducted by the Agency for Care Effective-                        basis of pathological findings. Histopathology. 2019;74(1):135–45. https://doi.
ness (ACE), Ministry of Health, Singapore in 2019. The authors would like to                     org/10.1111/his.13712.
thank Mr. Chris Foteff for his inputs to the initial draft of this manuscript, and           9. National Comprehensive Cancer Network. NCCN clinical practice guidelines
Mr. Mohamed Ismail Abdul Aziz and Ms. Cher Boon Piang for their inputs to                        in oncology (NCCN guidelines) - prostate Cancer (version 2.2020): National
the revision of this manuscript.                                                                 Comprehensive Cancer Network; 2002.
                                                                                             10. Hegde JV, Mulkern RV, Panych LP, Fennessy FM, Fedorov A, Maier SE, et al.
                                                                                                 Multiparametric MRI of prostate cancer: an update on state-of-the-art
Authors’ contributions                                                                           techniques and their performance in detecting and localizing prostate
Conception and design: L.C., S.S., C.T., K.N. Analysis and interpretation of the                 cancer. J Magn Reson Imaging. 2013;37(5):1035–54. https://doi.org/10.1002/
data: L.C., S.S., T.T., C.T., T.L., K.T., W.L., B.A., E.C., K.N. Drafting of the paper or        jmri.23860.
revising it critically for intellectual content: L.C., S.S., T.T., C.T., T.L., K.T., W.L.,   11. Panebianco V, Barchetti F, Sciarra A, Ciardi A, Indino EL, Papalia R, et al.
B.A., E.C., K.N. Final approval of the version to be published: L.C., S.S., T.T., C.T.,          Multiparametric magnetic resonance imaging vs. standard care in men
T.L., K.T., W.L., B.A., E.C., K.N. All authors agree to be accountable for all                   being evaluated for prostate cancer: a randomized study. Urol Oncol. 2015;
aspects of the work.                                                                             33(1):17 e1–7.
                                                                                             12. Turkbey B, Mani H, Shah V, Rastinehad AR, Bernardo M, Pohida T, et al.
                                                                                                 Multiparametric 3T prostate magnetic resonance imaging to detect cancer:
Funding
                                                                                                 histopathological correlation using prostatectomy specimens processed in
This study did not receive any sponsorship or funding.
                                                                                                 customized magnetic resonance imaging based molds. J Urol. 2011;186(5):
                                                                                                 1818–24. https://doi.org/10.1016/j.juro.2011.07.013.
Availability of data and materials                                                           13. Siddiqui MM, Rais-Bahrami S, Truong H, Stamatakis L, Vourganti S, Nix J,
The dataset(s) supporting the conclusions of this article are included within                    et al. Magnetic resonance imaging/ultrasound-fusion biopsy significantly
the article and (and its additional file(s)).                                                    upgrades prostate cancer versus systematic 12-core transrectal ultrasound
Cheng et al. BMC Health Services Research (2021) 21:909 Page 15 of 16
biopsy. Eur Urol. 2013;64(5):713–9. https://doi.org/10.1016/j.eururo.2013.05. singstat.gov.sg/publications/population/-/media/Files/publications/popula
059. tion/lifetable16-17. Accessed 30 Nov 2018.
14. Rastinehad AR, Turkbey B, Salami SS, Yaskiv O, George AK, Fakhoury M, et al. 34. Thurtle DR, Greenberg DC, Lee LS, Huang HH, Pharoah PD, Gnanapragasam
Improving detection of clinically significant prostate cancer: magnetic VJ. Individual prognosis at diagnosis in nonmetastatic prostate cancer:
resonance imaging/transrectal ultrasound fusion guided prostate biopsy. J Development and external validation of the PREDICT Prostate multivariable
Urol. 2014;191(6):1749–54. https://doi.org/10.1016/j.juro.2013.12.007. model. PLoS Med. 2019;16(3):e1002758. https://doi.org/10.1371/journal.
15. Wysock JS, Rosenkrantz AB, Huang WC, Stifelman MD, Lepor H, Deng FM, pmed.1002758.
et al. A prospective, blinded comparison of magnetic resonance (MR) 35. Brown LC, Ahmed HU, Faria R, Bosaily AE-S, Gabe R, Kaplan RS, et al.
imaging-ultrasound fusion and visual estimation in the performance of MR- Multiparametric MRI to improve detection of prostate cancer compared
targeted prostate biopsy: the PROFUS trial. Eur Urol. 2014;66(2):343–51. with transrectal ultrasound-guided prostate biopsy alone: the PROMIS study.
https://doi.org/10.1016/j.eururo.2013.10.048. Health Technol Assessment (Winchester, England). 2018;22(39):1.
16. Mottet N, van den Bergh RCN, Briers E, Cornford P, De Santis M, Fanti S, 36. Drummond MF, Sculpher MJ, Torrance GW, O'Brien BJ, Stoddart GL.
et al. EAU-EANM-ESUR-ESTRO-SIOG guidelines on prostate Cancer. Amhem: Methods for the economic evaluation of health care Programmes. 3rd ed.
EAU; 2019. New York: Oxford University Press; 2005.
17. NICE. NICE guideline on Prostate cancer: diagnosis and management: 37. Clemens S, Begum N, Harper C, Whitty JA, Scuffham PA. A comparison of
National Institute for Health and Care Excellence; 2019. EQ-5D-3L population norms in Queensland, Australia, estimated using utility
18. Singapore Cancer Registry. 50 years of cancer registry. Singapore: Health value sets from Australia, the UK and USA. Qual Life Res. 2014;23(8):2375–81.
Promotion Board; 2019. https://doi.org/10.1007/s11136-014-0676-x.
19. Elkhoury FF, Felker ER, Kwan L, Sisk AE, Delfin M, Natarajan S, et al. 38. Ara R, Brazier JE. Populating an economic model with health state utility
Comparison of targeted vs systematic prostate biopsy in men who are values: moving toward better practice. Value Health. 2010;13(5):509–18.
biopsy naive: the prospective assessment of image registration in the https://doi.org/10.1111/j.1524-4733.2010.00700.x.
diagnosis of prostate Cancer (PAIREDCAP) study. JAMA Surg. 2019;154(9): 39. Stewart ST, Lenert L, Bhatnagar V, Kaplan RM. Utilities for prostate cancer
811–8. https://doi.org/10.1001/jamasurg.2019.1734. health states in men aged 60 and older. Med Care. 2005;43(4):347–55.
20. Lee AY, Yang XY, Lee HJ, Law YM, Hong HH, Lau WK, et al. Multiparametric https://doi.org/10.1097/01.mlr.0000156862.33341.45.
MRI-Ultrasound Software Fusion Prostate Biopsy - Initial Results Using A 40. Bayoumi AM, Brown AD, Garber AM. Cost-effectiveness of androgen
Stereotactic Robotic Assisted Transperineal Prostate Biopsy Platform suppression therapies in advanced prostate cancer. J Natl Cancer Inst. 2000;
Comparing Systematic Versus Targeted Biopsy. BJU Int. 2020;126(5):568–76. 92(21):1731–9. https://doi.org/10.1093/jnci/92.21.1731.
https://doi.org/10.1111/bju.15118. 41. Krahn M, Ritvo P, Irvine J, Tomlinson G, Bremner KE, Bezjak A, et al. Patient
21. Radtke JP, Kuru TH, Boxler S, Alt CD, Popeneciu IV, Huettenbrink C, et al. and community preferences for outcomes in prostate cancer: implications
Comparative analysis of transperineal template saturation prostate biopsy for clinical policy. Med Care. 2003 Jan;41(1):153–64. https://doi.org/10.1097/
versus magnetic resonance imaging targeted biopsy with magnetic 00005650-200301000-00017.
resonance imaging-ultrasound fusion guidance. J Urol. 2015;193(1):87–94. 42. Ramsay C, Pickard R, Robertson C, Close A, Vale L, Armstrong N, et al.
https://doi.org/10.1016/j.juro.2014.07.098. Systematic review and economic modelling of the relative clinical benefit
22. Rouvière O, Puech P, Renard-Penna R, Claudon M, Roy C, Mège-Lechevallier and cost-effectiveness of laparoscopic surgery and robotic surgery for
F, et al. Use of prostate systematic and targeted biopsy on the basis of removal of the prostate in men with localised prostate cancer. Health
multiparametric MRI in biopsy-naive patients (MRI-FIRST): a prospective, Technol Assess. 2012;16(41):1–313. https://doi.org/10.3310/hta16410.
multicentre, paired diagnostic study. Lancet Oncol. 2019;20(1):100–9. https:// 43. Pahwa S, Schiltz NK, Ponsky LE, Lu Z, Griswold MA, Gulani V. Cost-
doi.org/10.1016/S1470-2045(18)30569-2. effectiveness of MR imaging–guided strategies for detection of prostate
23. Drost FJH, Osses DF, Nieboer D, Steyerberg EW, Bangma CH, Roobol MJ, cancer in biopsy-naive men. Radiology. 2017;285(1):157–66. https://doi.org/1
et al. Prostate MRI, with or without MRI-targeted biopsy, and systematic 0.1148/radiol.2017162181.
biopsy for detecting prostate cancer (review). Cochrane Database Syst Rev. 44. Venderink W, Govers TM, de Rooij M, Fütterer JJ, Sedelaar JM. Cost-
2019;4(4):CD012663. https://doi.org/10.1002/14651858.CD012663.pub2. effectiveness comparison of imaging-guided prostate biopsy techniques:
24. Scattoni V, Maccagnano C, Zanni G, Angiolilli D, Raber M, Roscigno M, et al. systematic transrectal ultrasound, direct in-bore MRI, and image fusion.
Is extended and saturation biopsy necessary? Int J Urol. 2010 May;17(5):432– Am J Roentgenol. 2017;208(5):1058–63. https://doi.org/10.2214/AJR.16.1
47. https://doi.org/10.1111/j.1442-2042.2010.02479.x. 7322.
25. South A, Ahmed H, Brown L, Dudderidge T, Hindley R, Kaplan R, et al. MRC 45. Cerantola Y, Dragomir A, Tanguay S, Bladou F, Aprikian A, Kassouf W. Cost-
CTU at UCL briefing paper: multi-parametric MRI scans prior to biopsy for effectiveness of multiparametric magnetic resonance imaging and targeted
improving diagnosis of prostate cancer. 2017. biopsy in diagnosing prostate cancer. Urol Oncol. 2016;34(3):119.e1–9.
26. Borghesi M, Ahmed H, Nam R, Schaeffer E, Schiavina R, Taneja S, et al. https://doi.org/10.1016/j.urolonc.2015.09.010.
Complications after systematic, random, and image-guided prostate biopsy. 46. Barnett CL, Davenport MS, Montgomery JS, Wei JT, Montie JE, Denton BT.
Eur Urol. 2017;71(3):353–65. https://doi.org/10.1016/j.eururo.2016.08.004. Cost-effectiveness of magnetic resonance imaging and targeted fusion
27. Loeb S, Vellekoop A, Ahmed HU, Catto J, Emberton M, Nam R, et al. biopsy for early detection of prostate cancer. BJU Int. 2018;122(1):50–8.
Systematic review of complications of prostate biopsy. Eur Urol. 2013;64(6): https://doi.org/10.1111/bju.14151.
876–92. https://doi.org/10.1016/j.eururo.2013.05.049. 47. National Collaborating Centre for Cancer. Prostate Cancer: diagnosis and
28. Department of Statistics Singapore. Death and Life Expectancy - Latest treatment - Clinical Guideline. UK: National Collaborating Centre for Cancer;
Data. 2020 [cited 2020 14 Jun]; Available from: https://www.singstat.gov. 2014.
sg/find-data/search-by-theme/population/death-and-life-expectancy/la 48. National Institute for Health and Care Excellence. Guide to the methods of
test-data technology appraisal 2013. UK: NICE; 2013.
29. Monetary Authority of Singapore. Exchange Rate. 2020 [cited 2020 15 May]; 49. Claxton K. Exploring uncertainty in cost-effectiveness analysis.
Available from: https://secure.mas.gov.sg/msb/ExchangeRates.aspx Pharmacoeconomics. 2008;26(9):781–98. https://doi.org/10.2165/00019053-2
30. Bill-Axelson A, Holmberg L, Garmo H, Rider JR, Taari K, Busch C, et al. Radical 00826090-00008.
prostatectomy or watchful waiting in early prostate Cancer. N Engl J Med. 50. Gordon LG, Tuffaha H, James R, Scuffham P. Economic modelling of
2014;370(10):932–42. https://doi.org/10.1056/NEJMoa1311593. healthcare services for prostate cancer. Australia: Griffith University, Prostate
31. NICE. Guidelines NG131: Prostate cancer update health economic model Cancer Foundation of Australia; 2016.
report 2019. 51. Roehl KA, Antenor JAV, Catalona WJ. Serial biopsy results in prostate cancer
32. Menon M, Bhandari M, Gupta N, Lane Z, Peabody JO, Rogers CG, et al. screening study. J Urol. 2002;167(6):2435–9. https://doi.org/10.1016/S0022-
Biochemical recurrence following robot-assisted radical prostatectomy: 5347(05)64999-3.
analysis of 1384 patients with a median 5-year follow-up. Eur Urol. 2010; 52. American Urological Association. Prostate MRI and MRI-Targeted Biopsy in
58(6):838–46. https://doi.org/10.1016/j.eururo.2010.09.010. Patients with Prior Negative Biopsy; 2016.
33. Department_of_Statistics. Department of Statistics, Complete life tables for 53. Bill-Axelson A, Holmberg L, Garmo H, Taari K, Busch C, Nordling S, et al.
Singapore Resident Population, 2016–2017. 2018. Available at https://www. Radical prostatectomy or watchful waiting in prostate Cancer - 29-yearYou can also read