COVID-19, Air Transportation, and International Trade in the ASEAN+5 Region
←
→
Page content transcription
If your browser does not render page correctly, please read the page content below
ERIA-DP-2021-34 ERIA Discussion Paper Series No. 401 COVID-19, Air Transportation, and International Trade in the ASEAN+5 Region Anming ZHANG§ University of British Columbia, Canada Xiaoqian SUN Sebastian WANDELT Beihang University, Beijing, China Yahua ZHANG University of Southern Queensland, Australia Shiteng XU Ronghua SHEN East China Normal University, China September 2021 Abstract: This paper provides an in-depth description of the coronavirus disease (COVID-19) pandemic and its interactions with air transportation in the Association of Southeast Asian Nations (ASEAN)+5 region, and then links the changes in air connectivity to trade using a gravity regression model. We find that almost all the countries probably reacted too late in their decision to reduce flights in the early stage of the pandemic. As the pandemic evolved, most countries have significantly cut the number of flight connections, especially international flights. The reduced connectivity is found to have a significantly negative impact on trade for time-sensitive merchandise that is essential to consumers and businesses. This points to the importance of the region seeking alternative arrangements to restore air connectivity. We offer a way to construct optimal travel bubbles by using risk indexes introduced here. Other policy issues such as uniform standards and regulations, and regional ‘open skies’, are also discussed. Keywords: ASEAN, ASEAN+5, COVID-19, air transportation, trade JEL Classification: L93, F14, F15, H12, I18 Corresponding author: Anming Zhang. Address: Sauder School of Business, University of British Columbia, 2053 Main Mall, Vancouver, BC, Canada. Phone: 1-604-822-8429; Fax: 1-604- 822-9514. E-mail: anming.zhang@sauder.ubc.ca § This research was conducted as part of the Economic Research Institute for ASEAN and East Asia (ERIA) ‘Research on COVID-19 and Regional Economic Integration’ project. We thank Chimgee Mendee for helpful research assistance. The opinions expressed in this paper are the sole responsibility of the authors and do not reflect the views of ERIA.
1. Introduction

 The coronavirus disease (COVID-19) pandemic is considered the biggest
social and economic shock since the Great Depression. In what could be considered
a highly uncoordinated, almost chaotic manner, countries have closed their borders,
and people are reluctant/unable to travel due to country-specific lockdown measures.
Airlines were forced, by the obliteration of demand, into cancelling flights and
grounding fleets. Air transport is, accordingly, one of the hardest hit sectors by the
pandemic, while probably being one of the pandemic’s largest initial drivers. The
International Civil Aviation Organization estimated that the aviation industry
overall would lose up to $418 billion.1
 Doubtlessly, the pandemic has had a major impact on the economies in the
Asia Pacific. At the early stages of COVID-19, borders were suddenly closed, flights
banned, and the regular mobility of people almost completely halted in the region.
Overall, the pandemic has been testing the strength of the relationships between the
Southeast and East Asian economies. Relatedly, the region witnessed a major
development through the completion of the Regional Comprehensive Economic
Partnership (RCEP) negotiations, which was the key outcome of the 37th
Association of Southeast Asian Nations (ASEAN) Summit (9–15 November 2020).
By bringing ASEAN together with Japan, the Republic of Korea (henceforth,
Korea), China, Australia, and New Zealand, the RCEP agreement would make the
‘ASEAN+5’ the largest free trade area in the world, covering about one-third of the
world’s gross domestic product (GDP) – at $25.84 trillion in 2019
(vs $21.37 trillion for the United States (US) and $15.59 trillion for the European
Union).
 In this study, we investigate the impacts of COVID-19 on air transport
connectivity in the ‘ASEAN+5’ and the region’s international trade. ASEAN+5
consists of the 10 ASEAN Member States (AMS), plus Japan, Korea, China,
Australia, and New Zealand. As mentioned above, those five countries have been
known as ASEAN’s major free trade partners.2 We first examine the pandemic’s

1
 Unless indicated otherwise, the currency in this paper is United States (US) dollars.
2
 India had also been involved in RCEP negotiations. It pulled out of RCEP talks in November
2019, but the RCEP members have indicated that the door remains open to India. We note that the

 2
evolution in this region and its interaction with air transportation. We find, amongst
others, that the pandemic has significantly reduced the region’s air transport
connectivity. We then link the changes in air connectivity to trade using a gravity
regression model, a reliable empirical tool commonly used in international trade
literature. The reduced connectivity will, based on the regression analysis, have a
significantly negative impact on trade. Thus, both individual countries and the
region as a whole need to actively seek alternative arrangements and measures to
restore air connectivity. We will examine policies such as optimal ‘travel bubbles’,
uniform standards, and regional ‘open skies’ when dealing with the pandemic and
air transport connectivity.
 One contribution of this paper lies in the study area, as no studies have, to our
best knowledge, quantitatively examined the impact of air connectivity on trade in
the ASEAN or ASEAN+5 regions – a critical, emerging region in both aviation and
overall economic/trade activities.3
 Our second contribution is that we examine the mutual interactions between
air transportation and the COVID-19 pandemic. A number of recent studies have
examined the question of how air transportation contributes to the spread of
COVID-19. These studies, in essence, employ existing aviation data sets (usually
concerning the number of flights or the number of passengers between airport pairs)
to understand the spreading processes in the early months of 2020, where the major
medium of disease transmission was still air travel (e.g. Lau et al., 2020; Nakamura
and Managi, 2020; Zhang, Zhang, and Wang, 2020; Zhang et al., 2020). For
instance, Zhang et al. (2020) measured the imported case risk of COVID-19 from
international fights. Further, compartmental meta-population models or data
science techniques are used to obtain relationships between the number of cases and
air travel between different regions in the world, leading to predictions about the
time and extent of an arrival of COVID-19 in these places.4 Overall, the findings in

present study can, in a future study, be extended by including India in the context of the
‘ASEAN+6’.
3
 More generally, as typical international trade literature using the gravity model does not take air
transport connectivity into account, our findings suggest that this could be a major omission.
4
 Here, some studies take a rather global, network perspective (e.g. Coelho et al., 2020; Hussain et
al., 2020) while others focus on specific regions, e.g. China (e.g. Li et al., 2020); the European
Union/US (e.g. Nikolaou and Dimitriou, 2020; Peirlinck et al., 2020); Iran (Tuite et al., 2020);

 3
these studies are largely consistent, given the earlier (pre-COVID-19) work on
disease spreading. They found, in particular, that the number of passengers is a
rather reliable indicator of predicting when the disease arrives, given a fixed place
of origin, a concept known as ‘effective distance’ in the literature (Brockmann and
Helbing, 2013). As for the other direction of this air transport/COVID-19 link (i.e.
how the pandemic affects global, regional, and domestic air transportation, in both
the short and long term), it is a topic of numerous studies; see Sun et al. (2021) for
a comprehensive literature review. Complementing these two streams of literature,
we look at the mutual interactions between the pandemic and air transportation.
Moreover, since this is one of a few studies on COVID-19 and air transportation for
the ASEAN or ASEAN+5 regions, we will provide an in-depth description of the
interactions from a complex system perspective using network science tools.
 Finally, the present paper attempts to offer insights for a better policy
response to the crisis by the ASEAN+5. As indicated in ERIA (2020) and Kimura
(2020), connectivity enhancement is an important policy to improve the
attractiveness of the ASEAN region as an investment destination. One such
enhancement initiative is the ASEAN Open Skies policy, which came into effect in
2015. The policy – also known as the ASEAN Single Aviation Market (ASEAN-
SAM) – is intended to increase regional connectivity, integrate production
networks, and enhance regional trade by allowing airlines from AMS to fly freely
throughout the region via the liberalisation of air services under a single, unified air
transport market.5 The implications of our analysis for the ASEAN Open Skies will
be discussed.

Brazil (Ribeiro et al., 2020); or Columbia (Gómez-Rios, Ramirez-Malule, and Ramirez-Malule,
2020).
5
 Studies have found that frequencies of air flights play an important role in the location,
agglomeration, and evolution of economic activities. Fu, Oum, and Zhang (2010) and Zhang and
Graham (2020) pointed out that air transport imposes significant positive externalities to other
industries. For example, Button and Lall (1999) found that the presence of a hub airport could
greatly increase high-tech employment by an average of 12,000 jobs in the airport catchment.
Therefore, air transport has been long regarded as a critical sector to the normal operation of an
economy.

 4
The paper is organised as follows. Section 2 describes the background of the
ASEAN+5 and the COVID-19 pandemic in the region. Section 3 examines the
interactions between the pandemic and air transportation, including the impact on
air transport connectivity. Section 4 develops the gravity model and reports its
regression results. Section 5 discusses policy implications for travel bubbles,
uniform standards, and open skies. Section 6 summarises the results and discusses
directions for further research.

2. Background of the ASEAN+5 and the Pandemic

 ASEAN was created on 8 August 1967; the founding members were
Indonesia, Malaysia, the Philippines, Singapore, and Thailand. Between 1984 and
1999, five additional members joined in the following order: Brunei, Viet Nam, the
Lao People’s Democratic Republic (Lao PDR), Myanmar, and Cambodia. On 15
December 2008, ASEAN became a legal entity. The major focus of ASEAN is on
economic cooperation and trade amongst its members and with the rest of the world.
It now covers a population of 600 million people, which is notably larger than those
of the European Union (447 million) and the US plus Canada (367 million).
Indonesia and Thailand are the largest economies in ASEAN, with smaller countries
expecting to boost their economies through the association.
 In the aftermath of the 1997 Asian Financial Crisis, an informal ‘ASEAN+3’
(China, Japan, and Korea) was built, named the East Asia Vision Group. As
mentioned above, in November 2020 the RCEP agreement brought together
ASEAN, China, Japan, Korea, Australia, and New Zealand. Our analysis focuses
on this ‘ASEAN+5’ region; see Figure 1 for a visual representation of the countries’
geography and Table 1 for an overview. Of the 15 countries, China is by a
considerable margin the largest and most populous country, followed by Australia
(in terms of size) and Indonesia (in terms of population). The country with the least
population is Brunei and the smallest country is Singapore. We use the ISO 3 code
(see the first column of Table 1) to refer to the countries.

 5
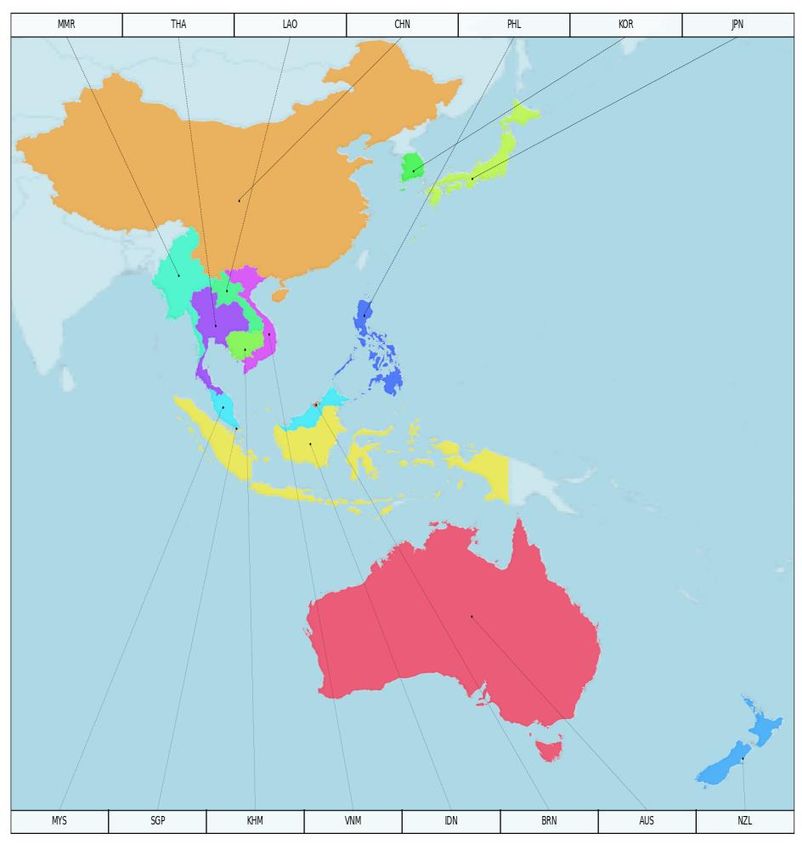
Figure 1: Fifteen Countries in ASEAN+5

ASEAN = Association of Southeast Asian Nations, ISO = International Organization for
Standardization.
Note: The countries are labelled by their ISO 3 country codes.
Source: Authors (data from Flightradar24 (n.d.), https://www.flightradar24.com (accessed 25
February 2021); visualisation: Matplotlib).

 Table 1: Overview of the 15 ASEAN+5 Countries
 ISO 3 Full name Capital Area (km2) Population
 BRN Nation of Brunei Bandar Seri 5,765 428,962
 Begawan
 IDN Republic of Indonesia Jakarta 1,904,569 267,663,435
 KHM Kingdom of Cambodia Phnom Penh 181,035 16,249,798
 LAO Lao People’s Democratic Republic Vientiane 236,800 7,061,507
 MMR Republic of the Union of Myanmar Naypyidaw 676,578 53,708,395
 MYS Malaysia Kuala Lumpur 330,803 31,528,585
 PHL Republic of the Philippines Manila 342,353 106,651,922
 SGP Republic of Singapore Singapore 710 5,638,676
 THA Kingdom of Thailand Bangkok 513,120 69,428,524
 VNM Socialist Republic of Viet Nam Hanoi 331,212 95,540,395
 AUS Commonwealth of Australia Canberra 7,692,024 24,982,688
 CHN People’s Republic of China Beijing 9,706,961 1,392,730,000
 JPN Japan Tokyo 377,930 126,529,100
 KOR Republic of Korea Seoul 100,210 51,606,633
 NZL New Zealand Wellington 270,467 4,841,000
 ASEAN = Association of Southeast Asian Nations, ISO = International Organization for Standardization,
 km2 = square kilometre.
 Source: World Bank (2020), World Development Indicators, 2020. Washington, DC: World Bank.
 https://databank.worldbank.org/source/world-development-indicators (accessed 15 December 2020).

 6
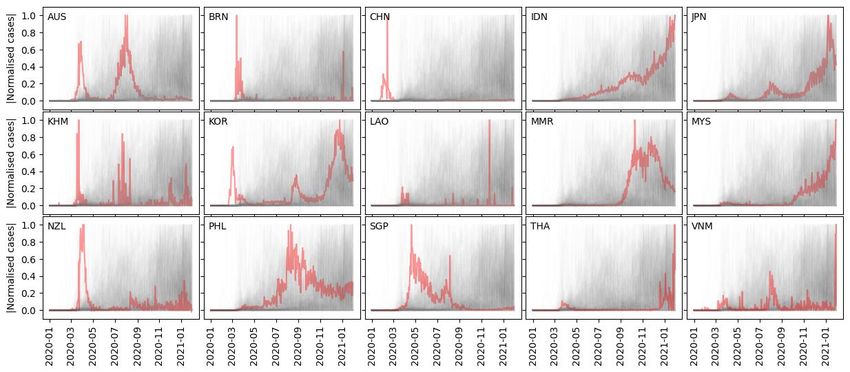
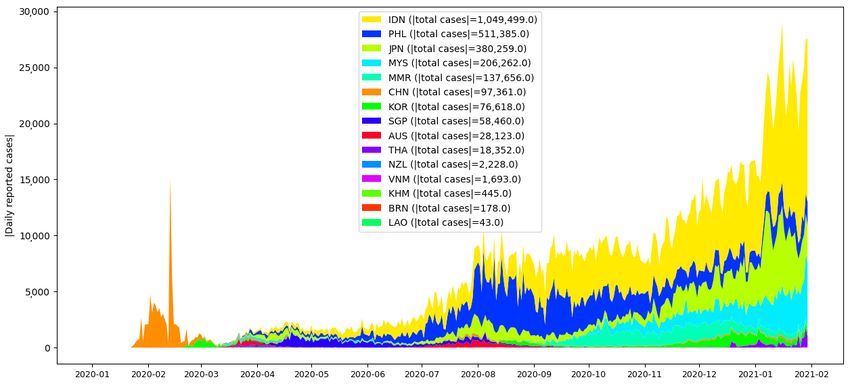
All 15 countries have confirmed cases, yet the success in fighting COVID-
19 varies across the countries. Figure 2 shows the temporal evolution of the
number of reported COVID-19 cases in each country, as a stacked line plot over
January 2020–February 2021. It can be seen that Indonesia, the Philippines, Japan,
and Malaysia are hit hardest by COVID-19, while other countries, such as the
Lao PDR, Brunei, Cambodia, New Zealand, and Australia did much better
according to these indicators.

 Figure 2: Daily COVID-19 Cases in Each ASEAN+5 Country,
 Jan 2020–Feb 2021

ASEAN = Association of Southeast Asian Nations, COVID-19 = coronavirus disease, ISO =
International Organization for Standardization.
Notes: The total cases in each country are also given, with the countries being sorted according to
their total number of (reported) cases in descending order. The countries are labelled by their ISO 3
country codes: AUS = Australia, BRN = Brunei, CHN = China, IDN = Indonesia, JPN = Japan,
KHM = Cambodia, KOR = Republic of Korea, LAO = Lao People’s Democratic Republic (Lao
PDR), MMR = Myanmar, MYS = Malaysia, NZL = New Zealand, PHL = Philippines, SGP =
Singapore, THA = Thailand, VNM = Viet Nam.
Source: Authors (data from GitHub (n.d.), OWID/COVID-19 data. https://github.com/owid/covid-
19-data (accessed 25 February 2021); visualisation: Matplotlib).

 To better understand the evolution/phases of COVID-19 in the ASEAN+5,
Figure 3 reports the normalised number of cases for each country over time (Jan
2020–Feb 2021). Here, the normalisation is performed as a max-normalisation,
where all the daily reported cases in a country are divided by the country’s maximum
number of reported cases. As can be seen from Figure 3, China was hit strongest
in the early stage of the pandemic, with the number of infections reaching a peak

 7
in March 2020. Following a very strict quarantine and testing policy, together with
heavy (and early) travel bans and flight restrictions, China was able to quickly
contain the spread of COVID-19. Now, it is one of the few countries that is
considered essentially COVID-19-free. Brunei and New Zealand exhibit similar
patterns to China, having an early peak but then being able to control the number
of infections. Australia and Singapore show a two-peak pattern, encountering a
second wave around August 2020 but then being able to control the number of
infections. Other countries have had to fight higher infection counts towards the
later stages of the pandemic, e.g. the Philippines, Japan, Indonesia, Malaysia, and
Myanmar. Compared to the global situation, however, the ASEAN+5 countries as
a whole have performed much better in terms of confirmed cases (and deaths
related to COVID-19).

 Figure 3: Normalised Daily COVID-19 Cases in the ASEAN+5,
 Jan 2020–Feb 2021

ASEAN = Association of Southeast Asian Nations, COVID-19 = coronavirus disease, ISO =
International Organization for Standardization.
Notes: The normalised daily COVID-19 cases in the ASEAN+5 are in red, while those of all the
other countries in the world are in grey. The countries are labelled by their ISO 3 country codes:
AUS = Australia, BRN = Brunei, CHN = China, IDN = Indonesia, JPN = Japan, KHM = Cambodia,
KOR = Republic of Korea, LAO = Lao People’s Democratic Republic (Lao PDR),
MMR = Myanmar, MYS = Malaysia, NZL = New Zealand, PHL = Philippines, SGP = Singapore,
THA = Thailand, VNM = Viet Nam.
Source: Authors (data from GitHub (n.d.), OWID/COVID-19 data. https://github.com/owid/covid-
19-data (accessed 25 February 2021); visualisation: Matplotlib).

 We next look at the synchronisation between the numbers of reported cases
amongst the ASEAN+5 countries. The experimental data are generated as follows:

 8
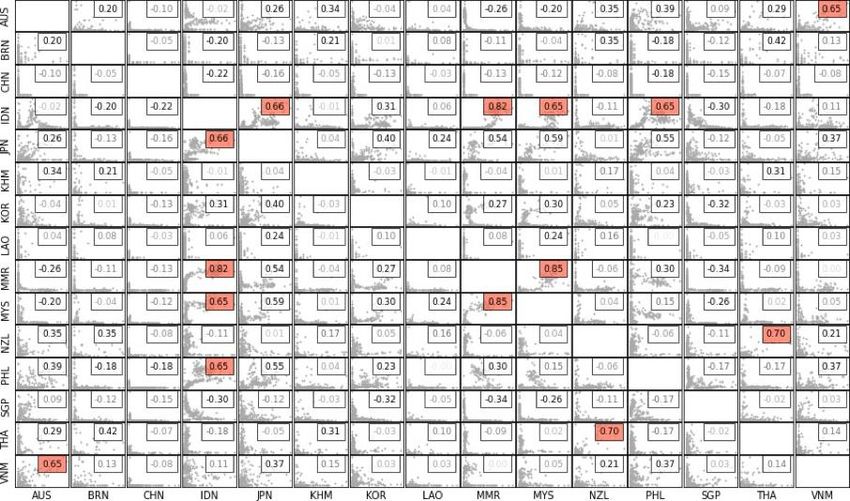
For each pair of countries, the number of infections induce two sets of time series.
The time series are then 0-1-normalised to reduce the effects of larger populations,
since we are interested in a similar evolutionary pattern, not in the same order of
magnitude. For each pair of the normalised time series, the Pearson R is computed.
The country-pairwise correlation between COVID-19 (number of) infections is
reported in Figure 4. The obtained R-value is reported on the upper right of each
panel; the diagonal entries are not shown. It can be seen that some countries are
surprisingly synchronised regarding this correlation indicator, e.g. Malaysia and
Myanmar. For many other country pairs, there is not much correlation. For
instance, for all the pairs involving China, there is no high correlation with the
other countries. This may be because China went through its peak at the earliest
phase of the pandemic.

Figure 4: Pairwise Correlation of COVID-19 Cases Between Countries in the
 ASEAN+5, Jan 2020–Feb 2021

ASEAN = Association of Southeast Asian Nations, COVID-19 = coronavirus disease, ISO =
International Organization for Standardization.
Notes: The countries are labelled by their ISO 3 country codes: AUS = Australia, BRN = Brunei,
CHN = China, IDN = Indonesia, JPN = Japan, KHM = Cambodia, KOR = Republic of Korea,
LAO = Lao People’s Democratic Republic (Lao PDR), MMR = Myanmar, MYS = Malaysia,
NZL = New Zealand, PHL = Philippines, SGP = Singapore, THA = Thailand, VNM = Viet Nam.
Correlations with coefficient >= 0.65 are highlighted in red.
Source: Authors (data from GitHub (n.d.), OWID/COVID-19 data. https://github.com/owid/covid-
19-data (accessed 25 February 2021); visualisation: Matplotlib).

 9
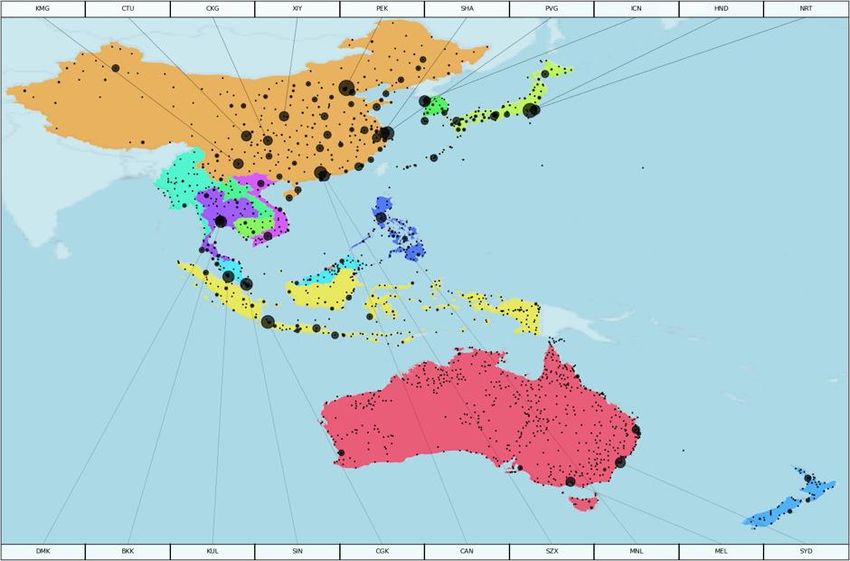
3. Air Transport Connectivity and Interactions with the
 Pandemic

3.1. Air transport connectivity in the ASEAN+5

 It has been a long-standing goal of ASEAN to integrate and boost the air
travel sector; see its Roadmap for Integration of Air Travel Sector and the follow-
ups, which aim at advancing the full liberalisation of air transport services in
ASEAN (Law, Zhang, and Zhang, 2018). A wide range of open skies instruments
have emerged throughout the years, indicating the importance of air transportation
for an integrated ASEAN economy. In particular, if the ASEAN–SAM were
successfully implemented (absent the COVID-19 pandemic), there would be no
regulatory limits on the frequency or capacity of flights between international
airports across the 10 AMS.
 Figure 5 visualises the airports located in the ASEAN+5. We use the number
of passengers at an airport in 2019 to measure its market size. The top 20 airports
are highlighted with their 3-letter International Civil Aviation Organization
(ICAO) code.6 This region contains some of the busiest airports in the world, e.g.
PEK (Beijing Capital Airport), PVG (Shanghai Pudong Airport), HND (Tokyo
Haneda Airport), ICN (Incheon Airport), CGK (Jakarta Airport), SYD (Sydney
Airport), and CYN (Guangzhou Airport).

6
 Here, ‘China’ refers to Mainland China, so (for example) Hong Kong is not included.

 10
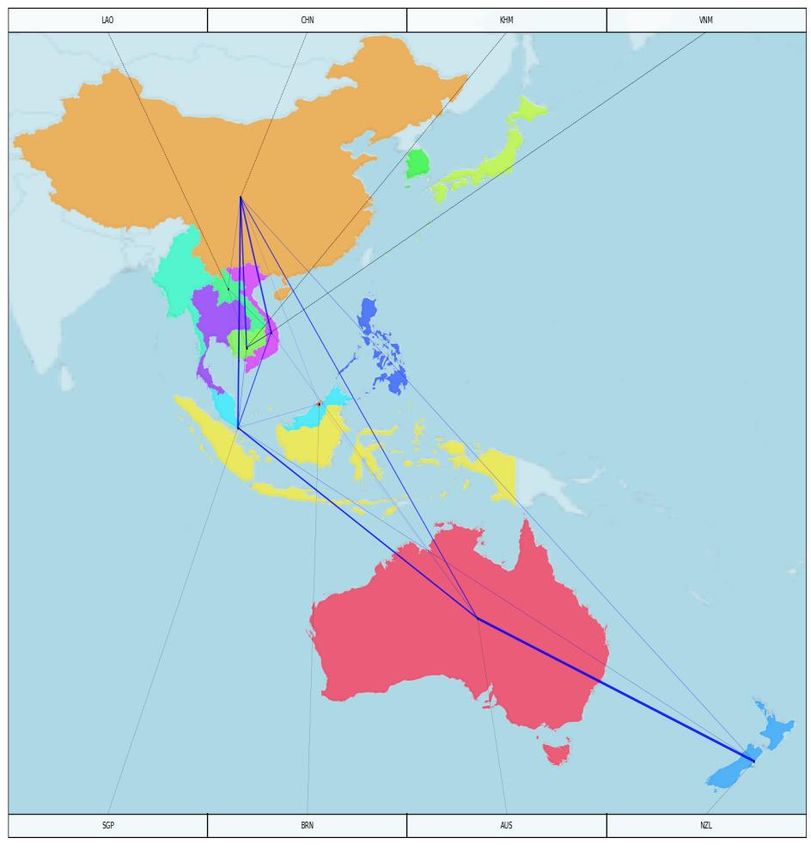
Figure 5: Airports in the ASEAN+5 and Its Top 20 Airports

ASEAN = Association of Southeast Asian Nations.
Notes: The size of a circle marker correlates with the number of passengers at the airport in 2019.
The top 20 airports indicated are (clockwise, from the top left): KMG = Kunming Airport, CTU =
Chengdu Airport, CKG = Chongqing Airport, XIY = Xian Airport, PEK = Beijing Capital Airport,
SHA = Shanghai Hongqiao Airport, PVG = Shanghai Pudong Airport, ICN = Incheon Airport, HND
= Tokyo Haneda Airport, NRT = Tokyo Narita Airport, SYD = Sydney Airport, MEL = Melbourne
Airport, MNL = Manila Airport, SZX = Shenzhen Airport, CAN = Guangzhou Airport, CGK =
Jakarta Airport, SIN = Changi Airport, KUL = Kuala Lumpur Airport, BKK = Bangkok
Suvarnabhumi Airport, DMK = Bangkok Don Mueang Airport.
Source: Authors (data from Flightradar24 (n.d.), https://www.flightradar24.com (accessed 25
February 2021); visualisation: Matplotlib).

 In the following analysis, we examine the regional and international air
transport connectivity of the ASEAN+5. In Figure 6, the regional air connectivity
within the ASEAN+5 is visualised. Here, all airports inside a country are
aggregated into a single node representing the whole country; domestic flights
inside a country are discarded (i.e. there are no self-loops). We computed the
average number of daily flights for all the pairs of countries in the ASEAN+5; the
line width of a country pair correlates with this average number of flights. It can
be seen that China has very strong ties to several countries: Japan (almost 200
flights per day), Thailand (175 flights per day), and Korea (172 flights per day).
Japan and Korea are well connected with each other (at 154 flights per day). In

 11
addition, Malaysia and Indonesia (95 flights per day) and Singapore and Indonesia
(75 flights per day) have relatively strong ties with each other.

 Figure 6: Regional Connections as Average Daily Flights Between
 ASEAN+5 Countries in 2019

ASEAN = Association of Southeast Asian Nations.
Notes: All airports inside an ASEAN+5 country are aggregated into a single node representing the
whole country. The thickness of a line represents the degree of air connections between two
ASEAN+5 countries.
Source: Authors (data from Flightradar24 (n.d.), https://www.flightradar24.com (accessed 25
February 2021); visualisation: Matplotlib).

 Next, consider the international connectivity of the ASEAN+5 with the rest
of the world. For this purpose, we collected all flights between any ASEAN+5
country and all the external countries/regions for the year 2019. Figure 7 reports
the top 20 such external partners, in terms of the average daily number of flights.
It can be seen that Hong Kong is – by a large amount – the partner with the best
country/region-level air connectivity, having almost 100 daily flights with the
ASEAN+5. Other countries/regions with frequent connections include the US (57
flights per day) and India (35 flights per day).

 12
Figure 7: International Connections as Average Daily Flights Between the
 ASEAN+5 and Other Countries/Regions in 2019

ASEAN = Association of Southeast Asian Nations.
Notes: The ASEAN+5 is represented by a black circle marker over Indonesia. The 3-letter codes in
the figure stand for different countries: CAN = Canada, US = United States, GBR = United
Kingdom, RUS = Russia, FRA = France, NLD = Netherlands, DEU = Germany, ITA = Italy, FIN =
Finland, TUR = Turkey, SAU = Saudi Arabia, QAT = Qatar, ARE = United Arab Emirates, LKA =
Sri Lanka, IND = India, NPL = Nepal, BGD = Bangladesh, MAC = Macau, HKG = Hong Kong,
GUM = Guam. The number inside the parentheses for each country indicates the international
connections.
Source: Authors (data from Flightradar24 (n.d.), https://www.flightradar24.com (accessed 25
February 2021); visualisation: Matplotlib).

3.2. Evolution of air transportation during the advent of COVID-19
 We now describe the temporal evolution of air transportation of ASEAN+5
countries during the advent of COVID-19 (i.e. the so-called ‘first wave’). Figure 8
shows the total number of flights per day for the top 20 airports from 1 January 2019
to 31 December 2020. This 2-year period covers (i) 1 year before the COVID-19
pandemic, (ii) about 4 months of the intensive first wave around Asia and the world,
and (iii) another 8 months with distinct case developments in different regions.
Given that air transportation can play a significant role in the initial phase of a
pandemic – the World Health Organization (WHO) declared COVID-19 a global
pandemic on 12 March 2020 – this 2-year period is, we believe, adequate for
analysing the initial drivers. We use aircraft-specific flight data from
http://www.flightradar24.com. The data set covers almost 3,000 airports in the
world and more than 100 airlines. We extract the daily flights for the regions under
consideration.

 13
Figure 8: Number of Daily Flights at Top 20 Airports in the ASEAN+5,
 Jan 2019–Dec 2020

ASEAN = Association of Southeast Asian Nations.
Notes: The code in the upper left corner of each box represents a specific airport. AUS: MEL =
Melbourne Airport, AUS: SYD = Sydney Airport, CHN: CAN = Guangzhou Airport, CHN: CKG
= Chongqing Airport, CHN: CTU = Chengdu Airport, CHN: KMG = Kunming Airport, CHN: PEK
= Beijing Capital Airport, CHN: PVG = Shanghai Pudong Airport, CHN: SHA = Shanghai
Hongqiao Airport, CHN: SZX = Shenzhen Airport, CHN: XIY = Xian Airport, IDN: CGK = Jakarta
Airport, JPN: HND = Tokyo Haneda Airport, JPN: NRT = Tokyo Narita Airport, KOR: ICN =
Incheon Airport, MYS: KUL = Kuala Lumpur Airport, PHL: MNL = Manila Airport, SGP: SIN =
Changi Airport, THA: BKK = Bangkok Suvarnabhumi Airport, THA: DMK = Bangkok Don
Mueang Airport.
Source: Authors (data from Flightradar24 (n.d.), https://www.flightradar24.com (accessed 25
February 2021); visualisation: Matplotlib).

 It can be seen from Figure 8 that all 20 airports are equally affected by the
first wave, albeit some airports earlier (e.g. Chinese airports) and others slightly
later (e.g. airports in Korea, Singapore, and Thailand). The magnitude of flight
reductions at these airports is striking: Except for CAN (Guangzhou), PVG
(Shanghai Pudong), SZX (Shenzhen), and HND (Tokyo Haneda), all these major
airports came to a complete halt for a specific period of time. Some of them are on
the way to recovery, e.g. major Chinese airports, while others remain at marginal
operations, e.g. MEL (Melbourne), AUS (Sydney), ICN (Incheon), KUL (Kuala
Lumpur), MNL (Manila), NRT (Tokyo Narita), SIN (Changi), and BKK (Bangkok
Suvarnabhumi). Notably, the airports in the latter category often are the dominant
international hubs in their countries.
 The next analysis concerns the ASEAN+5-wide evolution of air
transportation dissecting, separately, the effects on domestic flights and
international flights. Figure 9 visualises the temporal evolution of domestic flights

 14
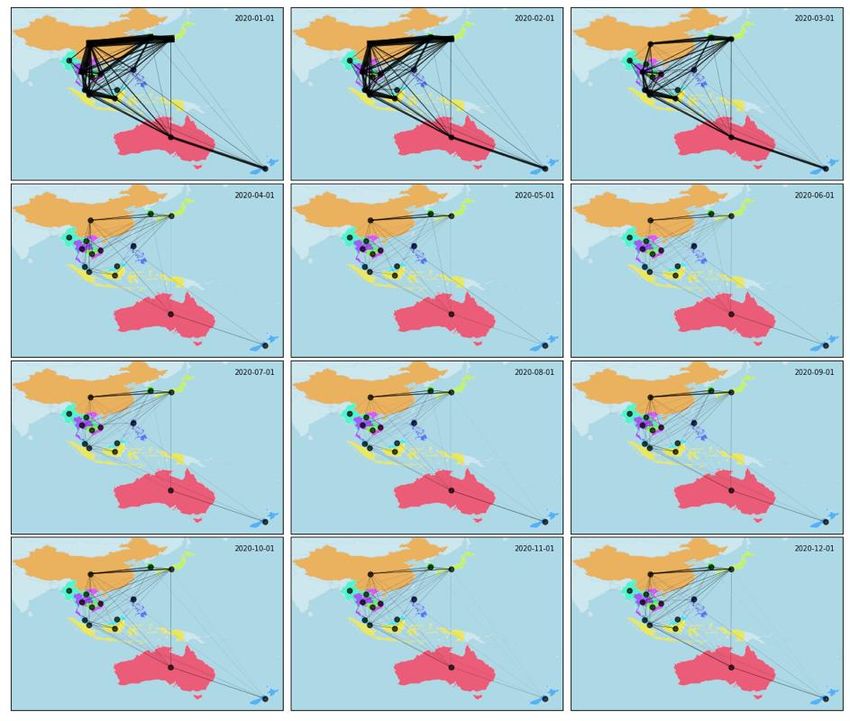
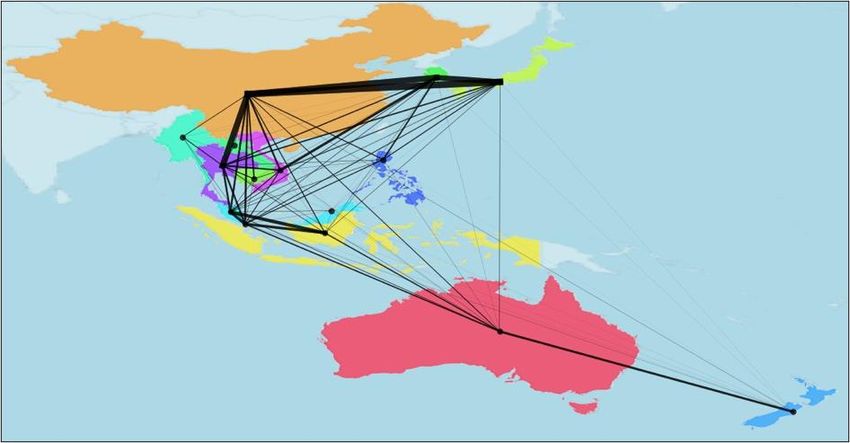
(in blue) and international flights (in red) during the 2-year period. Note that some
countries do not have any domestic flights due to their size, e.g. Brunei and
Singapore. While domestic and international flights were initially reduced equally,
it can be seen that the long-term effects of flight bans/cancellations are mainly
taking place on the international flights. Especially in China, Japan, Indonesia, and
Viet Nam, the numbers of domestic flights have quickly reached their pre-COVID-
19 levels. This means that the countries/airlines remain concerned mainly with
controlling the international flow of passengers, while being less afraid of the
effects of domestic passenger travelling. This observation is noteworthy, since the
virus does not concern political or administrative borders.

 Figure 9: Evolution of Domestic and International Flights in the ASEAN+5,
 Jan 2019–Dec 2020

ASEAN= Association of Southeast Asian Nations, ISO= International Organization for
Standardization.
Note: The countries are labelled by their ISO 3 country codes: AUS = Australia, BRN = Brunei,
CHN = China, IDN = Indonesia, JPN = Japan, KHM = Cambodia, KOR = Republic of Korea,
LAO = Lao People’s Democratic Republic (Lao PDR), MMR = Myanmar, MYS = Malaysia,
NZL = New Zealand, PHL = Philippines, SGP = Singapore, THA = Thailand, VNM = Viet Nam.
Source: Authors (data from Flightradar24 (n.d.), https://www.flightradar24.com (accessed 25
February 2021); visualisation: Matplotlib).

 In Figure 10, we investigate the evolution of intra-ASEAN+5 flights as a
network. For the first day of each month from January to December 2020, we show
the intra-ASEAN+5 country network, where the width of a link correlates with
the number of flights between two countries. We can see that the topological
connectivity is somehow still present between countries in the ASEAN+5, but the
magnitude of flights is significantly reduced owing to the pandemic.

 15
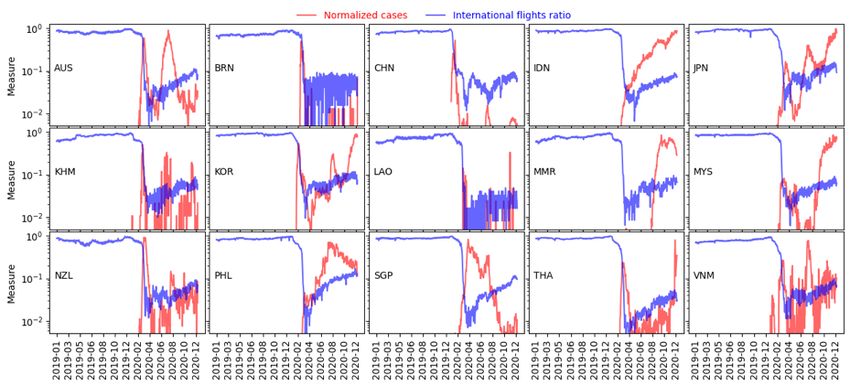
Figure 10: Evolution of the Country Network Within the ASEAN+5, Jan–Dec 2020

ASEAN = Association of Southeast Asian Nations.
Note: The width of a link correlates with the number of flights between two countries.
Source: Authors (data from Flightradar24 (n.d.), https://www.flightradar24.com (accessed 25
February 2021; visualisation: Matplotlib).

3.3. Synchronisation between international flights and COVID-19 cases?

 The previous subsection has revealed that the number of international flights
was greatly reduced for all the ASEAN+5 countries; and remained low until the
summer of 2020. A natural question is then: Were these countries’ borders closed
on time, or too late already? To obtain a first-cut visual impression of the
synchronisation between (i) the time when the number of international flights was
reduced for a country and (ii) the time when COVID-19 reached the country,
Figure 11 reports the temporal evolution of the international flight ratio (in blue)
and normalised cases (in red) by country. Here, the international flight ratio is
obtained as the current number of flights on a specific day over the maximum
number of flights (usually before COVID-19). The normalised number of cases is

 16
min-max normalised. Both measures are plotted using a log-scale, in order to see
the initial outbreak. We find that that almost all the countries had reported cases
prior to a significant reduction in international flights. In other words, the
international connectivity was cut only after the disease had already arrived.

Figure 11: Evolution of the Normalised COVID-19 Cases vs the International
 Flight Ratio (Min-Max Normalised) in the ASEAN+5, Jan 2019–Dec 2020

ASEAN = Association of Southeast Asian Nations, COVID-19 = coronavirus disease, ISO =
International Organization for Standardization.
Note: The countries are labelled by their ISO 3 country codes: AUS = Australia, BRN = Brunei,
CHN = China, IDN = Indonesia, JPN = Japan, KHM = Cambodia, KOR = Republic of Korea,
LAO = Lao People’s Democratic Republic (Lao PDR), MMR = Myanmar, MYS = Malaysia,
NZL = New Zealand, PHL = Philippines, SGP = Singapore, THA = Thailand, VNM = Viet Nam.
Source: Authors (data from Flightradar24 (n.d.), https://www.flightradar24.com (accessed 25
February 2021) and GitHub (n.d.), OWID/COVID-19 data. https://github.com/owid/covid-19-data
(accessed 25 February 2021); visualisation: Matplotlib).

 Figure 12 takes the analysis one step further, by computing the number of
days between the day with the first 10 confirmed cases and the day with the
maximal reduction of international flights. The difference is positive for all the
countries except the Lao PDR. This, again, shows that the measures against
COVID-19, i.e. closing borders/flight bans, came too late in the ASEAN+5 region.7

7
 A similar look at the mutual interactions between the pandemic and air transportation for the rest
of the world revealed that the ASEAN+5 acted more timely than other regions. This contributes to
its overall better performance in containing the virus spread than the other regions’ performance.

 17
Figure 12: Delay in the Number of Days Between the First 10 COVID-19
 Cases and the Maximum International Flight Ban

COVID-19 = coronavirus disease, ISO = International Organization for Standardization.
Note: The countries are labelled by their ISO 3 country codes: AUS = Australia, BRN = Brunei,
CHN = China, IDN = Indonesia, JPN = Japan, KHM = Cambodia, KOR = Republic of Korea,
LAO = Lao People’s Democratic Republic (Lao PDR), MMR = Myanmar, MYS = Malaysia,
NZL = New Zealand, PHL = Philippines, SGP = Singapore, THA = Thailand, VNM = Viet Nam.
Source: Authors (data from Flightradar24 (n.d.), https://www.flightradar24.com (accessed 25
February 2021) and GitHub (n.d.), OWID/COVID-19 data. https://github.com/owid/covid-19-data
(accessed 25 February 2021); visualisation: Matplotlib).

4. Gravity Model and Regression Results

 As seen from section 3, while the topological connectivity is somehow still
present between countries in the ASEAN+5, the magnitude of flights is
significantly reduced during the pandemic. We now employ econometric
regressions to explore how the changes in air connectivity have affected regional
economic integration in terms of international trade.

4.1. Gravity model

 Economists have attributed the rapid growth in international trade since
World War II to the decline in international transport costs (Hummels, 2007). Air
transport had a negligible share in the international trading system in the 1950s.
However, with the advance in technology, the decrease in transport cost, and
liberalisation of airfreight service, air cargo has become a supporting pillar of
today’s international trading system, carrying 35% of value of global trade that is
less than 1% by volume (IATA, 2016). Grosso and Shepherd (2011) reported a

 18
strong relationship between air transport liberalisation and trade in high-end
manufactured goods and time-sensitive products, parts, and components.8
 Restrictions on the movement of flights across international borders due to
the COVID-19 outbreak have implications for international trade. Although freight
flights are allowed to operate as usual, a significant amount of merchandise is
transported as belly cargo in passenger flights, 9 and the decrease in passenger
flights implies a significant rise in transport costs. The regulatory restrictions
implemented during the COVID-19 crisis include
• the suspension of e-visa and visa-on-arrival programmes and visa waiver/visa
 free entry;
• the suspension of the entry of foreign nationals;
• the suspension of international flights;
• restrictions on the number of international flights; and
• physical distancing requirements for airlines to block seats on international
 flights.

 All these measures have the effect of reducing the movement of people and
at the same time, come with the effect of stifling the flow of air cargo and trade and
disrupting supply chains. The effects may be particularly present for the types of
commodities that are time- and temperature-sensitive and normally require air
transportation.
 To establish the relationship between air transport connectivity and
merchandise exports that rely on good air transport connectivity, the econometric
model is developed on a gravity model, a reliable empirical tool commonly used in
international trade literature. The estimated gravity model can then be used to
forecast the trade flows in the future when regulatory restrictions and air transport
connectivity change. A simple intuitive gravity model can be expressed as follows:

 (1)
 = 0

8
 See also, amongst others, Zhang and Zhang (2002) and Dewulf, Meersman, and Van de Voorde
(2019).
9
 Passenger flights usually carry around 40%–50% of global air cargo capacity in their bellies.

 19
where denotes the bilateral flow between region i and region j; and
 ( ) denotes the GDP of region i (region j). Traditional gravity models
assume that trade between two countries is related positively to GDP, and
negatively to the distance between them. GDP measures the size of the economy.
 denotes the distance between the two regions, which is considered as a proxy
for trade cost.
 Apart from the bilateral distance, other trade costs or incentive variables that
potentially impede or facilitate bilateral trade flows are included in the model,
including air transport connectivity, travel restriction measures, a common border,
a common language, colonial links, trade agreements, etc. Amongst these variables,
a decrease in transport connectivity and the implementation of travel restrictions
raise transport costs and thus reduce trade between countries.
 Following the above discussion, we expand (1) by further specifying the
gravity model in a log-linear form as follows:10

 = 0 + 1 + 2 + 3 + 4 ℎ +
 5 ℎ + 6 + 7 _ + 8 +
 10 2020 1 + 11 2020 2 + 12 2020 3 + (2)

where ln denotes the natural logarithms of the variables; i and j indicate exporter
and importer, respectively; t denotes the time period; and ijt is the disturbance term.
The passenger flight frequency variable, paxflight, is the number of passenger
flights between countries i and j in a time period, and is used as a proxy for air
transport connectivity. Further, is the exports’ value from country i to country
j at time t in current US dollars. The freight data may also help us detect flows of
manufacturing activities, especially in the high-tech sector (ERIA, 2020). Based on
earlier studies, this paper considers six merchandise exports extracted from the
United Nations (UN) Comtrade database:

10
 An alternative approach using the aggregate export data is presented in Appendix A to show the
long- and short-run relationships between trade and the availability of passenger flight services.

 20
• Fresh fruits (commodity codes 0807–0810; hereafter, fruits)
• Medicaments consisting of mixed or unmixed products for therapeutic or
 prophylactic use, put in measured doses or in forms or packings for retail sale
 (commodity code 3004; hereafter, medicaments)
• Line telephony or line telegraphy apparatus, including such apparatus as
 carrier-current line systems (commodity code 8517; hereafter, telephony)
• Medical equipment and instruments (commodity codes 9018–9022; hereafter,
 medical instruments)
• Diodes, transistors, and similar semiconductor devices, including
 photovoltaic cells assembled or not in modules, panels, and light emitting
 mounted piezo-electric crystals (commodity code 8541; hereafter,
 semiconductor)
• Electronic integrated circuits and micro-assemblies (commodity code 8542;
 hereafter, electronics).

 The gravity model, (2), is estimated with panel data from multiple countries
and years. Quarterly export data for the above six products amongst the 15
ASEAN+5 countries are obtained for the first quarter (Q1) of 2010 to Q3 2020.11
The GDP data were obtained from the World Bank’s World Development
Indicators in 2010 constant US dollars. Quarterly passenger frequency (paxflight)
data are taken from the International Air Transport Association (IATA) Airport
Intelligence database.
 Furthermore, the distance variable (dist) in model (2) measures the great
circle distance between two countries’ capital cities (Table 1). We also include a
border dummy (border) that takes the value of 1 when two countries share a
common border. Similarly, a common language dummy (commlang_off) is
considered if two countries speak the same language. A common coloniser dummy
(comcol) refers to those sharing a common coloniser. Apart from the GDP and flight
frequency data, all other data are from the Centre d’Etudes Prospectives et
d’Informations Internationales (CEPII) database. Finally, a dummy for each of the
three quarters of 2020 is created to capture the effects of COVID-19 in each quarter.

11
 Note that Q3 2020 is the latest quarter when all the data are available for our variables.

 21
As discussed earlier, these effects may differ due to different stages and
intensity/extensity levels of the virus spread, as well as different travel restriction
measures.
 Not all the countries produce and export the abovementioned six categories
of products. Therefore, there is a large number of zero trade flows in our sample.
How to deal with the zero-trade-flow problem has received much attention in the
last decade and many methods have been proposed (see Zhang, Lin, and Zhang
(2018) for a review). Identifying the best performing model remains controversial
(Kareem, Martinez-Zarzoso, and Brümmer, 2016). Given the situation, we first use
the Poisson pseudo-maximum likelihood (PPML) estimator technique. It was
proposed by Santos Silva and Tenreyro (2006) with simulation evidence that it can
effectively solve the large zero value observations. Second, we simply add a small
constant (0.01) to all the zero values to allow for the use of the log-linear equation
to be estimated. We then use the generalised method of moments (GMM) system
approach developed by Blundell and Bond (1998) to estimate a dynamic gravity
model.

4.2. Regression results

 The estimation results of the two approaches are given in Tables 2 and 3,
respectively. As expected, a larger size of the economy would mean more
transactions of the six categories of products. The distance variable does not always
have a significantly negative impact for the exports of these products, especially
when the dynamic model is used. This is understandable when exporting these
products is significantly associated with air transport. Zhang and Zhang (2016)
argued that deregulation in air transportation has brought about lower airfares and
cargo rates, and that geographical distance is no longer a good proxy for travel cost.
Furthermore, if a significant part of these products is transported by air, then it is
also understandable that the coefficients of the border dummy may not always
promote international trade. Speaking the same language would strengthen the
international trade of the products considered in this study. Moreover, the lagged
dependent variables in Table 3 are generally positive and significant, indicating that
a certain degree of inertia exists in exporting and importing these products. Ignoring
the past trend may overstate the effects of other trends.

 22
Table 2: PPML Estimator Results
 Variables Fruits Medicaments Medical instruments Telephony Semiconductor Electronics

Paxflight 0.246*** 0.126*** 0.451*** 0.280* 0.155*** 0.245***
 (0.046) (0.044) (0.037) (0.145) (0.034) (0.046)
export_GDP 0.203*** 0.281*** 0.304*** 0.694*** 0.468*** 0.203***
 (0.043) (0.066) (0.031) (0.105) (0.055) (0.043)
import_GDP 0.609*** 2.471*** 0.424*** 0.561*** 0.675*** 0.608***
 (0.069) (0.042) (0.028) (0.091) (0.058) (0.070)
dist –0.680*** 0.188 0.007 –0.767 –0.613*** –0.680***
 (0.182) (0.166) (0.067) (0.321) (0.125) (0.182)
border –0.477* –0.339** –0.633*** 0.789* –0.673*** –0.476*
 (0.280) (0.149) (0.089) (0.475) (0.186) (0.279)
comlang_off 1.439*** 0.004 1.326*** 1.011*** 0.753*** 1.439***
 (0.235) (0.215) (0.23) (0.284) (0.204) (0.235)
comcol 0.315 1.183*** 1.514*** –0.765 1.250 0.315
 (0.326) (0.229) (0.127) (0.611) (0.272) (0.326)
2020Q1 –1.545*** –3.303*** –2.341*** –3.552*** –2.212*** –1.545***
 (0.569) (0.976) (0.375) (0.710) (0.671) (0.569)
2020Q2 –0.137*** –1.494* –1.244** –3.870*** –2.681*** –2.137***

 23
(0.731) (0.935) (0.516) 0.736 (0.595) (0.731)
 2020Q3 –0.972 –1.762 –1.479*** –5.364*** –5.748*** –0.942
 (0.602) (0.642) (0.431) (0.766) (0.659) (0.602)
 Constant 12.449*** 4.211*** 5.603*** 7.328** 8.158 12.449
 (1.381) (1.374) (0.680) (2.876) (1.243) (0.182)
 Observations 9,030 9,030 9,030 9,030 9,030 9,030
 Adjusted R-squared 0.062 0.017 0.199 0.063 0.083 0.062

PPML = Poisson pseudo-maximum likelihood.
Notes: The robust standard errors are in parentheses; *** significant at 1%, ** significant at 5%, * significant at 10%.
Source: Authors.

 24
Table 3: System GMM Results of a Dynamic Gravity Model
Variables Fruits Medicaments Medical instruments Telephony Semiconductor Electronics
Lag_devar 0.631*** 0.490*** 0.716*** 0.336*** 0.116* 0.181***
 (0.071) (0.064) (0.039) (0.060) (0.062) (0.053)
paxflight –0.030 –0.013 0.046** 0.086*** 0.082*** 0.062**
 (0.029) (0.032) (0.023) (0.028) (0.026) (0.028)
export_GDP 0.243*** 0.261*** 0.312*** 0.122*** 0.306*** 0.263***
 (0.058) (0.044) (0.074) (0.063) (0.067) (0.074)
import_GDP 0.062 0.073*** 0.240*** 0.104*** 0.311*** 0.339***
 (0.044) (0.048) (0.065) (0.060) (0.068) (0.068)
Dist –0.201 –0.177 –0.128 0.087 –0.037 –0.200
 (0.124) (0.139) (0.153) (0.173) (0.118) (0.205)
border –0.488** –0.449 –0.371 0.049 –0.270 –0.244
 (0.231) (0.284) (0.277) (0.331) (0.325) (0.369)
comlang_off 0.213 0.335 1.087*** 0.928** 1.134** 1.573**
 (0.219) (0.278) (0.494) (0.394) (0.554) (0.614)
comcol 0.777** 0.904** 0.735** 0.116 –0.249*** –0.334
 (0.371) (0.376) (0.324) (0.393) (0.308) (0.310)

 25
2020Q1 –0.511** –0.771*** –2.259*** –1.705*** –1.009*** –0.713**
 (0.240) (0.261) (0.500) (0.301) (0.253) (0.300)
 2020Q2 –0.256 –0.537** –1.417*** –1.075*** –0.738*** –0.828***
 (0.223) (0.245) (0.274) (0.254) (0.268) (0.229)
 2020Q3 –0.522*** –0.823*** –1.433*** –1.462*** –1.292*** –1.060***
 (0.169) (0.212) (0.294) (0.228) (0.209) (0.227)
 Constant –1.649 –2.391* –3.343*** –4.285*** –7.288*** –5.596***
 (0.949) (1.267) (1.414) (1.316) (1.385) (1.398)
 Observations 8,820 8,820 8,820 8,820 8,820 8,820

GMM = generalised method of moments.
Notes: The corrected standard errors are in parentheses; *** significant at 1%, ** significant at 5%, * significant at 10%.
Source: Authors.

 26
The passenger flight frequency variable, paxflight, is our primary interest.
The PPML approach (Table 2) shows that passenger flight frequency is positively
associated with all the sectorial exports at the 1% significance level except for the
line telephony or line telegraphy apparatus. This variable is also statistically
significant in the dynamic gravity model (Table 3) for the exports of medical
instruments, telephony, semiconductor, and electronics. As typical international
trade literature using the gravity model does not take air transport connectivity into
account, these findings suggest that this could be a major omission. Zhang, Zhang,
and Wang (2020) found that the frequencies of air flights and high-speed rail
services out of Wuhan, China are significantly associated with the number of
COVID-19 cases in the destination cities in China. However, Chinazzi et al. (2020)
reported that travel restrictions applied to Wuhan only resulted in a slight delay of
epidemic progression by 3–5 days in China, and that international travel restrictions
again only had a moderate effect. The transmission reduction interventions such as
early detection, hand washing, self-isolation, and household quarantine would have
a greater effect in mitigating the pandemic. The merchandise considered here is
essential to consumers and businesses. Some of the products are critical to patients
and health workers fighting COVID-19 on the frontline. Restrictions on
international travel can cause cross-border trade for these products to decline
significantly, as also evidenced by the 2020 quarterly dummies. We can thus argue
that each country should actively seek alternative arrangements to avoid long-term
lockdowns and restore air transport connectivity.

5. Travel Bubbles, Uniform Standards, and Open Skies

 Our analysis in section 4 suggests that the ASEAN+5 countries need to seek
alternative arrangements to avoid long-term lockdowns and restore air
connectivity. These can include establishing travel bubbles amongst countries
where the pandemic has been largely contained, and relaxing travel restrictions for
vaccinated people holding vaccine certificates or immunity passports (e.g. QR
code). These measures may be implemented bilaterally, or within a small number
of countries, at the initial stage and then be gradually extended to include more
countries.

 27
5.1. Analysis of flight bans

 The existence of a travel bubble between two countries is expected to have
significantly less flight bans between each other, compared with countries outside
the bubble; otherwise, the notion of a bubble would be misleading. Therefore, this
section takes the aggregated flight ratio as a baseline for computing the intensity of
a flight ban between two countries. The flight ratio discrepancy (FRD) for time
interval is computed as:

 ℎ 2020( )
 ( ) = 1 − min ( ℎ 2019( ) , 1.0) (3)

and the area under the as ∑ ∈ ( ) where is the set of all time intervals.
Here, the intervals are weeks 1 to 52 in 2019 and 2020. The intuition for the
computation of is as follows: A high value of ( ) suggests a strong
reduction in the number of flights. The value is cut off at 1.0 to avoid introducing
compensation effects, where the number of flights in 2020 is (temporarily) larger
than in those 2019. Finally, the area under the over all is a representation of
how intense the travel bans between two countries were, with larger values
indicating stronger travel bans. Figure 13 further visualises the intuition behind the
chosen measure based on China. The temporal evolution of the FRD is shown for
two selected connections: towards New Zealand and Korea, respectively. It can be
seen that both time series are quite different regarding the relative number of flights
in 2020. While a strict travel ban between China and Korea is observed, the
connection towards New Zealand underwent a temporary travel bubble between
April and July 2020.

 28
Figure 13: Comparison of the Flight Ratio Discrepancy for Two Country
 Pairs: China–New Zealand (left) and China–Republic of Korea (right)

AUC = area under the curve, CHN = China, KOR = Republic of Korea, NZL = New Zealand.
Note: The AUC of the flight ratio over all months is highlighted in red. A larger AUC indicates
stricter implementation of flight bans.
Source: Authors (data from Flightradar24 (n.d.), https://www.flightradar24.com (accessed 25
February 2021); visualisation: Matplotlib).

 Figure 14: Temporal Evolution of Flight Ratio Discrepancy for the ASEAN+5

ASEAN = Association of Southeast Asian Nations, FRD = flight ratio discrepancy, ISO =
International Organization for Standardization.
Notes: Solid blue lines represent the average FRD; shaded areas represent the 95% confidence
interval over all destinations in a country. The countries are labelled by their ISO 3 country codes:
AUS = Australia, BRN = Brunei, CHN = China, IDN = Indonesia, JPN = Japan, KHM =
Cambodia, KOR = Republic of Korea, LAO = Lao People’s Democratic Republic (Lao PDR),
MMR = Myanmar, MYS = Malaysia, NZL = New Zealand, PHL = Philippines, SGP = Singapore,
THA = Thailand, VNM = Viet Nam.
Source: Authors (data from Flightradar24 (n.d.), https://www.flightradar24.com (accessed 25
February 2021); visualisation: Matplotlib).

 29
Figure 14 reports the FRD for all 15 countries in this study. The solid line
represents the evolution of the average FRD value over all destinations of a country
for the specific origin country in a subplot. The blue area is the 95% confidence
interval for the data in that subplot. It can be seen that many countries exhibit FRD
curves with significant variance. For instance, New Zealand tried to reopen air
travel to selected countries on several occasions throughout 2020. The curve for
Myanmar, on the other hand, reveals a very strict travel ban towards all other
countries, after an initial transition period in March 2020.
 To explore this effect further, Figure 15 shows the distribution of the area
under the FRD for each country. The countries are sorted by their median area under
the FRD. It can be seen that China had the strongest median flight ban. Towards
the right-hand side, it can be observed that a few countries kept significantly more
flights active, e.g. Australia, Japan, and New Zealand.

 Figure 15: Deviation of the Area Under the FRD for All ASEAN+5 Countries

ASEAN = Association of Southeast Asian Nations, FRD = flight ratio discrepancy, ISO =
International Organization for Standardization.
Note: The countries are labelled by their ISO 3 country codes: AUS = Australia, BRN = Brunei,
CHN = China, IDN = Indonesia, JPN = Japan, KHM = Cambodia, KOR = Republic of Korea,
LAO = Lao People’s Democratic Republic (Lao PDR), MMR = Myanmar, MYS = Malaysia,
NZL = New Zealand, PHL = Philippines, SGP = Singapore, THA = Thailand, VNM = Viet Nam.
Source: Authors (data from Flightradar24 (n.d.), https://www.flightradar24.com (accessed 25
February 2021); visualisation: Matplotlib).

 Figure 16 reports the area under the FRD curve for each country pair in this
study. A darker cell indicates a smaller area under the FRD, which in turn indicates
a smaller reduction in the number of flights in 2020, with 2019 as a baseline. The
countries are clustered hierarchically based on their aggregated similarity, as

 30
indicated by the tree structures along the left and top axis. This chart allows for
reading off explicitly which countries chose to create a travel bubble with which
neighbours. For instance, New Zealand had a high level of connections with China,
Japan, and Singapore. Korea, on the other hand, kept connections with Australia,
Cambodia, and Indonesia. Viet Nam also kept a high level of connectivity with
Australia and Japan.

 Figure 16: Heat Map and Clustering for Country Pairs in the ASEAN+5

ASEAN = Association of Southeast Asian Nations, ISO = International Organization for
Standardization.
Note: The countries are labelled by their ISO 3 country codes: AUS = Australia, BRN = Brunei,
CHN = China, IDN = Indonesia, JPN = Japan, KHM = Cambodia, KOR = Republic of Korea,
LAO = Lao People’s Democratic Republic (Lao PDR), MMR = Myanmar, MYS = Malaysia,
NZL = New Zealand, PHL = Philippines, SGP = Singapore, THA = Thailand, VNM = Viet Nam.
Source: Authors (data from Flightradar24 (n.d.), https://www.flightradar24.com (accessed 25
February 2021); visualisation: Matplotlib).

 31
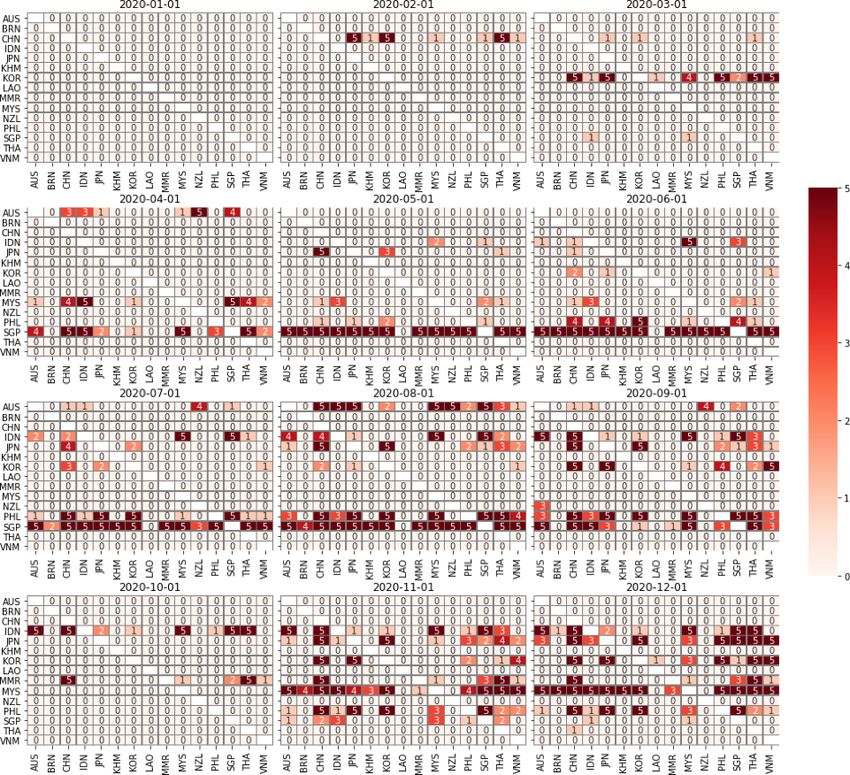
5.2. Towards travel bubbles?

 An eternal lockdown of international aviation is not a feasible solution for
dealing with the pandemic, in terms of the long-term mobility of people and trade
and economic activities. With the ongoing impact of COVID-19 on air
transportation, different future solutions are being discussed. One of these solutions
is the introduction of so-called ‘travel bubbles’: When two countries form a bubble,
it means that air travellers can travel freely between the two countries without
having to quarantine on arrival. For instance, Japan announced plans to create a
travel bubble with five other Asian countries/regions (Cambodia, the Lao PDR,
Malaysia, Myanmar, and Taiwan) in September 2020. New Zealand and Australia
announced, in December 2020, that they would launch a trans-Tasman bubble in
early 2021.
 While there have been talks/plans for some months throughout Asia about
travel bubbles, the pace of actual implementation has been slow compared with
other regions, especially given its overall better performance in handling the
pandemic (in terms of the number of confirmed cases). The region could provide a
multilateral platform with several phases, enabling countries that have contained
the virus to be the first to establish travel bubbles, with others to follow in
subsequent phases. In the following, we discuss one way to construct optimal travel
bubbles, given the air transportation demand and the current case distribution
amongst the ASEAN+5 countries. First, we compute a risk index for each country
pair. This risk index is obtained as:

 Min [100*((1 cases/population)passengers ), 5] (4)

 Intuitively, this risk index expresses the probability that an infected passenger
crosses the border between two countries, assuming simple uniform distributions.
We define a cut-off at risk index 5, which means that the probability of transmission
is at least 5%.12
 Figure 17 reports the values of the risk indexes for all country pairs on the
first days of months in 2020. We take the number of passengers from 2019 to have
a real demand baseline. It can be seen from Figure 17 that there is a transition for
the risk index importance between countries over time. In February 2020, other

12
 Depending on the requirement, we could vary the cut-off values and see the sensitivity with
respect to the construction of travel bubbles.

 32
countries should have closed their borders with China (in particular, Japan, Korea,
and Thailand had a very high risk; note that the actual risk could be greater than 5%).
In March 2020, the focus shifted towards Korea, which was the major COVID-19
hot spot at that time. Towards the end of 2020, the risk indexes become more diverse,
where many pairs of countries would have a high risk if their connectivity returned
to the usual level. This situation gives rise to the construction of travel bubbles
between pairs of countries that have significantly low infection rates or a smaller
number of actual passengers.

 Figure 17: Travel Bubble Risk Indexes for Country Pairs in the ASEAN+5,
 Jan–Dec 2020

ASEAN = Association of Southeast Asian Nations, ISO = International Organization for Standardization.
Notes: Smaller risk indexes (= lighter colours) are an indication for safer travel. The countries are labelled by
their ISO 3 country codes: AUS = Australia, BRN = Brunei, CHN = China, IDN = Indonesia, JPN = Japan,
KHM = Cambodia, KOR = Republic of Korea, LAO = Lao People’s Democratic Republic (Lao PDR),
MMR = Myanmar, MYS = Malaysia, NZL = New Zealand, PHL = Philippines, SGP = Singapore,
THA = Thailand, VNM = Viet Nam.
Source: Authors (data from Flightradar24 (n.d.), https://www.flightradar24.com (accessed 25 February 2021)
and GitHub (n.d.), OWID/COVID-19 data. https://github.com/owid/covid-19-data (accessed 25 February
2021); visualisation: Matplotlib).

 33
You can also read