Creating small but meaningful representations of digital pathology images
←
→
Page content transcription
If your browser does not render page correctly, please read the page content below
Proceedings of Machine Learning Research 156, 2021 MICCAI Computational Pathology (COMPAY) Workshop
Creating small but meaningful representations of digital
pathology images
Corentin Gueréndel corentin.guerendel@live.fr
Hoffmann-La Roche
Basel, Switzerland
Phil Arnold phil.arnold@roche.com
Hoffmann-La Roche
Basel, Switzerland
Ben Torben-Nielsen ben.torben-nielsen@roche.com
Hoffmann-La Roche
Basel, Switzerland
Editors: M. Atzori, N. Burlutskiy, F. Ciompi, Z. Li, F. Minhas, H. Müller, T. Peng, N. Rajpoot,
B. TorbenNielsen, J. van der Laak, M. Veta, Y. Yuan, and I. Zlobec.
Abstract
Representation learning is a popular application of deep learning where an object (e.g.,
an image) is converted into a lower-dimensional representation that still encodes relevant
features of the original object. In digital pathology, however, this is more difficult because
whole slide images (WSIs) are tiled before processing because they are too large to process
at once. As a result, one WSI can be represented by thousands of representations - one for
each tile. Common strategies to aggregate the “tile-level representations” to a “slide-level
representation” rely on pooling operators or even attention networks, which all find some
weighted average of the tile-level representations.
In this work, we propose a novel approach to aggregate tile-level representations into
a single slide-level representation. Our method is based on clustering representations from
individual tiles that originate from a large pool of WSIs. Each cluster can be seen as encod-
ing a specific feature that might occur in a tile. Then, the final slide-level representation is a
function of the proportional cluster membership of all tiles from one WSI. We demonstrate
that we can represent WSIs in parsimonious representations and that these aggregated
slide-level representations allow for both WSI classification and, reversely, similar image
search.
Keywords: Digital pathology, representation learning, classification, similar image search
1. Introduction
Representation learning is a popular application of deep learning where an object (e.g., an
image) is converted into a lower-dimensional representation that still encodes relevant fea-
tures of the original object. This lower dimensional representation (also called embedding)
can then be used in other machine learning tasks as a proxy for the original high-dimensional
object. In digital pathology, the application of representation learning has to overcome an
additional difficulty caused by the sheer size of whole slide images (WSIs). A typical WSI
© PMLR, 2021.MICCAI COMPAY 2021
is so large that it cannot be processed as a whole. As such, WSIs are routinely divided into
thousands of smaller parts, so-called tiles, that have reasonable dimensions ranging from
a few hundred to a few thousand pixels squared. Representation learning is thus applied
to a large number of tiles that constitute the WSI. As many problems in digital pathology
relate to classifying a slide-level label (e.g., contains tumor, staging or presence of some
biomarker), it is important to aggregate all the tile-level representations into a single rep-
resentation of the WSI itself. This is the realm of multiple-instance learning and typical
solutions include straightforward visualization of tile-level prediction and/or majority vot-
ing (Wei et al., 2019; Coudray et al., 2018; Pantanowitz et al., 2020), aggregation operators
such as min/max/average pooling (Courtiol et al., 2018), as well as attention networks
(Tomita et al., 2018; Ilse et al., 2018; Shaban et al., 2020). Both the pooling operators as
well as attention networks are prone to noise in the tile-level representations.
In this work, we propose a novel approach to aggregate the tile-level representations to
create a meaningful slide-level representation. Our approach is based on first generating
tile-level representations for tiles extracted from a large set of WSIs. Then we cluster the
tile representations. Conceptually, each cluster represents a feature found in the tile (and
hence in a WSI). Lastly, for each WSI we calculate the proportion of tiles that lies in any
of the prior created clusters. This final step yields a representation of the WSI in only K
numbers, where K is the number of clusters. We demonstrate that this aggregation works
in conjunction with different deep-learning architectures to generate the initial tile-level
representations. We refer to this final slide-level representation as a barcode for an associ-
ated WSI. The final representation can then be used with conventional machine learning
algorithms to perform slide-level classifications and predictions. Moreover, we demonstrate
that our barcode system can also be used to perform similar image search.
2. Methods
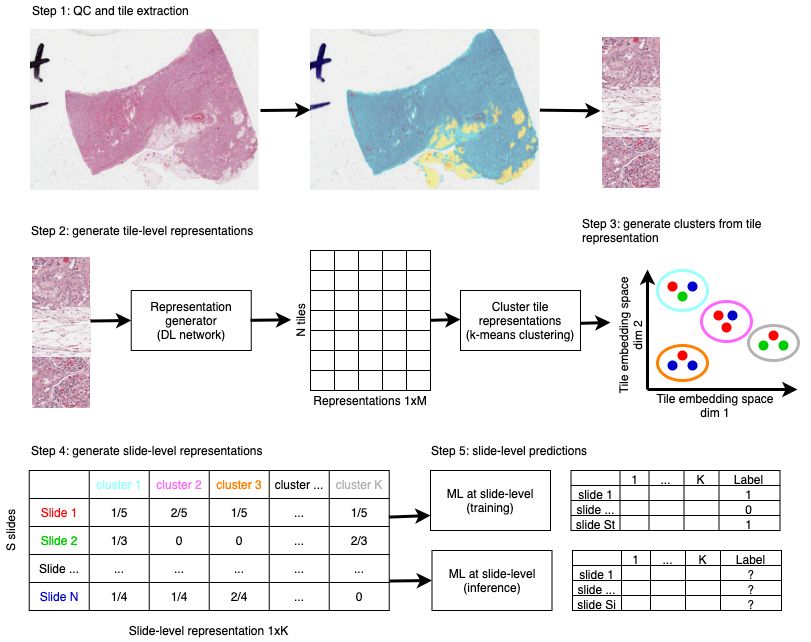
The overall methodology is illustrated in Figure 1. We start by extracting the tiles from
WSIs and cleaning them (i.e., a quality control (QC) step, step 1). Then, we generate
representations for the tiles (step 2) and cluster them using k-means clustering (step 3) to
create clusters for salient features present in the tiles. Based on those clusters, we create
a barcode for each WSI (step 4). Finally, and depending on the application, we train a
classifier that takes the barcode and predicts a slide-level label (step 5). Below, those five
steps are described in more detail and how they are used during training and inference.
2.1 Step 1: QC and tile extraction
While extracting the tiles from WSIs, we clean the data in an additional QC step (Step
1 in Figure 1). Overall, the QC step extracts tiles from the WSIs and then determines
where the tissue is, whether the tile contains only adipose tissue, and whether the tissue
is out-of-focus and/or covered by pen markers. To determine where the tissue is, we use a
standard ResNet18 network, conceptually similar to the method used in Pantanowitz et al.
(2020). We then pass the tiles through two other ResNet18 classifiers that label the tiles as
in-focus (or not) and as pen markers (or not). We only keep tiles that are predicted to be
in focus tissue without pen markers on them. This step is performed both during training
for all WSIs in the training set and during inference for new WSIs.
2MICCAI COMPAY 2021
Figure 1: Schematic of novel approach. Step1: Perform QC to locate regions in the image
that are in-focus and free of pen markers. QC here illustrated with overlays:
blue, yellow and red regions are discarded while tissue under the cyan mask is
used. Extract 224x224 tiles at 20x magnification from the WSI. Step 2: Generate
a representation for each tile. Each tile yields a 1xM representation, where M
depends on the network. For instance, the ResNet18 used in this work generates a
1x512 embedding. An NxM representation is generated from all N tiles extracted
from all S WSIs where each representation is of length M. Step 3: All N tiles are
clustered in K clusters (with k-means clustering in this work). In this schematic,
we have three WSIs that have respectively 5, 4 and 3 tiles. The tiles from those
WSIs are illustrated by a red, blue or green dot. In this schematic, K=4. Step
4: A barcode is generated for each WSI by calculating the proportion of tiles
associated with that WSI that belong to each of the clusters. The rows in the
left table constitute the final slide-level representation. Step 5: the barcodes are
used to train a classifier to predict slide-level labels for the WSIs.
3MICCAI COMPAY 2021
2.2 Step 2: Generate tile-level representations
The next step is to generate tile-level representations (Step 2 in Figure 1). In principle,
any deep learning network that generates a latent variable can be used for this task as
long as the latent representation contains some meaningful information about the tiles.
We have explored two approaches. First, we used a plain vanilla ResNet18 model that
was trained using cross-entropy loss to perform tissue type detection. In this case, every
tile gets the slide-level label during training. We used this approach, rather than more
basic auto-encoders to ensure that meaningful features related to tissue-type classification
are captured by the tile-level representation. This first approach is fully supervised. In a
second approach, we used the recently proposed self-supervised “Bootstrap your own latent”
(BYOL) method from Grill et al. (2020). BYOL uses a contrastive-loss with momentum
to create representations. We used this approach to demonstrate that our clustering-based
aggregation method works as long as the tile-level representations capture some meaningful
features from the tiles. The step to generate tile-level representations has to be performed
both during training and inference.
2.3 Step 3 and 4: Aggregating tile-level to slide-level representation
The true novelty of our approach lies in the way we aggregate the many tile-level represen-
tations associated with a single WSI into a single, parsimonious slide-level representation
(Step 3 and 4 in Figure 1). In this step, we take all tile-level representations and cluster
them using k-means clustering. Conceptually, each cluster contains a salient feature found
in the collection of tiles. The k-means model only needs to be created once during training.
Once the clustering is done, we generate the final slide-level representation by checking the
proportion of tiles from a WSI that belong to each of the clusters (Step 4 in Figure 1). This
step yields one ultra-parsimonious 1 × K representation for each WSI. This step needs to
be performed during training and inference.
2.4 Step 5: Slide-level predictions
In the final step, we use the slide-level representations as a proxy for the WSI or its tiles
and train a classifier to make predictions solely based on the 1 × K representation. (Step
5 in Figure 1). In this work we used off-the-shelf XGBoost (Chen and Guestrin, 2016) to
perform the classification.
We note that the slide-level representations are generic and are generated independent
of the downstream classification tasks. Once we have calculated the representation for a
given WSI, it can be used in different tasks without the need to perform any of the prior 4
steps.
3. Experiments
3.1 Data
To demonstrate the capabilities of our novel approach, we only used publicly available data
obtained from The Cancer Genome Atlas (TCGA). We used TCGA data from 10 different
tissues (’Bladder’, ’Brain’, ’Breast’, ’Bronchus and lung’, ’Connective, subcutaneous and
4MICCAI COMPAY 2021
other soft tissues’, ’Kidney’, ’Liver and intrahepatic bile ducts’, ’Pancreas’, ’Prostate gland’,
’Thyroid gland’). We limited ourselves to the diagnostic slides prepared via formaldehyde
fixation and paraffin embedding (FFPE) as they are generally of higher quality compared
to fast-frozen (FF) slides. In total, this yielded 5768 WSIs. Training and test sets are
stratified on the slide-level to avoid having tiles from one WSI in both training and test
sets. Unless reported otherwise, we used 50 WSIs for each tissue type for testing, while the
other WSIs were used for training.
First, we run our in-house artefact detection algorithm so we can exclude extracting tiles
from the background, out-of-focus areas or areas covered by pen markers (See Step 1 in the
Methods). We extracted 224x224 tiles at 5x and 20x magnification to test our approach at
both levels of magnification. To create our final test set at 5x magnification, we randomly
sampled 500 tiles from 50 randomly selected WSIs. The final training set comprised all
other WSIs where the exact number of WSIs depended on the availability on TCGA (e.g.,
we used 1054 FFPE breast WSIs but only 124 FFPE WSIs of connective tissue). In case a
WSI yielded less than 500 tiles, we used all tiles for that WSI.
To create the final test set at 20x, we randomly sampled 1000 tiles (when available)
from 35 randomly selected WSIs. The training set was made up by randomly sampling
1000 tiles (or all tiles when fewer tiles were available) from 300 randomly selected WSIs
(or the maximum number of available WSIs when fewer WSIs were available). We picked
less WSIs at 20x for computational reasons. For both 5x and 20x, random subsampling of
the tiles did not appear to be detrimental for the performance of downstream models (not
shown).
3.2 Tissue type classification
In this work we focus on the task of tissue-type classification, which is good for benchmarking
the novel approach. In this task the algorithm has to predict the tissue type. We performed
several experiments.
As a benchmark, we use a plain vanilla ResNet18 with cross-entropy loss to perform
tile-level prediction. The tile-level prediction accuracy is 0.79 and 0.76 for 5x and 20x,
respectively. F1 scores are identical because the test set is balanced with 50 WSIs for each
tissue type. In this benchmark, the final slide-level prediction is calculated by majority
voting and yields an accuracy of 0.92 and 0.89 for 5x and 20x, respectively. The slide-level
accuracy is always better as noise in the tile-level predictions is leveled out by taking the
majority vote.
To test our novel approach we used the aforementioned optimized ResNet18 network to
generate tile-level representations. These tile-level representations were then passed through
the pipeline to generate slide-level representations (Figure 1, Steps 3 and 4). Subsequently,
we trained a classifier with XGBoost (Chen et al 2016) to predict the tissue types. Both
the k-means clustering as well as the XGBoost classifier were trained solely on the training
data. To investigate the influence of K, we first assessed the performance on the training set
by varying K. For each K in [25, 50, 100, 150, 200, 250] we performed 5-fold cross-validation.
From Figure 2, we can see that the performance is better compared to the benchmark across
a wide range of K. For 5x data, even small K yield good results, while good performance
5MICCAI COMPAY 2021
Figure 2: Performance in the tissue type classification task using the novel slide-level repre-
sentations as a function of the number of clusters (K). Performance using 5x data
is high across a range of K. For 20x data K >= 150 yields the best results because
at 20x the representations contain more numerous microscopic features compared
to the macroscopic features captured at 5x magnification. The performance was
assessed on the training set as that set allowed for 5-fold cross-validation. The
error bars indicate the standard deviation for the different folds.
with 20x data is only obtained for K ≥ 150. We assessed the influence of K on the training
set as the test set is too small to perform a reliable 5-fold cross validation.
Next, we did the final assessment on the complete test set with K=150 where we achieved
an F1 score of 0.91 and 0.86 for 5x and 20x data, respectively. As such, despite the enormous
compression of the data (i.e., a WSI is summarized into a 1x150 vector), the F1 score is
just marginally lower than the F1 score of the benchmark. This result validates our novel
approach and demonstrates that our clustering-based aggregation method can capture (the)
important features in a WSI.
To demonstrate that our method can extract and capture relevant features from any
tile-level representations, we also used a ResNet18 network that was optimized using the self-
supervised BYOL method. Note that this network was trained on different in-house, non-
TCGA datasets originating from clinical trials. We generated the tile-level representations
and aggregated the results with our clustering-based approach. Finally, we trained another
XGBoost classifier and achieved a performance of 0.68 on our test set. Random guessing the
tissue type yields an accuracy of 0.1 so even this network still performs reasonably well and
validates that our approach can capture relevant features that are present in the tile-level
embeddings (and see the Discussion).
3.3 Prediction of primary diagnosis
To demonstrate the generalizability of the clustering-based slide-level representations, we
also performed another task, namely that of primary diagnosis prediction. For this task, we
selected all brain WSIs we had in our TCGA dataset and predicted the tumor stage: lower-
grade glioma (LGM) or glioblastoma (GBM). For this experiment, we used the slide-level
representations generated earlier with the plain vanilla ResNet18 and the BYOL optimized
ResNet18; both based on 20x tiles. We only optimized the classifier in Step 5 to predict
6MICCAI COMPAY 2021
LGM or GBM. With both initial networks to generate the tile-level representations, we
achieved good accuracies of ∼ 0.8 and ∼ 0.85 depending on K, for BYOL and plain vanilla
Resnet18, respectively (Figure 3). This validates that our slide-level representations capture
information relevant for generic tasks in digital pathology.
Figure 3: Performance in the primary diagnosis classification task using the novel slide-level
representations as a function of the number of clusters (K). Both networks achieve
similar F1 scores indicating that both capture generic relevant features that can
be used for different tasks. The error bars represent the standard deviation in
the 5-fold cross-validation.
3.4 Similar image search
Finally, we investigated whether our slide-level representations can be used in similar image
search. In this experiment, we present one slide-level representation (i.e., the prototype)
and then determine the nearest L neighbors in the K-dimensional representation space (with
K=150). We used the full test set with 50 WSIs for each of the 10 tissue types and expect
the nearest neighbors to be of the same tissue type as the prototype. This can be quantified
by measuring the hit rate and the number of correct retrievals as a function of the number
of nearest retrieved neighbors. The hit-rate starts off at 0.83 and converges to ∼ 0.95 with
9 retrieved WSIs (Figure 4, left). The hit rate only shows the probability of hitting at least
one WSI of the same type. The number of correct retrievals are illustrated in Figure 4
(right) and shows the same trend: most of the retrieved nearest neighbors are in fact of
the same type. These results show that our slide-level representations can also be used for
rudimentary similar images search.
3.5 Conclusion and discussion
We described a novel approach to generate slide-level representations for use in digital
pathology. Rather than having to deal with thousands of representations associated with
tiles extracted from a WSI, we aggregate those tile-level representations into meaningful
slide-level representations. Due to the clustering of a large number of tile-level representa-
tions, we can produce extremely parsimonious representations of size 1 × K, where K can be
as low as 100 (Figure 2 and 3) while still capturing generic WSI characteristics. Our results
7MICCAI COMPAY 2021
Figure 4: Similar image search based on the novel slide-level representations. Left: the
probability of retrieving N nearest neighbors and having at least one of the same
tissue type (the “hit rate”). Right: The number of correct retrieved images as a
function of retrieved images.
indicate that with those representations we can successfully perform tissue type type classi-
fication as well as primary diagnosis classification on the basis of the same representations.
We also expect that our approach can help open the black box of machine learning to
some extent: conceptually, the clusters capture one (group) of spatial features that can be
present in a WSI. As such, with low numbers of clusters, we can investigate what feature
is present. Moreover, in combination with basic classifiers such as decision trees or logistic
regression, we speculate that these models can indicate which features are related to slide-
level labels. For instance, a WSI with a high proportion of tiles in a cluster representing
adipose tissue can be related to breast. Similarly, a WSI with any tiles that fit in a cluster
representing colloid would indicate thyroid tissue.
Generating slide-level representations associated with a certain magnification level pro-
vides a different view of the same WSI: at 5x magnification the features are of macroscopic
nature while at 20x (or higher) the features represent microscopic features. Due to the
extremely small size of the final embeddings, in the future we aim to combine (e.g., concate-
nate) slide-level representations at different magnifications to further improve classification
tasks (He et al., 2015).
4. Acknowledgements
The results shown here are in part based upon data generated by the TCGA Research
Network: https://www.cancer.gov/tcga.
5. Competing interests
The authors declare the following competing interests: P.A. and B.T-N. are employees of
Roche and C.G. was employed by Roche at the time of this work.
8MICCAI COMPAY 2021
References
Tianqi Chen and Carlos Guestrin. XGBoost: A Scalable Tree Boosting System. In Proceed-
ings of the 22nd ACM SIGKDD International Conference on Knowledge Discovery and
Data Mining, KDD ’16, pages 785–794, New York, NY, USA, August 2016. Association
for Computing Machinery. ISBN 978-1-4503-4232-2. doi: 10.1145/2939672.2939785. URL
https://doi.org/10.1145/2939672.2939785.
Nicolas Coudray, Paolo Santiago Ocampo, Theodore Sakellaropoulos, Navneet Narula,
Matija Snuderl, David Fenyö, Andre L. Moreira, Narges Razavian, and Aristotelis Tsiri-
gos. Classification and mutation prediction from non–small cell lung cancer histopathol-
ogy images using deep learning. Nature Medicine, 24(10):1559, October 2018. ISSN 1546-
170X. doi: 10.1038/s41591-018-0177-5. URL https://www.nature.com/articles/
s41591-018-0177-5.
Pierre Courtiol, Eric W. Tramel, Marc Sanselme, and Gilles Wainrib. Classification and
Disease Localization in Histopathology Using Only Global Labels: A Weakly-Supervised
Approach. arXiv:1802.02212 [cs, stat], February 2018. doi: Courtiol2018. URL http:
//arxiv.org/abs/1802.02212. arXiv: 1802.02212.
Jean-Bastien Grill, Florian Strub, Florent Altché, Corentin Tallec, Pierre H. Richemond,
Elena Buchatskaya, Carl Doersch, Bernardo Avila Pires, Zhaohan Daniel Guo, Mo-
hammad Gheshlaghi Azar, Bilal Piot, Koray Kavukcuoglu, Rémi Munos, and Michal
Valko. Bootstrap your own latent: A new approach to self-supervised Learning.
arXiv:2006.07733 [cs, stat], September 2020. doi: Grill2020. URL http://arxiv.org/
abs/2006.07733. arXiv: 2006.07733.
Kaiming He, Xiangyu Zhang, Shaoqing Ren, and Jian Sun. Deep Residual Learning for
Image Recognition. arXiv:1512.03385 [cs], December 2015. URL http://arxiv.org/
abs/1512.03385. arXiv: 1512.03385.
Maximilian Ilse, Jakub M. Tomczak, and Max Welling. Attention-based Deep Multiple
Instance Learning. arXiv:1802.04712 [cs, stat], February 2018. doi: Ilse2018. URL
http://arxiv.org/abs/1802.04712. arXiv: 1802.04712.
Liron Pantanowitz, Gabriela M. Quiroga-Garza, Lilach Bien, Ronen Heled, Daphna
Laifenfeld, Chaim Linhart, Judith Sandbank, Anat Albrecht Shach, Varda Shalev,
Manuela Vecsler, Pamela Michelow, Scott Hazelhurst, and Rajiv Dhir. An arti-
ficial intelligence algorithm for prostate cancer diagnosis in whole slide images of
core needle biopsies: a blinded clinical validation and deployment study. The
Lancet Digital Health, 2(8):e407–e416, August 2020. ISSN 2589-7500. doi: 10.
1016/S2589-7500(20)30159-X. URL https://www.thelancet.com/journals/landig/
article/PIIS2589-7500(20)30159-X/abstract. Publisher: Elsevier.
Muhammad Shaban, Ruqayya Awan, Muhammad Moazam Fraz, Ayesha Azam, Yee-Wah
Tsang, David Snead, and Nasir M. Rajpoot. Context-Aware Convolutional Neural Net-
work for Grading of Colorectal Cancer Histology Images. IEEE Transactions on Medical
Imaging, pages 1–1, 2020. ISSN 1558-254X. doi: 10.1109/TMI.2020.2971006.
9MICCAI COMPAY 2021
Yash Sharma, Aman Shrivastava, Lubaina Ehsan, Christopher A. Moskaluk, Sana Syed,
and Donald E. Brown. Cluster-to-Conquer: A Framework for End-to-End Multi-Instance
Learning for Whole Slide Image Classification. arXiv:2103.10626 [cs, eess], June 2021.
URL http://arxiv.org/abs/2103.10626. arXiv: 2103.10626.
Naofumi Tomita, Behnaz Abdollahi, Jason Wei, Bing Ren, Arief Suriawinata, and Saeed
Hassanpour. Finding a Needle in the Haystack: Attention-Based Classification of High
Resolution Microscopy Images. arXiv:1811.08513 [cs], November 2018. URL http:
//arxiv.org/abs/1811.08513. arXiv: 1811.08513.
Jason W. Wei, Laura J. Tafe, Yevgeniy A. Linnik, Louis J. Vaickus, Naofumi Tomita, and
Saeed Hassanpour. Pathologist-level classification of histologic patterns on resected lung
adenocarcinoma slides with deep neural networks. Scientific Reports, 9(1):3358, March
2019. ISSN 2045-2322. doi: 10.1038/s41598-019-40041-7. URL https://www.nature.
com/articles/s41598-019-40041-7.
10You can also read