Land Use and Land cover for one Decade in Coimbatore Dist Using Historical and Recent High Resolution Satellite Data
←
→
Page content transcription
If your browser does not render page correctly, please read the page content below
International Journal of Scientific & Engineering Research, Volume 3, Issue 2, February -2012 1
ISS N 2229-5518
Land Use and Land cover for one Decade in
Coimbatore Dist Using Historical and Recent
High Resolution Satellite Data
M.Renuka Devi, Lt.Dr.S.Santhosh Baboo
Abstract--The awareness of landuse / land cover assessment is very important to understanding natural resources, their utilization,
conservation and management. In recent years remote sensing and Geographical Information System have gained importance as vit al tools
in the analysis of temporal data at the district and citylevel. The present study evaluates the effectiveness of high-resolution satellite data and
computer aided GIS techniques in assessing landuse / land cover change detection for the period 1990 to 2000 within the study area,
Coimbatore District. This paper describes assessment of the land use and land cover changes in the Coimbatore District for one decay. IRS
IC images of 1990 and 2000 w ere analyzed using Erdas Imagine software and ArcGIS. A total of five broad landuse and land cover classes
were identif ied. These were crop land ,Barren land,forest , water bodies and built up land. This study identif ied population growth, built up
land and lack of proper education as causes of the changes in land use and land cover in the Coimbatore area.
Keywords: land cover change, land use change, IRS IC, remote sensing and Geographical Information System
—————————— ——————————
INTRODUCTION
The recent availability of high-resolution satellite imagery
has led to increased interest in the use of satellite data for An accurate knowledge of land use and land cover
large scale mapping applications and detailed land use features represents the foundation for land classification
assessments. This growing interest not only emanates and management. Therefore a wide range of scientists
from the fact that satellites provide a synoptic coverage, and practitioners, including earth systems scientists, land
have a high repetitive cycle, and carry multispectral band and water managers as well as urban planners seek
sensors that provide information beyond the ordinary information on the location, distribution, type and
ability of the human eye, but also because they offer a magnitude of land use and land cover change.
costeffective source of data that enables timely detection Vegetation changes are often the result of anthropogenic
of changes to the landuse and landcover, the monitoring pressure (e.g. population growth) and natural factors
and mapping of urban development, assessment of such as variability in climate. Due to increasing
deforestation extents, evaluation of post fire vegetation population growth rates, there have been increasing rates
recovery, the revision of topographic maps among of conversion of forest and built up land in developing
numerous other environmental assessments. economies all over the world. The degradation of forest
Land use and land cover information are important for have impact on catchment processes and biochemical
several planning and management activities concerned cycles and leads to soil erosion and water shortage not
with the surface of the earth because it constitutes key only in the regions immediately affected by deforestation,
environmental information for many scientific, resource but also in reasonably distant areas .This means that
management and policy purposes, as well as for a range problems posed by land use and land cover change are
of human activities. numerous and have serious consequences.
Therefore, the spatial dimensions of land use and land
1 M.Renuka Devi,Ph.D Pa rt Time Research Scholor cover needs to be known at all times so that policy -
Bha ra thia r University,Coimbatore. makers and scientists will be amply equipped to take
Assista nt Professor in MCA Depa rtment decisions. The most important thing is the changing
Sree Sa ra swa thi Thayaga raja College,Pollachi
Email-renuga.srk@gmail.com, 94875 90190
pattern of land use and land cover reflect changing
economic and social conditions.
1 Lt.Dr.S.Sa nthoshBa boo, Reader, Postgraduate and
Resea rch depa rtment of Computer Science, 2. STUDY AREA
Dwa raka Doss Goverdhan Doss Vaishnav College, Chennai.
Email- santhosh2001@sify.com
IJSER © 2012
http://www.ijser.org
International Journal of Scientific & Engineering Research, Volume 3, Issue 2, February -2012 2
ISS N 2229-5518
Coimbatore, District is situated on the banks of river drainage which were already digitized in that format.
Noyyal between 11° 00' of north latitude and 77° 00' of Then the digitized map showing the roads, towns,
East longitude. The total area of Coimbatore district is 254 drainage and the outline of the reservoir was overlaid on
square km. Coimbatore is located at an elevation of about the georeferenced image. Band combination of red, blue
398 meters. The mean maximum and minimum and green was used to display the raw images in
temperatures during summer and winter varies between standard colour composites. The spectral band
35°C to 18°C. Highest temperature ever recorded is 41 °C combination for displaying images often varies with
and lowest is 12 °C. Coimbatore is situated in the extreme different applications (Trotter, 1998). This was necessary
west of Tamil Nadu, near the state of Kerala. It is for the visual interpretation of the images. A band
surrounded by mountains on the west, with reserve combination of red, blue and green (RGB) is often used to
forests and the (Nilgiri Biosphere Reserve) on the display images in standard colour composites for land
northern side. The eastern side of the district, including use and vegetation mapping (Trotter, 1998). In this study,
the city is predominantly dry. The entire western and the IRS IA 2000 images were displayed in a band
northern part of the district borders the Western Ghats combination of 3,2 and 1 (red, blue and green), which is
with the Nilgiri biosphere as well as the Anaimalai and standard for visual interpretation of land use and land
Munnar ranges. It is the third largest district of Tamil cover mapping in the tropics (Prakash and Gupta 1998;
Nadu. This district is known as the Manchester of South Trotter, 1998).The 1990 imagery is visually interperted by
India and is known for its textile factories, engineering using ArcGIS (Version 9.1)
firms, automobile parts manufacturers, health care 4.1 Land Cover Cla ssification
facilities, educational institutions, and hospitality The supervised classification method was used to classify
industries. The hill stations of Ooty, Coonnor and the images into the various land cover categories. The
Valparai are close to the city making it a good tourist maximumlikelyhood supervised classification method is
attraction throughout the year. The district is situated on applied for grouping the pixel in IRS IC 2000 imagery. .
the banks of the Noyyal River and is close to the Siruvani The selection of appropriate training areas is based on the
Waterfalls. This district contains four main reservoir that analyst's familiarity with the geographical area and their
is Aliar,Thirumurthi ,Amaravathi and Solaiar. knowledge of the actual surface cover types present in
the image. Thus, the analyst "supervises" the
3. DAT A AND IM AGERY USED categorization of a set of specific classes. The numerical
information in all spectral bands for the pixels
IRS IC and IRS IA imageries were collected from Water comprising these areas are used to "train" the computer to
Research Institution,Tharamani, Chennai.Topo Sheet 58 recognize spectrally similar areas for each class.
A,58E,58B and 58 F were collected from Survey of Training Pixels
Training fields are areas of known identity
India,Map Sales office, Chennai.
delineated on the digital image, usually by specifying the
corner points of a rectangular or polygonal area using
4. IM AGE PROCESSING line and column numbers within the coordinate system of
the digital image. The analyst must, of course, know the
IRS IC images of scene of year 1990 and 2000 correct class for each area. Usually the analyst begins by
showing the roads, towns, and drainage systems were assembling maps and aerial photographs of the area to be
used for the study. Remote sensing softwares: Erdas classified. Specific training areas are identified for each
Imagine version 9.2 and ArcGIS version 9.2 were used for informational category following the guidelines outlined
the processing of the images. The raw satellite image was below. The objective is to identify a set of pixels that
converted from Tag Image file format (Tiff) to img format accurately represents spectral variation present within
using Erdas in order to be compatible with other Erdas each information region (Fig. 1a,1b).
Imagine files. The layers were stacked and sub-set to
delineate the catchment area for classification. The UTM Training area process is called signature creation
Zone 30N Coordinate on the WGS 84 was used to is shown in the following figure5a,5b. In the figure some
geocode the imported image. This was followed by of the classes like cropland, water body, barren land and
georeferencing using the Traverse Mercator projection hills were chosen as training area. In this process the red
with reference units in meters to allow compatible pixels are trained as cropland, block pixels are trained as
positioning of other themes such as roads, towns and water body or tank, the ash green pixels are trained as
IJSER © 2012
http://www.ijser.org
International Journal of Scientific & Engineering Research, Volume 3, Issue 2, February -2012                                      3
ISS N 2229-5518

barren land and dark gray pixels selected as Hills                           compared. Then the directions of the changes in each
continue this process according to our classification                        land cover type 1990 and 2000 were determined.
scheme.
                                                                             5.RESULT DISCUSSION
                                                                             5.1 Re sults of land cover classifi cation
                                                                             There are totally seven categories were identified and
             Cropland                  Waterbody                             classified in this study. They are water body, forest,
                                                                             settlement, cropland, barren land, fallow land and others
                                                                             (doesn’t include above categories). The classification of
                                                                             these categories were shown in the Figure 2

 Figure 1a .Training the red pixels as cropland and block texture as
                              waterbody

             Barren Land                      Hills

       Figure 1b. Training the pixel as Barren Land and Hills

The statistics of the various classes were generated using
the Erdas Imagine programme.Finally maps were
composed, using programme and the maps were
validated in the field to assess its accuracy. This was
conducted through field visit to define how closely the
classification agrees with the actual field situation. It                         Figure 2.Land Cover Classif ication 1990 and 2000 Imageries
involved the selection of samples of identified locations
on the map, which were then checked in the field.
4.2 Change Detection                                                         5.2. Land cover changes for one decay
There are lots methods are available to find out the                         Table 1 shows the changes in the various land use and
change detection in land. The most frequently used land                      land cover categories (in sq.km and percentages) during
change detection methods includes i) image overlay ii)                       the periods between 1990 to 2000.In the table (+) denotes
classification comparisons of land cover statist ics iii)                    that the percentage increased and (-) denotes that the
change vector analysis iv) principal component analysis                      percentage decreased.
and v) image rationing and vi) the differencing of                                                   TABLE 1.
normalized difference vegetation index (NDVI) (Duadze,
                                                                             LAND COVER CHANGES IN THE PERIOD OF 1990 TO
2004). This research used classification comparison of                                         2000
land cover statistics. This method was adopted because
the study to find out the changes in the areas of the
various land cover categories. Using the post-
classification procedure, the area statistic for each of the
land cover classes was derived from the classifications of
the images for each date (1990 and 2000) separately, using
functions in the Erdas Imagine software. The areas
covered by each land cover type for the one decay were
                                                                   IJSER © 2012
                                                                http://www.ijser.org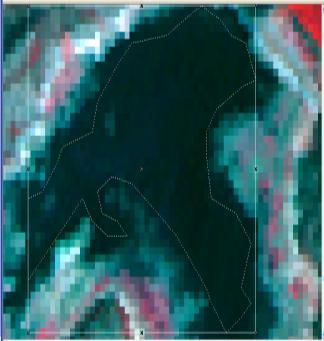
International Journal of Scientific & Engineering Research, Volume 3, Issue 2, February -2012                                          4
ISS N 2229-5518

Classificatio     LANDUSE        LANDU       CHANGE DURING
n                   1990         SE 2000     1990-2000
                   Sq.km          Sq.km      Sq.m      Percenta
                                                       ge%
Waterbodies       1618.130       1573.68     44.450    0.51(-)
Settlement        112.161        633.02      520.859   5.94(+)
Forest            1370.413       1522.02     151.607   1.73(+)
Crop Land         912.531        1141.09     228.559   2.61(+)
Barren Land       4563.534       2346.77     2216.764  25.29(-)
Fallow Land       163.38         533.75      370.370   4.22(+)
Others            26.334         1016.15     989.816   11.29(+)
   Total           8766.483      8766.48

5.3. Causes of the land cover changes
In the period of one decay settlement was increased up to
12% this proves the population growth. Population
growth is the basic factor for environmental change,
                                                                               Figure 4. Show ing Changes betw een Settlement between 1990 to
because this is key factor for all development especially                                                  2000
in developing countries like India. In the below figure 3
we can see the changes in settlement in 2000. Fortunately                     In the figure 4 compare with left side imagery with right
the percentage of water body was only 1% decreased. In                        imagery settlement(sky blue texture) ,cropland( Red
the total area 8766.483 sq.km 3% of forest was increased.                     color)and waterbodies(Block color) were increased in the
The percentage of fallow land was increased and barren                        one decay.
land was decreased. Mainly the cropland was increased
upto 5%. This is shown in the figure 3.
                                                                              6.CONCLUSIONS

                 Change Detection for one Decay                               In the analysis of IRS IC Images 1990 and 2000 exposed
                                               Waterbodies                    that land use and land cover of Coimbatore settlement
                                                    Settlement                has changed over the one decay. Seven classes of land use
                        0.51 5.94
                11.29          1.73                 Forest                    and land cover were identified and mapped using above
                                2.61                Crop Land                 imagery.        The        used      classes         were
                4.22                                Barren Land               waterbodies,forest,settlement,crop     land        fallow
                                                    Fallow Land               land,barren land others.generally if settlement was
                             25.29                                            increased then growth of population will increase. This is
                                                    Others
                                                                              proved by increment in the Coimbatore settlement.
                                                    Total
                                                                              Therefore based on the population growth the land use
           Figure 3.Change Detection Chart for one Decay                      and land cover trend is changed.But only few percentage
                                                                              of water was decreased.

                                                                              REFERENCES
                                                                               [1] Bernard, A. C., Wilkinson, G. G. and Kanellopoulos, I., 1997.
                                                                              Training strategies for neural network soft classification of remotely
                                                                              sensed imagery.int.j.remote sensing, 1997, Vol.18, 1851 -1856.
                                                                              [2] BWEP,2005.Barekese Water Expansion Project. Draft Report
                                                                              (version), 9R3818.A0/R/ACT/Nijm,14 Sept.2005.
                                                                              [3] Cheng, G.W., 1999. Forest change: hydrological effects in the
                                                                              upper Yangtze river valley. Ambio 28, 457–459.
                                                                              [4] Costa, M. H., Botta, A. and Cardille, J. A., 2003. Effects of Large -
                                                                              Scale Changes in Land Cover and Climate Variability in the
                                                                              Discharge of the Tocantins River, American Geophysical Union, Fall
                                                                              Meeting 2002, abstract #B22C-0765

                                                                    IJSER © 2012
                                                                 http://www.ijser.org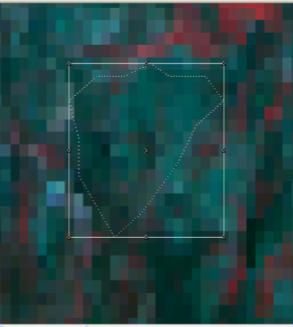
International Journal of Scientific & Engineering Research, Volume 3, Issue 2, February -2012                                5
ISS N 2229-5518

[5] Congalton, R. G., 1991. A review of assessing the accuracy of              BIBLIOGRAPHY
c lassific ations of remotely sensed data. Remote Sensing of
Environment, 37, 35-46                                                         Mrs. M.Renuka Devi , has nearly 10 years of post
[6] Dai, X. and Khoraran, S ., 1998. A hierachical
methodologyframework for multisource data fusion in vegetation
                                                                                                   graduate teaching experience in
c lassific ation.int.j.remote sensing,1998, Vol.19, no.18, 3697 -3701                              Computer      Science.    She    has
[7] Damizadeh, M., S aghafian, B. and Greske, A., 2000. S tudying                                  indulged in training the post
vegetation responses and rainfall relationship based on NOAA-                                      graduate students to complete real
AVHRR images                                                                                       time projects and also guides
[8] DeFries, R. and Belward, A. S ., 2000. Global and regional land
                                                                                                   research scholars in Computer
cover c harac terization from satellite data; an introduction to the
S pec ial Issue .int.j.remote sensing, 2000, vol.21, no. 6&7, 1083-1092.                           Science. Currently she is working as
[9] De Moraes, J. F. L., Seyler, F., Cerri, C. C. and Volkoff, B., 1998.       Asst.Prof in the Department of MCA at Sree Saraswathi
Land cover mapping and carbon pools estimstes in Rondonia,                     Thyagaraja College (Autonomous),and An ISO 9001
Brazil.int.j.remote sensing, 1998, Vol.19, no. 5, 921-934                      Certified / NAAC Accredited Institution,        Pollachi,
[10] ERDAS. 1999. Field guide. Fifth edition. ERDAS Inc. Buford
                                                                               Coimbatore (Dt), Tamil Nadu,India.
Highwas, NE, Atlanta, Georgia. USA, 75(8), 2430-2437.
[11] Duadze S.E.K. 2004. Land-use and land-cover study of the
S avannah ecosystem in the Upper West region (Ghana) using                     Lt.Dr.S.Santhosh Baboo, has around Seventeen years of
remote sensing. ZEF Bonn, University of Bonn, Germany FAO.                     postgraduate teaching experience in Computer Science,
1999. Agrostat.http/www.FAO.org                                                which includes Six years of administrative experience. He
[14] Guerra, F., Puig, H. and Chaune, R., 1998. The forest-savannah            is a member, board of studies, in several autonomous
dynamic s from multi-data LANDSAT-TM data in S ierra Parima,
                                                                               colleges, and designs the curriculum of undergraduate
Venezuela.int.j.remote sensing, 1998, Vol.19, no.11, 2061-2075
[15] Helmer, E. H., Brown, S. and Cohen, W. B. 2000. Mapping                   and postgraduate programmes. He is a consultant for
Montane tropic al forest succession stage and land use with multi -            starting new courses, setting up computer labs, and
dae LANDSAT imagery.int.j.remote sensing, 2000, Vol. 21, no. 11,               recruiting lecturers for many colleges. Equipped with a
2163-2183                                                                      Masters degree in Computer Science and a Doctorate in
[16] Hill, R. A. 1999. Image segmentation for humid tropical forest
                                                                               Computer Science, he is a visiting faculty to IT
c lassific ation in LANDSAT TM data.int.j.remote sensing, 1999, Vol.
20, no. 5, 1039-1044                                                           companies. It is customary to see him at several
[17] Houghton, R. A., 1995. Land-use changes and the carbon cycle.             national/international     conferences     and     training
Global Change Biology. 1, 275-287                                              programmes, both as a participant and as a resource
[18] IGBP-IHDP, 1999. Land use and land cover change                           person. He has been keenly involved in organizing
implementation strategy. IGBP Report 48 and IHS P Report 10. IGBP
                                                                               training programmes for students and faculty members.
Sec retariat, S toc kholm, Sweden. Pp287
[19] Janetos, A. C. and Justice, C. O., 2000. Land cover global
                                                                               His good rapport with the IT companies has been
produc tivity: a measurement strategy                  for the NASA            instrumental in on/off campus interviews, and has helped
programme.int.j.remote sensing, 2000, Vol.21, no.6&7, 1491-1512                the post graduate students to get real time projects. He
[20] Lilesand, T. M. and Keifer, R. W., 1994. Remote sensing and               has also guided many such live projects. Lt.Dr. Santhosh
Image Interpretation. John Wiley and sons. Pp750Mas, J. F., 1999.
                                                                               Baboo has authored a commendable number of research
Monitoring land c over c hanges; a comparison of change detection
tec hniques .int. j. remote sensing, 1999, vol. 20, no. 1, 139 -152
                                                                                                  papers     in     international/national
[21] Miller,A.B., Bryant,E.S . and Birnie, R. W.,1998. An analysis of                             Conference/journals and also guides
land cover c hanges in the Northern Forest of New England using                                   research scholars in Computer Science.
multitemporal LANDSAT MSS data. int.j.remote sensing, 1998, Vol.                                  Currently he is Reader in the
19, no. 2, 215-265                                                                                Postgraduate and Research department
[22] NPs/NBS Vegetation Mapping, 2002. USGS -Vegetation
                                                                                                  of Computer Science at Dwaraka Doss
Mapping Program. http:// biology.usgs.gov/nps/aa/sect1.html
[23] E. Boakye, S . N. Odai, K. A. Adjei, F. O. Annor. Landsat Images                             Goverdhan Doss Vaishnav College
for Assessment of the Impact of Land Use and Land Cover Changes                                   (accredited at ‘A’ grade by NAAC),
on the Barekese Catc hment in Ghana, European Journal of Scientific            one of the premier institutions in Chennai.
Researc h ISS N 1450-216X Vol.22 No.2 (2008), pp.269-278

                                                                     IJSER © 2012
                                                                  http://www.ijser.org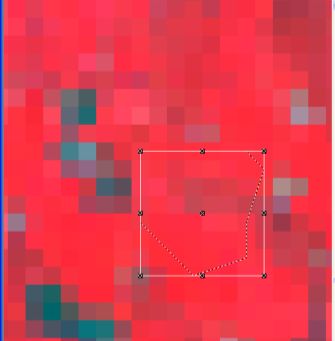
You can also read