CREATING URBAN WATER RESILIENCE IN INDIA - A WATER BALANCE STUDY OF CHENNAI, BENGALURU, COIMBATORE, AND DELHI
←
→
Page content transcription
If your browser does not render page correctly, please read the page content below
CREATING URBAN WATER
  RESILIENCE IN INDIA
 A WATER BALANCE STUDY OF CHENNAI,
 BENGALURU, COIMBATORE, AND DELHI

            Biplob Chatterjee
               Aparna Roy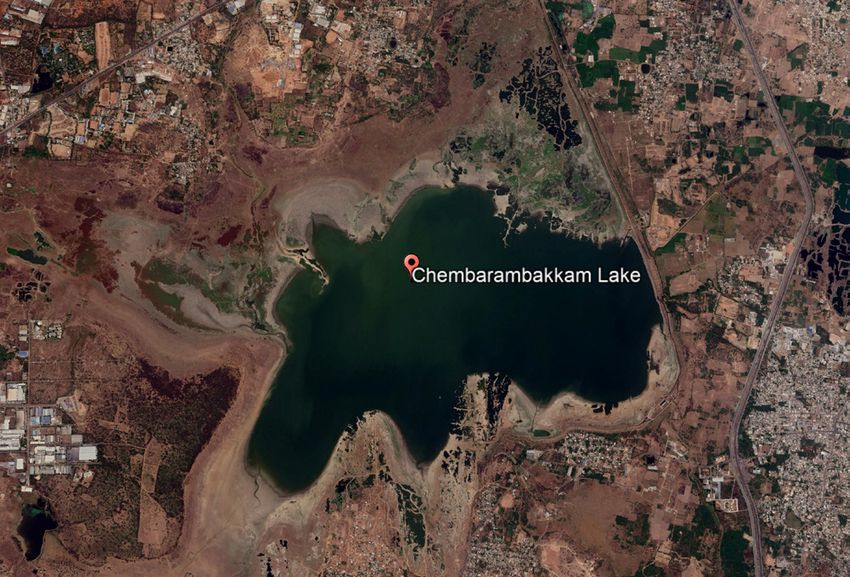
© 2021 Observer Research Foundation

All rights reserved. No part of this publication may be reproduced or transmitted
in any form or by any means without permission in writing from ORF.

Attribution: Biplob Chatterjee and Aparna Roy, “Creating Urban Water Resilience
in India: A Water Balance Study of Chennai, Bengaluru, Coimbatore, and Delhi,”
March 2021, Observer Research Foundation.

Disclaimer: The secondary data used in the report have been acquired from multiple
sources, both government and non-government, which are available in the public
domain and have been referenced to the best possible. The authors acknowledge
that some of the data, including government data, do suffer from lack of accuracy
and auditability.

Observer Research Foundation
20 Rouse Avenue, Institutional Area
New Delhi, India 110002
contactus@orfonline.org
www.orfonline.org

Editing: Preeti Lourdes John
Design and Layout: Ateendriya Gupta

Cover Image: Getty Images/Harish Thangarajan
Running Header Image: Unsplash/Trac Vu

ISBN: 978-93-90494-44-6
CONTENTS

ABSTRACT												05

EXECUTIVE SUMMARY										07

INTRODUCTION											10

METHODOLOGY											15

I. SITUATION ANALYSIS										18
     Terrain, Geomorphology, Geology								19
     Population and Urban Growth								20
     Raw Water Surface Storages									24
     Infrastructure											30
     Water Supply to Peri-Urban Regions and Slums						                           31
     Evolution of Groundwater from Alternative to Critical Urban Water Resource		 32
     Urban Water Quality										39
     Changes in the Urban Water Demand							45
     Urban Water Balance										48
     Urban Water Value Chain and Governance						                                 52

II. MITIGATING URBAN WATER RESOURCE SCARCITY					                          55
     Integrated Urban Water Management Framework					                      57
        1. Augmentation of Surface Storage							57
        2. Augmentation of Groundwater Storage						65
        3. Wastewater Treatment and Reuse							66
        4. Rainwater Harvesting									71
        5. Desalinated Water									72
        6. Modernisation of Water Supply Infrastructure					               72
        7. Urban Water Demand Optimisation							73
        8. Urban Water Balance in a Circular Resource Management Framework 73
     Data Capture											75
     Urban Water Balance (Governance)							76
     Urban Water Balance Through a Circular Water Budgeting Framework

CONCLUSION											81

GLOSSARY												85

UNITS OF MEASUREMENT USED IN THE REPORT						                                    87

ENDNOTES												89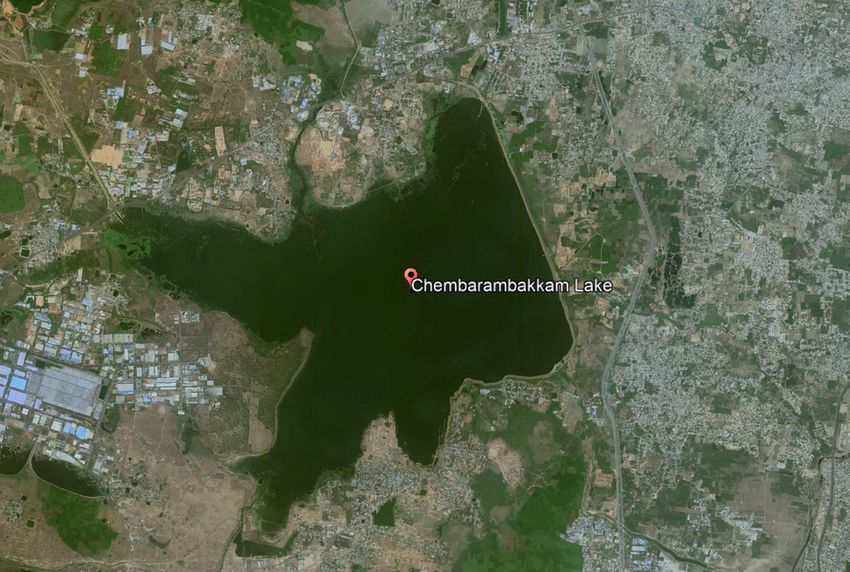
ABOUT THE AUTHORS

Biplob Chatterjee is a geologist with over 35 years of experience in applications of
planetary science. He has worked in more than 40 countries and almost the entire span
of India. His careers in ONGC (1984-86), Geological Survey of India (1986-1995), Rio
Tinto Exploration (1995-2009), HDR|Salva (2009-2013) and Geovale Services (2013
till present) have taken him to map different parts of the Himalayas, to explore the
oceans and great lakes, to deserts of Africa and Australia, and to the Arctic in North
America and Scandinavia. Biplob won the National Mineral (Geoscience) Award in
1996 and was a key player in the recent discovery of diamond deposits in Bundelkhand.
He leads a team of planetary science and engineering consultants in the domains of
water, environment and minerals in Geovale Services. His team has been carrying out
extensive hydrogeological and water security studies in different parts of India. They
are also engaged in a pioneering urban water balance study in a major north Indian city.

Aparna Roy is an Associate Fellow at ORF and Lead, Climate Change and Energy, at the
Centre for New Economic Diplomacy (CNED). Aparna’s research interests include the
politics of climate change, resilience building, and environmental governance. Aparna
contributes regularly to public scholarship via platforms such as the Times of India,
Hindustan Times and The Hindu. Aparna holds a Bachelor’s degree in Political Science
Honours and Masters degrees in Sociology and International Development. She was a
Commonwealth scholar at the University of Bristol.

                      ACKNOWLEDGEMENTS

The authors wish to acknowledge multiple discussions with and review and
recommendations by Dr. Subhash Chandra, an eminent hydrogeologist from
Karnataka and author of several publications, and Prof (Dr.) Arunangshu Mukherjee,
Head of Department of Earth Sciences at Manav Rachna University, Faridabad, and
former hydrogeologist at Central Ground Water Board (CGWB). The two anonymous
reviewers are also acknowledged for their reviews and brilliant suggestions. Sulagna
Sen and Mayuri Mukherjee and Dweepannita Basu Choudhury, geologists at Geovale
Services, have contributed immensely by carrying out detailed data collation and
analysis for this paper.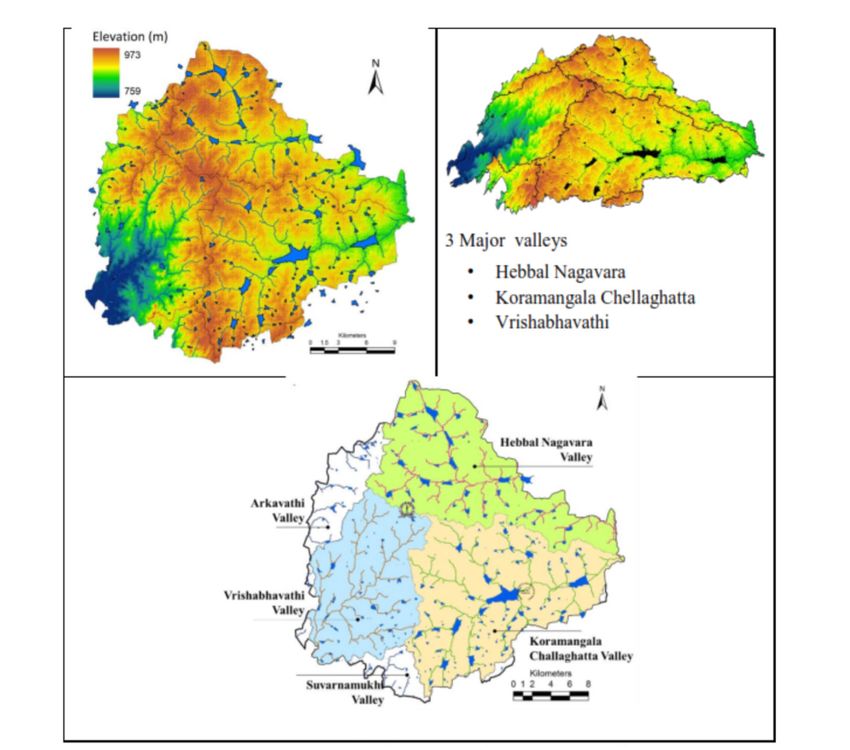
ABSTRACT
T
ABSTRACT

                     he 2021-22 Union Budget announced the launch of the Jal Jeevan Mission
                     (Urban), an ambitious project that aims to provide potable tap water supply
                     to 2.86 crore households by 2024. Even as the programme takes shape,
                     much of urban India continues to face severe water stress conditions due
           to rapid urbanisation, negligible augmentation of raw water sources, archaic water
           infrastructure and poor water governance. This study attempts to contribute to the
           mission’s objective by analysing the gaps and constraints in the current urban water
           balance and the city water budgeting process. Based on primary and secondary
           data, the study comprehensively analyses the water supply and demand scenarios in
           four water-stressed cities—Chennai, Coimbatore, Bengaluru and Delhi. A detailed
           situation analysis has been carried out to map the current scientific understanding
           of the available water resource (surface and groundwater), its utilisation, the supply
           infrastructure, available alternative raw water sources, the wastewater discharge and
           its treatment and reuse, if any. The established processes of urban water balancing
           and budgeting have been adopted to assess the water supply deficits corresponding
           to current utilisation and projected future water demand. As global climate change
           impacts loom large, if India were to succeed in its mission to provide potable tap
           water to all, not only will it be a domestic game-changer but will also serve as a
           model for other developing nations.

  6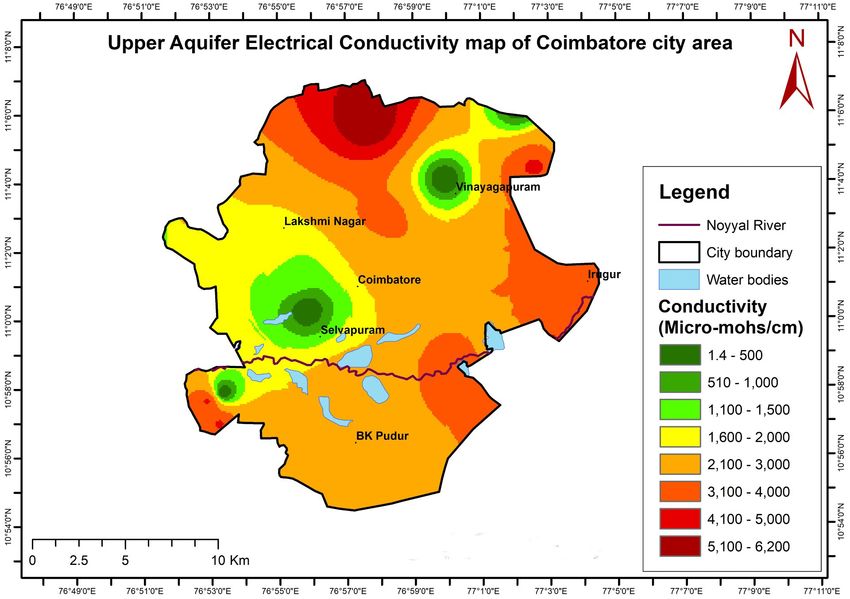
ABSTRACT
EXECUTIVE SUMMARY

                      7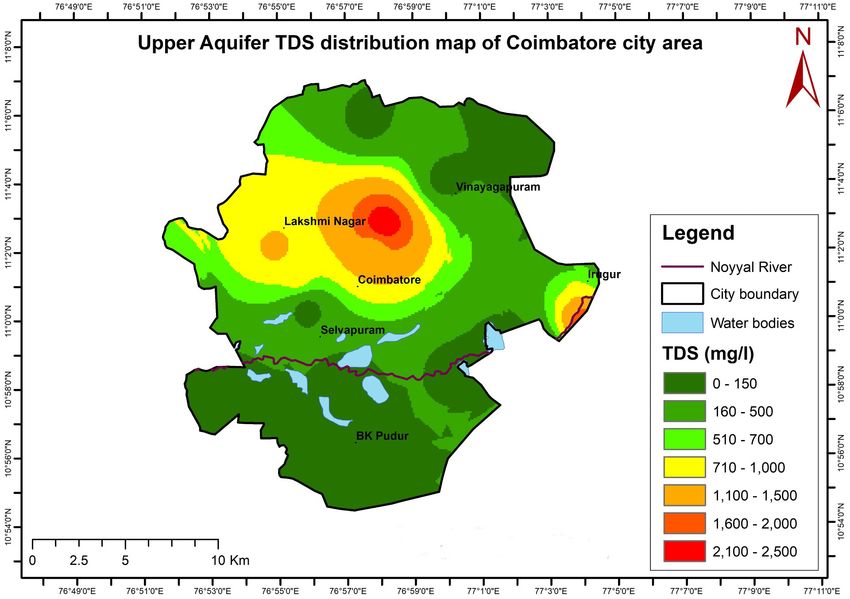
M
EXECUTIVE SUMMARY

                                  uch of urban India faces severe water stress conditions due to rapid
                                  urbanisation and population growth, coupled with negligible corresponding
                                  additions to raw water sources, archaic water infrastructure and governance
                                  issues. A substantial number of India’s 377 million urban residents face
                    water shortages, while about 200,000 die each year from inadequate or unsafe water
                    supplies.1 The further deterioration of India’s water resources will have ramifications on
                    the health, safety and sanitation needs of its people. This study attempts to establish if a
                    comprehensive water balance approach along with integrated urban water management
                    practices could be the solution to India’s urban water woes. Based on primary and
                    secondary data, this study undertakes a comprehensive analysis of the water supply
                    and demand scenarios in four water-stressed cities in India—Chennai, Coimbatore,
                    Bengaluru and Delhi. It analyses the key aspects of urban water management—water
                    source security, distribution, losses due to leaky infrastructure, demand management,
                    water budget optimisation and prudent water governance.

                       A detailed situation analysis suggests that while Chennai, Bengaluru and Delhi
                    have been constrained by space for growth, Coimbatore has been able to amalgamate
                    large peri-urban areas within the city limits. The populations of Bengaluru grew from
                    about 10,000 per square kilometre in 2001 to 15,000 square kilometre in 2020; of
                    Delhi grew from about 14,000 per square kilometre in 2001 to 20,000 per square
                    kilometre in 2020; and of Chennai increased from approximately 24,000 per square
                    kilometre in 2001 to approximately 47,000 per square kilometre in 2020. However, the
                    population of Coimbatore declined from about 15,000 per square kilometre in 2001 to
                    about 11,000 per square kilometre in 2020. Given their decades-old water supply and
                    sewerage infrastructures, all four cities are dependent on captive sources of raw surface
                    water. Coimbatore and Chennai’s captive storages are in the same river basins that
                    drain the two cities, making them vulnerable to unpredictable climate change impacts.
                    Bengaluru and Delhi, on the other hand, draw piped water from extra-basinal captive
                    sources. With between 20 percent to 50 percent water leakages in these four cities,
                    the resultant reduced per capita raw water availability ranges between approximately
                    10,000 and 30,000 litres per annum. Large peri-urban and slum areas in all four cities
                    do not have piped water supply. Uncertain and low per capita water availability means
                    an increased reliance on groundwater at a unit dwelling level. Between 10 percent
                    to 30 percent of the net raw water resource comes from groundwater in these cities.
                    However, all four cities are currently mining groundwater at 130 percent to 170 percent
                    of the annual dynamic recharge.

                       Most Indian cities conduct limited or no segregation of grey and black water discharges.
                    Established urban sewage treatment capacities range between 60 percent to 200 percent of
                    the total sewage generation in the four cities studied. However, a large part of wastewater
                    is discharged into unlined stormwater channels, which leads to the contamination of
                    the stormwater drainages and the groundwater aquifers. Most sewage treatment plants
                    function inefficiently and, consequently, most of the treated outflow does not meet the

  8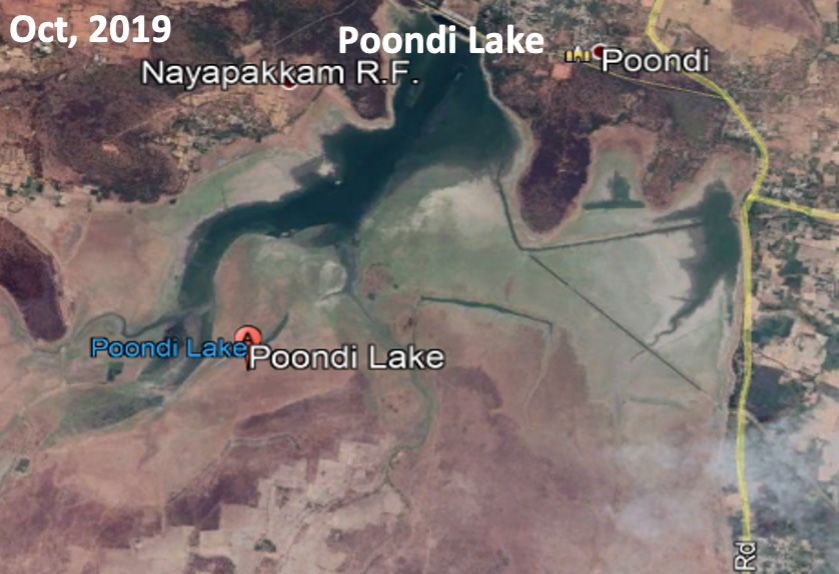
EXECUTIVE SUMMARY
desired reusable water quality. As a result, the cities face water pollution concerns, such
as high total dissolved solids, high electrical conductivity, variable amounts of toxic metal
content, low dissolved oxygen, high biological oxygen demand, high chemical oxygen
demand, and presence of E-coli in piped water and groundwater due to sewage mixing
with leaky pipelines or infiltrating the groundwater systems from unlined conduits.

   This report concludes that transitioning from the current linear water balance
framework and corresponding governance structure into a circular water balance
framework regulated through an Integrated Urban Water Management (IUWM) process is
necessary to optimise available water resources. The adaption of circular water balancing
within the IUWM and appropriate governance processes will need increased focus on
raw water surface/captive source security; the augmentation of aquifer water through
conservation; the harvesting and conservation of urban rainwater for either direct use or
groundwater recharge; the use of desalinated water wherever feasible; and the capturing,
segregation and differential treatment of black and grey water to ensure optimised reuse.
Adopting the IUWM process might necessitate the re-laying and replacement of existing
water distribution infrastructure, starting from peri-urban or poorer areas. Data suggests
that using a circular water balance framework, and by accounting for the conservation
of potential rainfall and treated wastewater, gross water availability increases from 350
million cubic metres (MCM) to 950 MCM in Chennai, from 825 MCM to 1350 MCM in
Bengaluru, from 70 MCM to 185 MCM in Coimbatore, and from 1550 MCM to 3250
MCM in Delhi—an increase of between 160 percent to 270 percent in all four cities.

   The implementation of circular water balance in an IUWM framework will require
significant changes in the current governance model of India’s urban local bodies (ULB).
The entire water balancing process, the demand analysis, and long-term and short-term
water management planning can be based on both legacy and real-time (sensor based)
data acquisition. Relevant qualitative and quantitative water information will include the
detailed science-based mapping of urban surface water and groundwater sources, water
supply and drainage networks, and discharge conduits. The ULBs will need significant
training and capacity building to capture, analyse and plan water management in an
IUWM framework. Urban citizens will need to be made participants in the IUWM process.
Citizens must be encouraged to practice pragmatic demand optimisation and accept that
reducing non-revenue water is the key to sustainable urban water security.

   The proposed strategy to ensure water security for Indian cities integrates with the
Ministry of Jal Shakti’s aspiration to provide piped potable water supply to 2.86 crore
households by 2024. It also addresses goal 6 (clean water and sanitation) and 6.5
(implement water resource management) of the UN’s Sustainable Development Goals.

                                                                                                     9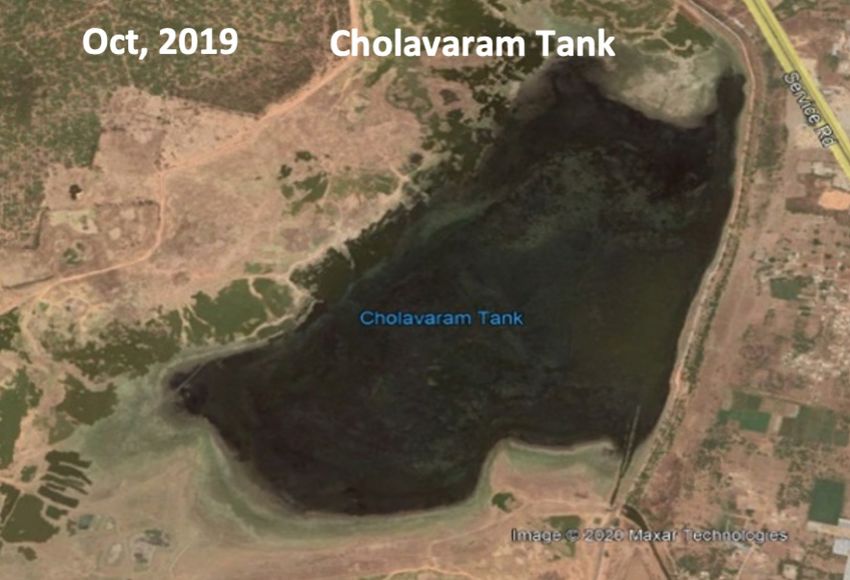
10
                    EXECUTIVE SUMMARY

     INTRODUCTION
I
INTRODUCTION
ndia is facing severe and sustained water stress conditions, ranking thirteenth among
all “water stressed” countries in the World Resources Institute’s Aqueduct Water Risk
Atlas.2 Many parts of the country are experiencing water scarcity and water risks3
(see Figure 1 for definitions), and the groundwater and surface water storages are
severely exploited. In north India, average groundwater levels in the phreatic unconfined
aquifers declined by an average of over eight centimetres annually between 1990 and
2014.4 India’s population will outgrow its current water supply if the approach towards
water management and standards of governance do not change. By 2030, India’s water
demand is projected to be twice the available raw water supply, implying potential scarcity
for hundreds of millions of people and an eventual six percent loss in the country’s gross
domestic product.5 India’s water demand will grow 24 percent by 2025 and 74 percent by
2050, with implications for food security, health and access to resources.6
Figure 1: Water Stress, Water Scarcity and Water Risk
Source: Pacific Institute.
Water Scarcity: Refers to the volumetric abundance, or lack thereof, of water supply. This is
typically calculated as a ratio of human water consumption to available water supply in each
area. Water scarcity is a physical, objective reality that can be measured consistently across
regions and over time.
Water Stress: Refers to the ability, or lack thereof, to meet human and ecological demand for
water. Compared to scarcity, water stress is a more inclusive and broader concept. It considers
several physical aspects related to water resources, including water scarcity, but also water
quality, environmental flows, and the accessibility of water.
Water Risk: Refers to the probability of an entity experiencing a deleterious water-related event.
Water risk is felt differently by every sector of society and the organisations within them, and
is thus defined and interpreted differently (even when experiencing the same degree of water
scarcity or water stress). Nevertheless, water-related conditions, such as water scarcity, pollution,
poor governance, inadequate infrastructure and climate change, create risk for many different
sectors and organisations simultaneously.
11INTRODUCTION
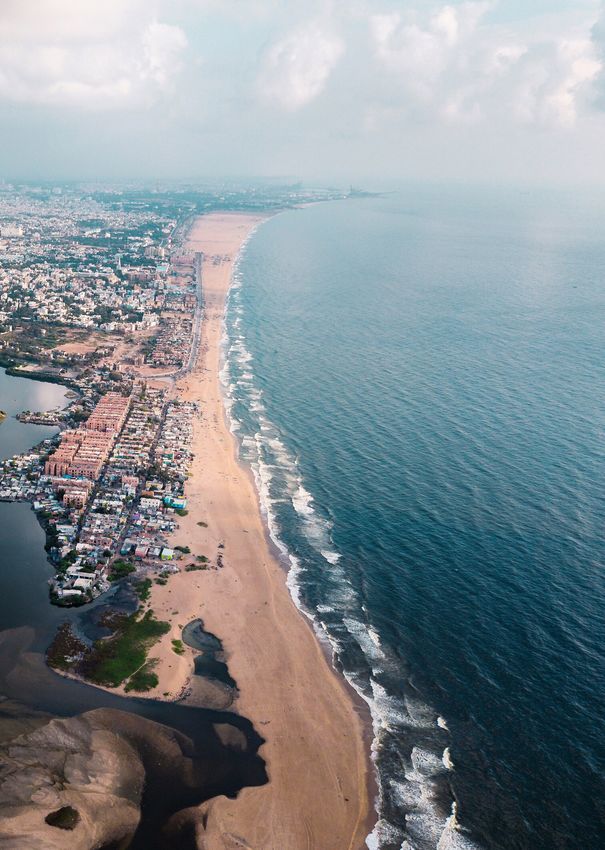
The situation is even more dire in urban India. Chennai ran out of piped water
in 2018-2019 following three years of near-drought conditions, and 21 other major
Indian cities will soon run out of groundwater if water abstraction continues as normal
(see Figure 2).8 Rapid urbanisation and population growth, coupled with no added
raw water sources, archaic water infrastructure and inefficient water governance,
means that most Indian cities are ill-equipped to handle the increasing water scarcity
and water stress. Climate change impacts will only aggravate the situation; rising
temperatures could cause the periodic drying up of captive water sources. Extreme
weather events, such as frequent floods and droughts, could also impact economic
activities, affecting livelihoods and ecosystems. An effective and integrated approach
to water resource management is, therefore, critical for a rapidly urbansing India.
Figure 2: Map Showing the Groundwater-Stressed Cities in India
(As of Year 2018)
Source: Ministry of Statistics and Programme Implementation.9
12INTRODUCTION
DAY ZERO IN CAPE TOWN (2018) VS CHENNAI’S MONSOON FAILURE (2018-2019)
Chennai’s water scarcity situation was reminiscent of the Day Zero crisis in Cape Town, South
Africa.10 Chennai saw a near total depletion of all available fresh-water resources in 2019 as a
result of a failed monsoon season (2018).11 All of Chennai’s four raw water storages nearly dried
out and people resorted to intensive groundwater mining,12 thereby depleting the city’s aquifers as
well. Importantly, although Cape Town declared Day Zero after three consecutive years of drought,
which led to a near complete exhaustion of surface water storages, the city’s aquifers remained
relatively unstressed. Chennai’s water crisis, however, resulted from a significant depletion of both
surface and groundwater storages after a single failed monsoon season.13
Table 1 lists the differences in manifestations of water stresses in Cape Town and Chennai. Cape
Town’s multi-year drought was considered an anomalous hydro-meteorological phenomenon and
a potential climate change impact. Chennai, on the other hand, had many similar years of poor
rainfall, alternating between normal to high precipitation years. Chennai is not the first city in
India to face a major water crisis. Shimla (2018)14 and Latur (2016),15 both smaller cities, have
seen similar or worse water scarcity periods, indicating a deeper malaise in India’s urban water
management systems, processes and practices.
TABLE 1: Comparison of Relative Impact of Reduced
Precipitation on Cape Town and Chennai
ELEMENT CAPE TOWN CHENNAI
Population (Metro) 4 million 9 million
Average annual precipitation 80 cms 140 cms
Period of low precipitation 2015 – 2018 2016 – 2018
Total surface water storage
900 MCM 300 MCM
for the city
Did groundwater storage get
No Yes
impacted
None in first two years, panic
Preparation by city during the 3rd year to do
Extensive; for three years
corporation for the impact firefighting; water import
resorted
Preparation by city residents Extensive, with full cooperation None; no training, no
for the impact of the corporation preparation
Was this a climate change
Definitely Yes May Be
manifestation
13INTRODUCTION
The 2021-22 Union Budget launched plans to provide piped water supply to 2.86
crore household by 2024 to fight India’s water woes. The focus is now on water
conservation measures, such as rainwater harvesting; the renovation, restoration and
rejuvenation of tanks and lakes; reusing wastewater; the construction of recharge
structures; desalination; watershed development; and intensive afforestation. The
2020-21 Union Budget allocated INR 11,500 crore for measures to enhance water
availability and water resource sustainability.16
According to the 2018 National Sample Survey, 48.6 percent of rural households
and 57.5 percent of urban households have individual water connections.17
Between 40 percent to 50 percent of water is reportedly lost in the distribution
system due to pipeline leakages and water theft.18 As per the 2011 Census, only
32.7 percent of urban Indian households are connected to a piped sewerage
discharge system.19 By 2030, urban India is expected to host a larger proportion
of the country’s population—about 590 million people, up from the current 377
million.20 A significant portion of India’s urban population is already facing acute
water shortages, with about 200,000 dying each year due to inadequate or unsafe
water supplies.21 By 2050, India’s water requirement in a high-use scenario is likely
to be 1,180 billion cubic metrics (BCM), while the current availability is 695 BCM.22
The gross water availability is lower than this projected demand, at 1,137 BCM. Any
further deterioration of the country’s water resources will have ramifications for the
health, safety and sanitation needs of most of India’s population.
The COVID-19 pandemic has highlighted the importance of access to water,
sanitation and hygiene in crisis response. In India, shortfalls in infrastructure
for water and sanitation have influenced the eventual scale and impact of the
pandemic.23 Critical water infrastructure in many regions of the country is far from
adequate and are exposed to increased risk from climate change. It is essential to
study India’s current water situation in detail and understand the reasons for the
emerging water crisis to arrive at a solution for effective water management.
With many Indian cities projected to run low on groundwater and face severe
source security challenges,24 this report aims to answer some critical questions.
Given the severity of water shortage, is India taking the most effective and efficient
approach to water management? Do Indian cities employ the required technical
and institutional capabilities in developing a thorough hydrological understanding
of water source and use fundamental scientific information for assessing the urban
water balance and corresponding estimation of urban water budget? How can India
successfully manage climate and sustainable development? Can the adoption of
an integrated water management strategy help restore India’s water security and
ensure long-term viability?
14METHODOLOGY
METHODOLOGY
15T
METHODOLOGY
his report presents an in-depth analysis of the key aspects of urban water
management—ensuring urban water source security; water distribution and
water infrastructure management; water demand management; water budget
optimisation; and prudent water governance. It undertakes a comprehensive
analysis of the water supply and demand scenarios in four water-stressed Indian cities—
Chennai, Coimbatore, Bengaluru and Delhi—based on primary and secondary data. It
emphasises source security and presents a framework to understand the urban water
balancing and urban water budgeting processes. Aspects like infrastructure, demand
management, governance and community engagement are also discussed.
The on-ground primary data collected includes hydrological, hydrogeological and
hydrochemical information from Delhi, Coimbatore and Bengaluru and their suburban
areas, as well as water supply and demand information through hydro-census surveys.
The authors have conducted satellite data study and interpretation of Landsat and
Alos Pulsar datasets for Delhi, Coimbatore, Bengaluru and Chennai to understand the
geomorphology, stormwater drainage, land-use-land-cover, water bodies (see Figures
28, 29, 30, 31 and 32) and civil interventions in the urban drainages.
The secondary datasets used for the study are:
• Census information (1991, 2001 and 2011) for the four cities
• Information on water storage reservoirs in the four cities
• Available masterplans for the four cities
• Landsat data for urban drainage and waterbody information and changes over
the years
• Central Ground Water Board data on dynamic water resources, and state and
district groundwater resources
• Public domain information on hydrology, hydrogeology and urban water
infrastructure for the four cities
• Hydro-meteorological data from Indian Meteorological Department
The process flow for the study is:
16METHODOLOGY
Figure 3: Process Flow for Urban Water Security Study
Broad overview of urban water
scenario; selection of sample cities for
the study; designing the study.
Secondary data collation and analysis:
Data source identification; analysis of
urban water management elements.
Primary data collection: by a team
of hydrogeologists, geologists,
structural geologists, hydro-chemists,
geophysicists (2018-2020); analysis.
Developing an understanding of
urban water security issues; interviews
with experts.
Urban water budgeting and analysis
of information gaps for optimisation
of water budget.
Draft report; interviews with
specialists; identification of areas for
further study; final report.
17METHODOLOGY
I.
SITUATION ANALYSIS
18I. SITUATIONAL ANALYSIS
T
Terrain, Geomorphology, Geology
hree of the four referenced cities—Coimbatore,25 Bengaluru26 and
Chennai27—are located in the southern part of peninsular India. Bengaluru
and Coimbatore have broadly similar hydrogeological settings controlled
by hard crystalline granitic rock geology. Chennai,28 on the other hand,
has a hydrogeologically heterogenous setting with an east-west trending spine of
hard crystalline rock passing through the middle of the city and flanked on the
north and the south by younger, softer, porous and permeable coastal sediments.
Delhi, in north India, is situated at the edge of the Indo-Gangetic plains, with soft
and permeable Quaternary age Yamuna alluvial and desert sediments overlying the
hard fractured Proterozoic quartzites, which mark the northeastern extensions of
the Aravalli Range.
Bengaluru is situated on an elevated plateau averaging over 900 metres above
mean sea level and is drained by the south-westerly flowing Vrishabhavati River
(a tributary of the Arkavati River to the west of the city in the Cauvery Basin) and
the easterly flowing Poonaiyar River to the east of the city (see Figure 7). Chennai
presents a coastal geomorphology to the east, extending from the pediplained hard
crystalline rocks in the west, and is drained by the easterly flowing Cooum, Adyar
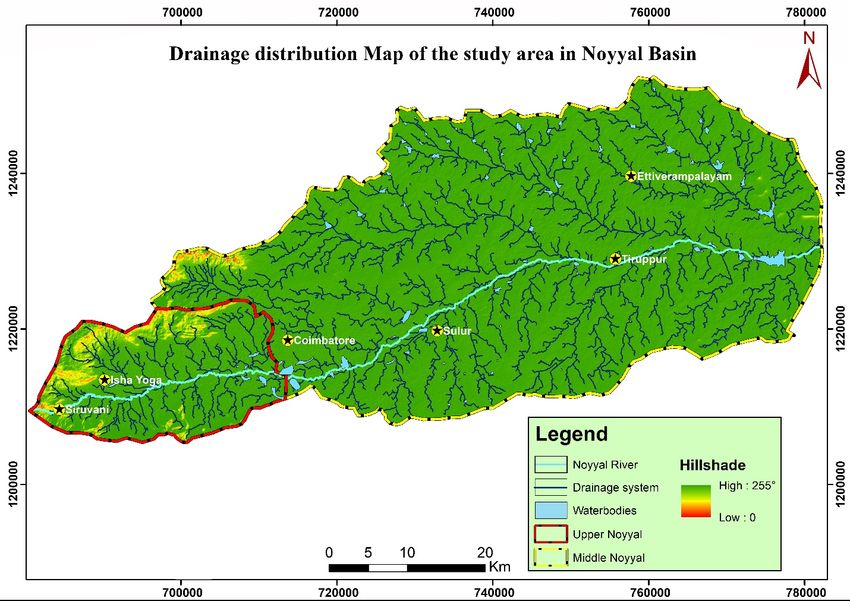
and Kosasthalaiyar River watersheds (see Figure 8). Coimbatore also presents a
pediplain geomorphology and is drained through the middle of the city entirely by
the easterly flowing Noyyal River, a tributary of River Bhavani and part of the Cauvery
River Basin (see Figure 9). Delhi has a rolling topography in the southeastern part
of the city, where the rocks of the Aravalli range are exposed, and is surrounded by
relatively flatter alluvial plains. The entire city is situated in the Yamuna River Basin
(see Figure 10).
19I. SITUATIONAL ANALYSIS
C
Population and Urban Growth
hennai, Bengaluru and Delhi saw significant population growth in the
last three decades, expanding into very large Tier 1 megapolises, while
Coimbatore is a Tier 2 city. The city limits and areas have also expanded
variably (Figure 4). All four cities have evolved through ancient traditions
of water conservation—for instance, Coimbatore’s system tanks were constructed
by the Chola Chalukya dynasty29 and Bengaluru’s series of tanks connected through
Rajakaluves (canals) were constructed by the Western Ganga dynasty.30
Census data has been used to determine the population growth in each of the
four cities between 2001 and 2011 (see Figure 5), as well as to make projections for
2020 and beyond.31,32 Notably, the expansion of the geographical limits of Chennai,
Bengaluru and Delhi was constrained in relation to their cities’ population growth.
The population densities for these three cities increased substantially between 2001
and 2011—from approximately 10000 persons per square kilometre to about 17000
persons per square kilometre in Chennai;33 from approximately 10000 persons per
square kilometre to about 12000 persons per square kilometre in Bengaluru;34 and
from approximately 9000 persons per square kilometre to about 11500 persons per
square kilometre in Delhi35 (see Figure 6). Only Coimbatore city limits expanded
significantly to incorporate much of its low populated suburban areas, consequently
showing a reduction in the average population density (from approximately 9000
persons per square kilometre in 2001 to about 6000 persons per square kilometre
in 201136).
Over the last two decades, India’s cities have seen significant population growth
due to migration from rural areas, but this has mostly outpaced the expansion of
city limits, resulting in excess stress on the available resources.
20I. SITUATIONAL ANALYSIS
Figure 4: Growth in Area in Chennai, Bengaluru, Coimbatore
and Delhi in 2001, 2011 and 2020 (sq. km)
CHENNAI
BENGALURU
COIMBATORE
DELHI
Source: Authors’ estimation using primary satellite data.
21I. SITUATIONAL ANALYSIS
Figure 5: Projected Population Growth for Chennai, Bengaluru,
Coimbatore and Delhi (2030)
CHENNAI
BENGALURU
COIMBATORE
DELHI
Source: Census data, 2001 and 2011.37,38
Note: Population figures for 2020 are estimates based on Census projections.
22I. SITUATIONAL ANALYSIS
Figure 6: Growth in Population Density in Chennai, Bengaluru,
Coimbatore and Delhi in 2001, 2011, 2020 and 2030 (per sq.km)
CHENNAI
BENGALURU
COIMBATORE
DELHI
Source: Census data, 2001 and 2011.39,40
Note: Population figures for 2020 are estimates based on Census projections.
23I. SITUATIONAL ANALYSIS
M
Raw Water Surface Storages
ost of India’s larger Tier 1 cities have substantial captive surface raw water
sources, which are supplemented by the abstraction of groundwater.
However, cities in the Indo-Gangetic plains primarily rely on groundwater
abstraction. All four reference cities have captive sources of surface water,
and some also have multiple sources of raw water storages (see Table 2). These captive
storages are located either within the same watershed that the city is part of or in extra-
basinal watersheds. Water is pumped from primary storages and carried through large
pipelines to secondary temporary storages within the cities, and supplied to domestic
and other urban consumers through the urban water distribution infrastructure after
chlorination and treatment. Delhi and Bengaluru’s raw surface water storages are remote
and extra-basinal, while Coimbatore and Chennai draw water from storages within the
same watershed draining the city. Based on primary sources, the authors estimate that
the current water supply infrastructure in Chennai, Bengaluru, Coimbatore and Delhi
cover between 60 percent to 80 percent of the city areas.
Table 2: Current Surface Water Storage Reservoirs
Serving the Freshwater Requirements of
Chennai, Bengaluru, Coimbatore and Delhi
CHENNAI BENGALURU COIMBATORE DELHI
Poondi Chamraja Sagar Siruvani Bhakra
Cholavaram Krishna Raj Sagar Aliyar Hatnikund
Red Hills Kabini Pillur Tehri
Chembarbakkam
24I. SITUATIONAL ANALYSIS
Figure 7: Surface Water Storages Serving Bengaluru
Source: Bangalore Water Supply and Sewerage Board.41,42
Note: The surface water storages serving Bengaluru include the Cham Raja Reservoir on River Arkavathy, the Krishna Raj Sagar
Reservoir on River Cauvery and the Kabini Reservoir on River Kabini. These storages are part of Cauvery water supply scheme, with
a capacity of supplying approximately 1440 million litres per day (MLD) to Bengaluru.
Figure 8: Surface Water Storages Serving Chennai
Source: Chennai Metropolitan Water Supply & Sewerage Board.43
Note: The surface water storages
44, 45
serving Chennai include Poondi, Red Hills, Chembarbakkam and Cholavaram Reservoirs on the
Cooum river, and the Adyar and Kosasthalaiyar River watersheds, which also drain Chennai City.
25I. SITUATIONAL ANALYSIS
Figure 9: Surface Water Storages Serving Coimbatore
Source: Map created by authors using satellite data and primary survey of the Noyyal and Bhavani basin watershed management studies.
Note: The Siruvani Reservoir in the headwaters of Noyyal River and Pillur Reservoir in the Bhavani River are the two major surface
water storages serving Coimbatore.46 Noyyal is an urban river that flows through the middle of Coimbatore city.47
Figure 10: Surface Water Storages Serving Delhi
Source: Based on data from City of New Delhi, Safe Water Network, 2016.48
Note: Delhi’s water supply is drawn from multiple distant surface water sources at Bhakra Reservoir, the Hatnikund Barrage
on River Yamuna and the Tehri Reservoir.49, 50
26I. SITUATIONAL ANALYSIS
Although Bengaluru, Chennai, Coimbatore and Delhi have seen significant
population growth between 2001 and 2020, there has been no corresponding
major augmentation of their raw surface water storage capacities. Instead, storage
capacities in the source reservoirs and secondary storages are likely to have been
adversely impacted due to siltation of the captive reservoirs, as has happened in
Chennai (see Figures 11 and 12).
Figure 11: Changes in Available Surface Water Storage
(Per Capita)
Source: Authors’ own calculations based on Census 1991,51 200152 and 2011.53
The four cities being studied have now created plans to augment their source raw
water surface storages.54, 55, 56, 57 However, most of these plans have also seen significant
delays due to the unavailability of source water or land constraints because of
environmental and community issues.
With looming climate uncertainties, India has already begun experiencing changes in
the annual precipitation patterns in many regions. This will have uncertain implications
on urban water source security, especially if there is primary water dependence on
a limited number of discrete captive storages. Having multiple raw water storage
availabilities in several basins is a better strategy to mitigate adverse climate change
impacts (see Table 2 and Figures 6, 7, 8 and 9). Chennai and Coimbatore, which source
water from proximal storage reservoirs located within the same watershed draining the
cities, are likely to remain vulnerable to the vagaries of climate uncertainties. In 2018
and 2019, Chennai experienced a failed monsoon cycle and near drought conditions,
which led to the drying up of all its surface storages and widespread water scarcity,
dubbed as Day Zero by the media (see and Figure 12).58
27I. SITUATIONAL ANALYSIS
Figure 12: Satellite images of Reservoir Storage Conditions in
Chennai (2013 and 2019)
CHEMBARBAKKAM LAKE
POONDI LAKE
CHOLAVARAM TANK
28I. SITUATIONAL ANALYSIS
Satellite images from 2013 and 2019 of the Chembarbakkam Lake, Poondi Lake
and Cholavaram Tank show that although Chennai received some rains during the
northeastern and southwestern monsoon in 2019, this was not sufficient to restore
the safe storage levels of the reservoirs.59 Chennai’s experience is an illustration of
the need for India’s large Tier 1 cities to secure multiple captive distant storages in
different basins.
SECURING ADDITIONAL RAW WATER STORAGES FOR CITIES
Groundwater Recharge of Yamuna Floodplains
As Delhi struggled to conserve and replenish groundwater, the state government
announced an ambitious pilot project in July 2019—the Delhi Yamuna floodplain
water storage project—to create multiple surface reservoirs between Palla and
Wazirabad in the alluvial floodplains of Yamuna river. Under this programme, small
ponds will be created in the floodplains to collect water from an overflowing Yamuna
during the monsoon season, which will then recharge the groundwater aquifers.60, 61, 62
At the same time, the Delhi Irrigation and Flood Control Department launched a
programme to stock the overflowing water from the river in shallow storages in the
floodplains. In a pilot, a 25-acre pond is being constructed on the floodplains of
Yamuna at Palla to recharge the aquifers, from where borewells can abstract water
to meet the local demand. Authorities have installed over 35 piezometers at up to 2
kilometres across the river to monitor the water table and piezometric surfaces in
the aquifers.63
Securing Water from Krishna River for Chennai
At the height of Chennai’s water crisis in 2018-19, tankers were used to supply
abstracted groundwater from outside the city limits. Between 700 to 900 Chennai
Metro Water Supply and Sewage Board tankers made nearly 10,000 trips a day to
freight 100 MLD of groundwater to the city.64
The inter-river basin transfer of water to Chennai has generally prevented the drying
up of the city’s captive reservoirs. Chennai’s four lifeline lakes are fed water from
Krishna river during times of distress. The city also gets supplies from Veeranam, a
giant lake 235 kilometre to the south in Cuddalore district, that depends on discharge
from the Mettur dam on the Cauvery river. The supply from Krishna basin has
helped Chennai’s ensure a captive storage of about 6 billion cubic feet (bcft) of
groundwater.65, 66
29I. SITUATIONAL ANALYSIS
T
Infrastructure
he surface water distribution infrastructure for Chennai, Bengaluru, Coimbatore
and Delhi were developed decades ago, undergoing minor upgrades in
subsequent years. The water distribution infrastructure in these cities report
distribution leakages of between 20 percent and 45 percent (see Figure
13). If the freshwater resource availability stays unchanged, the registered increase
in urban population and deteriorating water infrastructure (and resultant leakages)
will translate into a significant reduction in per capita raw water availability, assessed
between 2001 and 2011 (the census years) and projected for 2020 (see Figure 11).
Based on population growth between 2001 and 2011 and accounting for distribution
leakages, the authors estimate that the per capita surface water availability reduced
from approximately 70 m3 to 33 m3 in Chennai, from approximately 100 m3 to 43 m3 in
Bengaluru, from 62 m3 to 24 m3 in Coimbatore, and from 95 m3 to 50 m3 in Delhi. The
reduction in per capita raw water availability persists as the reservoirs continue to silt,
urban population grows and the distribution infrastructure becomes leakier.
Figure 13: Total Surface Water Storage vs Available Raw Water
Source: Graph created by the authors using available data from respective municipal corporations.
Note: Distribution leakages are shown in line chart with scale in the secondary axis.
Given the population growth between 2001 and 2011 and projected growth for
2020, and the distribution leakages of between 20 percent and 45 percent, none of the
four cities meet the Bureau of Indian Standards (BIS) 1172:1993 benchmark of 200
litres per capita per day (or 73 m3 per capita per year).
India’s urban water management systems must prioritise upgrading and replacing
major parts of the existing water distribution infrastructure to plug the leakages.
30I. SITUATIONAL ANALYSIS
P
Water Supply to Peri-Urban Regions and Slums
eri-urban areas are defined as dynamic spaces where rural and urban
activities, processes and institutions coexist.67 India’s expanding cities have
been absorbing peri-urban areas and slums, where many migrants and the
poor live, within their limits. All four reference cities in this study have
significant populations living in slums and peri-urban areas with poor infrastructure—
in Delhi, about three million people live in urban slums;69 approximately 30 percent
of Chennai’s total population lives in slums;69, 70 Bengaluru city has 597 slum areas,
with about 20 percent of the city population residing there;71 and about 16 percent
of Coimbatore’s population live in the city’s 319 slum areas.72
Although all four cities have incorporated the surrounding peri-urban areas
within their limits, the urban local bodies (ULBs) have been slow in extending the
city water infrastructure (both supply and sewage discharge management) to these
areas. The water distribution infrastructure in the peri-urban and slum areas are
mostly restricted to a single tap connection with limited water availability for a
cluster of houses. Consequently, residents of these areas have resorted to extensive
groundwater exploitation to meet their needs.
Additionally, informal water vendors have used peri-urban areas to pump out and
transfer groundwater to the core urban areas using tankers (earning the moniker
of ‘tanker mafia’). The tanker vendors resort to aggressive pricing, unreliable water
supply, groundwater mining and apparent stealing of agricultural water. In many
Indian cities, the peri-urban and slum areas are conflict zones for water equity and
water justice due to unsustainable water availability and expanding water scarcity.
Infrastructure expansion planning by ULBs has lagged urban expansion in recent
years and must now catch up for these areas.
31I. SITUATIONAL ANALYSIS
Evolution of Groundwater from Alternative to
G
Critical Urban Water Resource
roundwater is significant for water supply in India’s cities, but it remains a
“blind spot in urban water planning”73 due to a lack of data. Groundwater
exploitation in cities has grown exponentially since the 1990s alongside
rapid population expansion. The use of groundwater for urban domestic
purposes competes with agricultural and industrial demands on the groundwater
aquifer within the same hydrogeological boundaries in which the cities are located.
This increasing demand for groundwater means that borewells in the cities and
industrial sectors are being drilled deeper over time.
Assessment by the Central Ground Water Board (CGWB) for Chennai, Bengaluru,
Coimbatore and Delhi suggests that groundwater abstraction is occurring at a
rate higher than the dynamic or annual recharge, with the four cities showing
overexploited groundwater status since 2011 (see Figure 14).74 The gap in water
supply corresponding to the demand in the cities, which is further accentuated
by the inefficient water distribution network, is mostly plugged by an increased
groundwater abstraction. While the NITI Aayog has suggested that the groundwater
development status be used as a metric to assess the intensity of urban water
stress,75 other empirical observations suggest that groundwater overexploitation is
correlated to poor and inefficient water distribution infrastructure, especially in the
peri-urban and poorer parts of the city. Any significant drop in the groundwater level
below the dynamic water table could make the peri-urban and poorer areas of the
city vulnerable to extreme climate uncertainties, much like the drought conditions
experienced by Chennai in 2019.
32I. SITUATIONAL ANALYSIS
Figure 14: Annual Groundwater Recharge and Draft,
Plotted for 2004, 2009, 2013 and 2017
BENGALURU
CHENNAI
COIMBATORE
DELHI
Source: CGWB Annual Dynamic Groundwater Data.76, 77, 78, 79
33I. SITUATIONAL ANALYSIS
In 2018, Chennai, Bengaluru, Coimbatore and Delhi were included in the NITI
Aayog’s list of water-stressed cities;80 all four are seeing groundwater mining
conditions due to significantly higher groundwater abstraction than the annual
dynamic recharge. India’s cities, which have inadequate water supply and inefficient
water management systems, rely on unit-based and mostly non-regulated private
groundwater abstraction, leading to the indiscriminate pumping and eventual
mining of groundwater.
All four cities in this study report overexploitation of groundwater for the four
years of data acquired (2004, 2009, 2013 and 2017). Data from Coimbatore and
Bengaluru used in this study cover the larger watersheds, with significant agricultural
demand as well, while the data from Chennai and Delhi only cover the metropolitan
areas.
Delhi and Coimbatore demonstrate a progressive lowering of groundwater levels
each year. Chennai’s groundwater levels appear to recover after each monsoonal
precipitation (Figure 15). In Bengaluru, water levels in the open wells appear to
be rising in the perched lithomarge bottom aquifers in the laterite capped areas,
although local news reports also suggest deepening water levels in the hard rock
aquifers.81
34I. SITUATIONAL ANALYSIS
Figure 15: Average Water Level of Pre-monsoon Season
(1996-2018)
BENGALURU
CHENNAI
COIMBATORE
DELHI
Source: Authors’ own graphical representation based on monitoring well data from Central Ground Water Board.82, 83, 84, 85
35I. SITUATIONAL ANALYSIS
Although Chennai, Coimbatore and Delhi are clearly overexploiting (see Figure
14), the phreatic aquifer is still an important groundwater source in these cities.
Bengaluru has a near complete drying of the phreatic aquifer, and the falling
groundwater levels indicate that the deeper fracture controlled semi-confined to
confined city aquifer is currently being mined out of its limited groundwater storage.
Annual groundwater draft in the four cities is greater than the annual dynamic
recharge, making them vulnerable to climate uncertainties, especially droughts.86
CGWB data indicates that the annual dynamic groundwater resource generated
within the city limits vary in the four cities—from about 10 percent of available
surface water for Chennai to 22 percent in Coimbatore, 24 percent in Delhi, and
about 65 percent in Bengaluru (Figure 16). Among the four, Bengaluru exploits
groundwater the most. Although groundwater is volumetrically smaller than the
available surface storages, the groundwater resource plays an extremely critical
role in plugging the piped water supply gaps in the cities. On its own, groundwater
caters to 30 percent or more of the city areas and the resident population in the four
cities. Periods of lower precipitation translate to higher groundwater abstraction in
all four cities. It will thus be prudent to restrict the groundwater abstraction within
the safe development norms ofI. SITUATIONAL ANALYSIS
Figure 16: Annual Dynamic Recharge of Groundwater and
Corresponding Groundwater Abstraction in Chennai, Bengaluru,
Coimbatore and Delhi (2004, 2007, 2013 and 2017)
CHENNAI
BENGALURU
COIMBATORE
DELHI
Source: Authors’ plots from Central Ground Water Board’s dynamic groundwater resource data.88
37I. SITUATIONAL ANALYSIS
Static (or stock) groundwater resource available in the aquifers should stay
necessarily stored for extreme emergencies. Chennai, Bengaluru, Coimbatore
and Delhi report groundwater overdraft of about 170 percent of the annual
replenishable resource availability, which locally increases to 400 percent of the
annual replenishable resource in smaller sub-watersheds.89 Primary and secondary
data (Figure 17) suggests that most cities are yet to establish an appropriate
governance framework to control and manage groundwater exploitation, resulting
in both overexploitation and increased pollution of the aquifers.
Figure 17: Generalised Trends of Surface and Groundwater Use
across Variously Sized Urban Settlements in India
Source: Shah and Kulkarni, 2015.90
Most small- and medium-sized towns in India have a greater reliance on
groundwater. As the surface raw water consumption increases in larger cities and
metros, there is a corresponding increase in groundwater abstraction.
38I. SITUATIONAL ANALYSIS
W
Urban Water Quality
hile there is a continuous reduction in per capita water availability,
India’s cities are also seeing progressively deteriorating water quality.
A report by the BIS on piped drinking water in 15 state capitals
outlined severe quality concerns in most cities, including Chennai,
Bengaluru and Delhi.91, 92 The tests were conducted on chemicals, toxic metals,
organo-leptic, bacteriological and physical parameters, as per BIS norms.93 The
report suggests that a vast majority of the samples did not comply with Indian
standards (IS 10500:2012)94 in one or more parameters (see Table 3).
Table 3: Results of Bureau of Indian Standards Test on
Quality of Piped Drinking Water
CATEGORISATION CAPITAL NO. OF FAILING NO. OF INDIVIDUAL
PARAMETERS IN
WHICH SAMPLE
FAILING
1 Mumbai 0/10 0
Hyderabad 1/10 1
2
Bhubaneswar 1/10 1
3 Ranchi 1/10 4
4 Raipur 5/10 3
5 Amravati 6/10 7
6 Shimla 9/10 1
7 Chandigarh 10/10 2
8 Thiruvananthapuram 10/10 3
Patna 10/10 4
9
Bhopal 10/10 4
Guwahati 10/10 5
10 Bengaluru 10/10 5
Gandhinagar 10/10 5
Lucknow 10/10 6
11
Jammu 10/10 6
12 Jaipur 10/10 7
Deheradun 10/10 7
13 Chennai 10/10 9
14 Kolkata 9/9 10
15 Delhi 11/11 19
39I. SITUATIONAL ANALYSIS
Primary data collected by the authors from Delhi (Table 4 and Figure 18) and
Coimbatore (Figure 19 and Figure 20) illustrate the extent of polluted surface and
groundwater in these both cities, corroborating the BIS report.
Table 4: Primary Data on Bacteriological Tests in
Groundwater Samples Collected from Delhi
SITE NAME WATER SOURCE TOTAL COLIFORM FECAL COLIFORM
Khanpur Tube Well 90 4
Kanjhawala Tube Well Nil Nil
Narela Tube Well Nil Nil
Jagatpur Gaon Tube Well 130 6
Baprola Tube Well Nil Nil
Rajouri Garden Tube Well Nil Nil
Ferojshah Kotla Tube Well Nil Nil
Dhansa Tube Well Nil Nil
Kanganheri Tube Well Nil Nil
Mahipalpur Tube Well 11 Nil
Greater Kailash Tube Well 2 Nil
Bhatti Khurd Tube Well Nil Nil
40I. SITUATIONAL ANALYSIS
Figure 18: Electrical Conductivity Values
in Delhi’s Groundwater
Source: Authors’ own based on primary data collection.
41I. SITUATIONAL ANALYSIS
About one-third of Delhi has groundwater (and some surface water) with electrical
conductivity (EC) values higher than 3000 micro-mhos/cm (see Figure 18), making
it unusable, as per GEC 2015 norms.95 Higher EC values in the groundwater are
correlated to contamination from potential sewage or effluent sources infiltrating
from the surface. Most of Delhi is thus experiencing severe groundwater quality
concerns.
Figure 19: Total Dissolved Solids Distribution
in Phreatic Aquifer of Coimbatore
Source: Authors’ own based on primary data collection.
42I. SITUATIONAL ANALYSIS
Figure 20: Upper Aquifer Electrical Conductivity Distribution
in Coimbatore
Source: Authors’ own based on primary data collection.
The central and northern part of Coimbatore show higher levels of pollution and
correspondingly high total dissolved solids (TDS) and high electrical conductivity values
(See Figures 19 and 20). The high TDS and EC values are correlatable to potential sewage
and industrial effluent contamination through unlined stormwater channels in the city.
Primary and secondary hydro-chemical data indicate that the sub-potability of water
quality in Indian cities are primarily caused by humanmade factors, resulting in the
mixing of untreated wastewater with freshwater sources. Much of the stormwater
urban streams have been converted into unlined sewage and effluent channels. These
stormwater streams also receive significant solid waste dumps, which eventually get
dissolved, thereby increasing the toxicity in the surface and groundwater.
Analysis of groundwater in Coimbatore suggest a significant deterioration in quality,
with moderate to high levels of physical parameters like pH, EC, TDS and alkalinity;
cations like calcium, magnesium, potassium; and anions like chloride and sodium.96
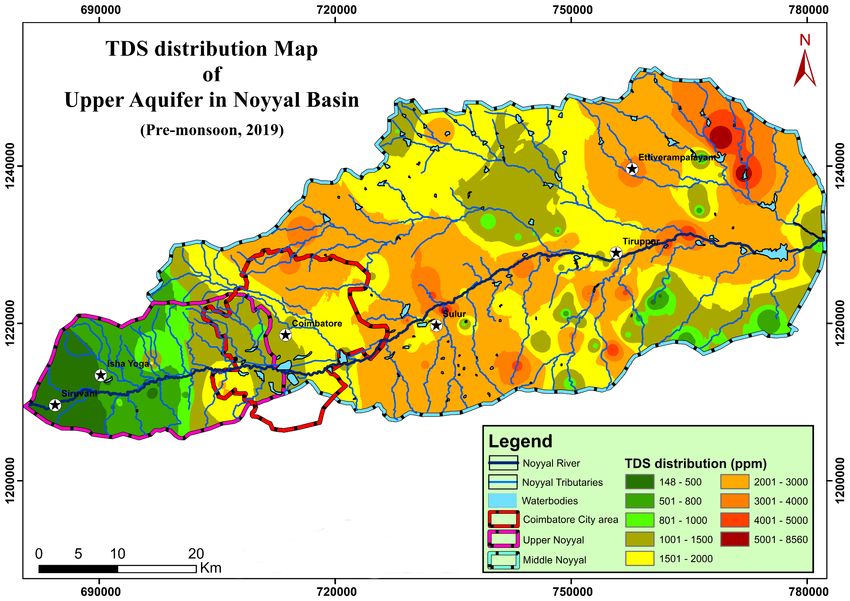
The pre-monsoon TDS map of surface and groundwater primary data sampled from
Coimbatore shows an extraordinarily high TDS range of 1000 to > 4500 ppm, confirming
significant pollution load in the water (see Figure 21).
43I. SITUATIONAL ANALYSIS
Figure 21: Total Dissolved Solid Dispersion Map Of Noyyal Basin
Prepared For The Phreatic (Upper) Aquifer Groundwater Sample Data
Source: Authors’ own based on primary data collection.
The water quality deterioration in the urban regions of the Noyyal Basin indicates
that pristine clean water from the Western Ghats (western portion of the map) flows
down and acquires a significant pollution load in Coimbatore, Tiruppur and Erode
cities, and potentially transferring a significant pollution load into the groundwater
systems (see Figure 21).
Secondary data on the microbial quality of drinking water in Bengaluru suggest
that up to 90 percent of water available to the city’s peri-urban localities is unfit for
human consumption, as per World Health Organization (WHO) standards.97 High
TDS, calcium, magnesium, alkalinity and hardness in source water in the city is of
unacceptable potable quality.98
The groundwater quality of shallow phreatic unconfined aquifers in cities across
India is a major cause for concern. Uncontrolled and poorly designed borewells in many
cities have also punctured and connected the polluted top aquifers to the confined
aquifers below. Confined aquifers, once polluted, are extremely difficult to remediate.
Many cities are seeing the progressive pollution of urban aquifers due to a continuous
increase in the nutrient and heavy metals loads from multiple sources. The remediation
of polluted aquifers is a complex, expensive and time-consuming process.
44I. SITUATIONAL ANALYSIS
W
Changes in the Urban Water Demand
hile the average per capita availability of water has reduced, the
demand for water for modern living has continually increased.
Gadgets like washing machine, dishwashers, modern showers
and flush toilets and centralised air conditioner systems require
significantly more water than what was needed in an average household a few
decades ago. These changes in living standards have also contributed to increasing
water divide and inequity in urban societies. The WHO classifies the supply and
access to water in four service categories: no access (water available below five
litre per capita per day, or lpcd); basic access (average approximately 20 lpcd);
intermediate access (average approximately 50 lpcd); and optimal access (average
of 100-200 lpcd).99 Some Indian cities report a per capita freshwater availability of
75 to 100 lpd for approximately 85 percent of their population and up to 200 lpd or
more for the remaining 15 percent.100
Table 5: Activity-wise Distribution of Water Consumption in Cities
(Percent of Total Consumption by Households Day)
AHMEDABAD
HYDERABAD
ALL 7 CITIES
MADURAI
KOLKATA
MUMBAI
KANPUR
DELHI
ACTIVITY
Bathing 28.2 31.7 23.7 37.1 25.6 29.1 22.8 26.6
Washing Clothes 18.6 14.2 24.3 14.0 20.9 16.3 21.4 18.9
Drinking 4.2 5.0 4.2 2.6 4.3 3.8 4.9 4.9
Cooking 4.2 5.0 4.2 2.6 4.3 3.8 4.9 4.9
Toilets 3.0 3.7 1.7 2.3 3.1 3.2 3.3 4.2
Cleaning House 20.0 16.5 21.6 15.9 24.1 20.1 19.1 25.7
Washing Utensils 7.3 7.0 6.6 11.7 3.5 5.7 12.4 1.9
Others 2.4 5.6 .5 0.3 2.0 6.3 0.9 1.7
TOTAL 100.0 100.0 100.0 100.0 100.0 100.0 100.0 100.0
Source: Shaban and Sharma, 2007.101
45I. SITUATIONAL ANALYSIS
BIS suggests a per capita need of 200 litres per day for a modern housing unit
with full flushing systems,102 while IS 1172-1993 (code of basic requirements for
water supply, drainage and sanitation)103 suggests a minimum water requirement
of 135 litres per day for economically weaker sections of society. None of the
four reference cities in this study meet the BIS requirements of per capita water
availability (see Table 5). Since various agencies recommend different quantities
of water for domestic use, a benchmark of 100 lpcd consumption (or availability,
as consumption is determined by availability) has been set to identify water deficit
households.104 Available data indicates severe water inequity in India between
different economic classes (see Table 6). Multiple indigenous innovations on
house utilities will be needed to optimise water demand and usage and promote
sustainability and water equity.
Table 6: Area-wise Consumption of Water Per Household
and Per Capita Per Day
PER HOUSEHOLD PER CAPITA
AREA N
Std Std
Mean Mean
Deviation Deviation
High income
group (HIG) areas
402.5 230.3 99.9 59.8 551
with well-planned
building
Middle income
group (MIG) areas
396.4 248.6 94.2 57.6 571
with well-planned
building
Low income group
(LIG) areas with
393.5 176.4 90.2 40.6 552
well-planned
building
Slum areas 398.7 216.8 81.9 41.1 530
Others (mixed
400.5 222.0 91.3 53.1 530
areas)
TOTAL 398.3 220.2 91.6 51.5 2734
Source: Shaban and Sharma, 2007.105
46I. SITUATIONAL ANALYSIS
I
Urban Water Balance
n Chennai, Bengaluru, Coimbatore and Delhi, raw water flows through a linear
supply and value chain from the source to the consumers, and the generated
wastewater is eventually discharged downstream through the urban drainage
system (see Figure 22). The raw water is brought from a captive storage to the
cities through pipelines, stored locally and chlorinated and distributed to consumers.
The sewage is discharged into either centralised or decentralised channels leading to
centralised or decentralised sewage treatment plants (STPs) or discharged directly
into the local stormwater drainage channels. Post-treatment, the sewage is mostly
released into stormwater drainages leading to an urban lake (water body) or out of
the city through urban stream. Effluents too are either treated through centralised or
decentralised effluent treatment plants (ETPs) or released without any clean up (only a
few industries have adopted zero liquid discharge, or ZLD, protocols).
Figure 22: Urban Water Value Chain from Source to Discharge
Note: The primary focus of urban water management systems in Indian cities is water supply to consumers. In the four reference
cities, groundwater supply, although a significant component of total supply, is considered a supplementary source. Only part of the
discharged grey or black water is STP/ETP treated, to be discharged back into the urban stormwater drainages. Processes that are
almost fully accounted are shown stippled in blue, while processes that are partially accounted for are shown diagonally hatched in
blue. The processes that are not accounted for in the urban water value chain are in unshaded boxes.
47You can also read