Is the Island Bay-City Cycleway a valid approach to Climate Change Mitigation? - A report submitted as part of the 4th year Public Health Project
←
→
Page content transcription
If your browser does not render page correctly, please read the page content below
Is the Island Bay-City
Cycleway a valid approach to
 Climate Change Mitigation?

A report submitted as part of the 4th year
          Public Health Project
                                   Group A1
                                   8/8/2014

       http://www.bizjournals.com/austin/news/2012/06/01/austin-getting-more-protected-bike-lanes.html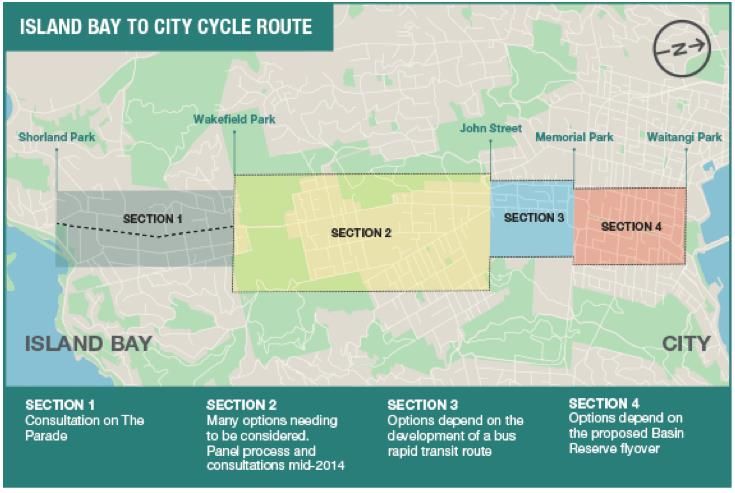
Abstract

Climate change is going to negatively impact every person on the planet. There are several
international agreements which aim to mitigate climate change; the most significant of these
is the Kyoto Protocol, under which NZ appears in line with suggested emissions reduction
targets. However, some believe these targets are too conservative and that climate change
will continue to escalate unless drastic measures are taken. NZ was discovered to be a
significant contributor to global greenhouse gas emissions, and a major portion of those
emissions arose from the transport sector. Emissions from the transport sector have been
shown to be highly amenable to modification, and therefore a key target for policy. There are
specific health benefits associated with reducing climate change via active transport policies
such as implementing cycleways, but while Wellington Regional and City councils show a
strong support for mode shift, there is a relative lack of action.

The proposed Island Bay to City Cycleway in Wellington has been contentious, especially with
regards to the second stage which passes through Newtown; many Newtown business owners
signed a petition against it. We performed a case study on the perceptions of the Newtown
business owners towards the Southern Suburbs to CBD Cycleway. We interviewed business
owners until saturation, and performed qualitative analysis to elicit key themes. Cyclists’
safety, the negative impact on business, and uncertainty of uptake were major themes.
Literature suggests that a cycleway is in fact likely to increase safety, either improve or have
no negative effect on businesses, and dramatically increase cycling uptake in the area.
Another more general theme was information disparity. It became evident that the underlying
cause of the opposition by business owners was inadequate communication between policy
makers and stakeholders. Improving communication is key to progress in implementing such
climate change-mitigating policies.

                                                                                              ii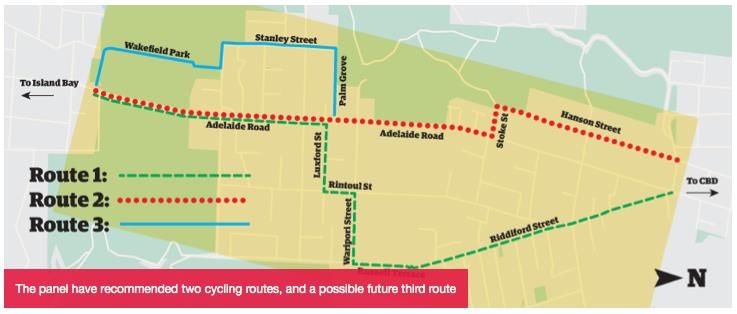
Acknowledgements

We would like to thank all of the Newtown business owners who participated in this research.
Thank you also to Ed Randal, Tom Pettit, Hilleke Townsend, Patrick Morgan, Jean Beetham,
Peter Gallagher, Cycle Aware Wellington and the Public Health Department (University of
Otago, Wellington Campus) for your assistance throughout the project.

Lastly, thank you to our supervisors Caroline Shaw and Simon Hales for your guidance and
support. You have made this project a fun and engaging experience.

                                                                                          iii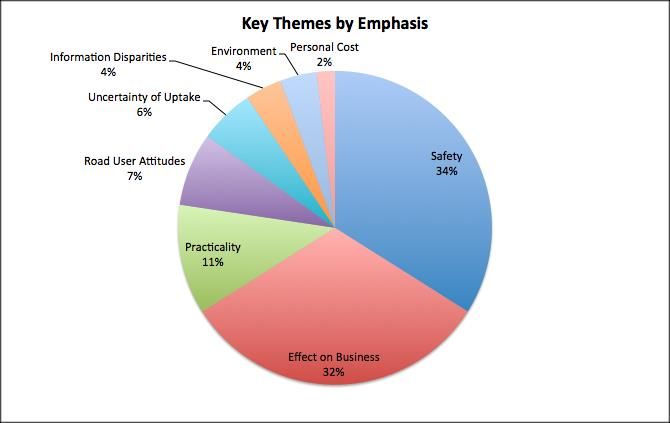
Table of Contents

Abstract......................................................................................................................................... ii
Acknowledgements ..................................................................................................................... iii
Table of Contents......................................................................................................................... iv
Table of Figures............................................................................................................................ vi
1      Chapter 1: Climate Change ................................................................................................... 1
    1.1        The Kyoto Protocol ....................................................................................................... 2
    1.2        The New Zealand Context............................................................................................. 3
2      Chapter 2: Health Co-benefits of Mitigating Climate Change .............................................. 5
    2.1        Anthropogenic Air Pollution ......................................................................................... 5
    2.2        Physical Activity and Non-Communicable Diseases ..................................................... 7
    2.3        Safety ............................................................................................................................ 9
    2.4        Equity ............................................................................................................................ 9
3      Chapter 3: Transport Policies to Mitigate Climate Change ................................................ 11
    3.1        International Transport Policy .................................................................................... 11
       3.1.1           Environmentally Sustainable and Healthy Urban Transport (ESHUT) (45): ........ 12
       3.1.2           Arequipa, Peru (45):............................................................................................ 13
       3.1.3           ‘Bicing’ Barcelona, Spain (39): ............................................................................ 13
       3.1.4           Aguascalientes, Mexico (45): .............................................................................. 13
       3.1.5           European Union (41):.......................................................................................... 13
    3.2        National Transport Policy ........................................................................................... 14
       3.2.1           Policies regarding transport modeshare in NZ ................................................... 14
       3.2.2           Broader national policy relevant to cycling ........................................................ 15
    3.3        New Zealand Political Party Policies on Climate Change ............................................ 15
       3.3.1           National Party: .................................................................................................... 16
       3.3.2           Labour Party:....................................................................................................... 16
       3.3.3           Green Party: ........................................................................................................ 16
       3.3.4           Maori Party: ........................................................................................................ 17
    3.4        Summary ..................................................................................................................... 17
4      Chapter 4: The Wellington Context .................................................................................... 18
    4.1        Wellington City Emissions........................................................................................... 19
    4.2        Climate Change Mitigation in Wellington................................................................... 20
       4.2.1           Climate Change Mitigation through the Transport Sector ................................. 21

                                                                                                                                                 iv
4.3      Mode Shift towards Cycling ........................................................................................ 22
      4.3.1         Region’s Plans for Cycling ................................................................................... 24
      4.3.2         City’s Plans for Cycling ........................................................................................ 25
    4.4      Island Bay Cycleway .................................................................................................... 26
    4.5      General Barriers to Cycling in Wellington................................................................... 29
      4.5.1         Cycling Demand and Uptake............................................................................... 29
      4.5.2         Cycling Safety ...................................................................................................... 31
      4.5.3         Equity .................................................................................................................. 33
5     Chapter 5: The Case Study .................................................................................................. 37
    5.1      Introduction ................................................................................................................ 37
      5.1.1         Aims .................................................................................................................... 38
    5.2      Methods...................................................................................................................... 38
      5.2.1         Data Collection.................................................................................................... 38
      5.2.2         Data Analysis ....................................................................................................... 39
    5.3      Findings ....................................................................................................................... 39
      5.3.1         Frequency ........................................................................................................... 39
      5.3.2         Emphasis ............................................................................................................. 40
      5.3.3         Key Themes ......................................................................................................... 41
    5.4      Discussion ................................................................................................................... 46
      5.4.1         Key Themes ......................................................................................................... 46
      5.4.2         Communication................................................................................................... 50
      5.4.3         Responsibility ...................................................................................................... 51
      5.4.4         Accessibility and Equity....................................................................................... 51
      5.4.5         Strengths and Limitations ................................................................................... 53
      5.4.6         Ethical Considerations ........................................................................................ 54
    5.5      Conclusion................................................................................................................... 55
6     References .......................................................................................................................... 57
Appendix A          Interview Analysis Template ............................................................................. A-1

                                                                                                                                              v
Table of Figures
Figure 1: New Zealand's greenhouse gas emissions in 2012 (by sector, in million tonnes of CO2
equivalent) (16) 4
Figure 2: The four sections of the Island Bay to city Cycle Route [adapted from (83)] 27
Figure 3: Proposed cycle routes for section 2 of the Island Bay to City cycleway [adapted from
(90)] 28
Figure 4: Newtown Business Owners' Questionnaire 39
Figure 5: The frequency of themes mentioned across all interviews 40
Figure 6: Emphasis placed by Newtown business owners on the key themes 41
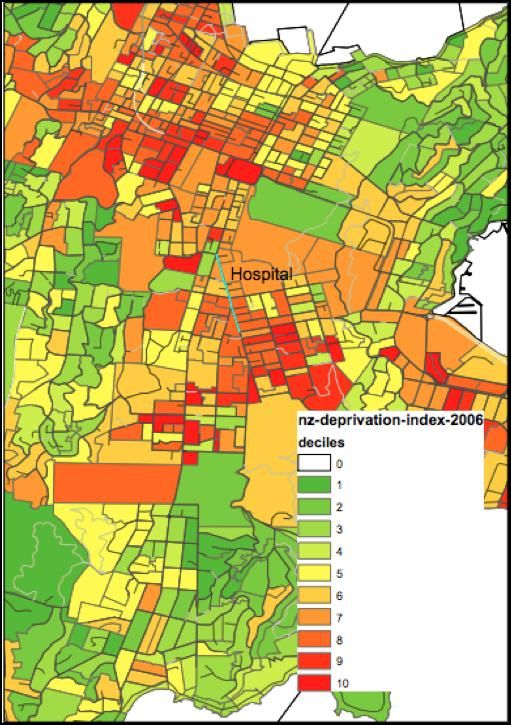
Figure 7: Deprivation Index for Wellington (New Zealand Deprivation Index 2006) 53
vi1 Chapter 1: Climate Change
Climate change is arguably the most significant health threat to face the world in the 21st
century (1). Climate change already accounts for a significant proportion of disease; in 2005
the World Health Organization (WHO) estimated that the changes in climate over the previous
30 years had directly accounted for more than 150,000 deaths. Most of these deaths have
occurred in developing countries (2). People in the poorest countries, who incidentally have
contributed the least to greenhouse gas production, will experience the worst effects (3).
Current international models used by the WHO estimate that climate change-associated
mortality and morbidity will double by 2030 (2). Negative health effects are expected as a
result of changes in temperature, precipitation, soil moisture and sea level (4). Direct effects
on health include those as a result of increased extreme climatic events, such as droughts and
flooding. There are also many indirect effects that implicate global health, through changes to
food and water availability, land availability, population displacement/migration, national
stability and geography of disease distribution. Many vector-borne diseases, including malaria
and dengue fever, have been shown to have alterations in their area of viability due to
temperature changes (5,6).
Despite the significance of this issue, it appears that the global community has been slow to
respond. The United Nations Environment Programme and the World Meteorological
Organisation set up the Intergovernmental Panel on Climate Change (IPCC) in 1988 (7,8). The
aim of the IPCC was to provide an objective assessment of current scientific data on climate
change, with the intent of developing pragmatic response strategies (8). The first assessment
report of the IPCC confirmed that the build-up of carbon dioxide, methane,
chlorofluorocarbons and nitrous oxide in the atmosphere had resulted in a global greenhouse
effect, and had been substantially increased by human activity. The report also predicted that
the levels of carbon dioxide in the atmosphere would double by 2025-2050, and that there
would be an associated increase in the average global temperature of 1.5⁰C - 4.5⁰C (9).
This information was instrumental in the formation of the first international agreement on
greenhouse gas emissions: the 1992 United Nations Framework Convention on Climate
Change (UNFCCC) (10,11). This agreement recognised the human contribution to climate
change, and aimed to restrict greenhouse gas emissions to a level that would prevent further
1anthropogenic1 climate interference (12). This seemed like a lofty goal, and the second IPCC
assessment report of 1995 suggested that international emissions-reduction targets were
inadequate under the UNFCCC. The report also showed a continued increase in greenhouse
gas levels in the atmosphere. It predicted that carbon dioxide emissions would need to drop
to 1990 levels within 40 years, were carbon levels to remain anywhere close to the levels prior
to industrialisation (4). As a response to this, the United Nations introduced the Kyoto
Protocol in 1997, a contract whose purpose was to fortify the UNFCCC (13).
1.1 The Kyoto Protocol
The Kyoto Protocol is a binding international agreement, linked to the UNFCCC, which
obligates its parties to follow set emission-reduction targets (13,14). The quota of 55 ratified
nations was reached when Russia signed in late 2004, and the protocol entered into force in
early 2005. The protocol places more stringent reductions on developed nations, recognising
their disproportionate contribution to global emissions (14). Two commitment periods were
outlined in the protocol: the first from 2008 to 2012, and the second from 2013 to 2020.
During the first commitment period, 37 industrialised nations and various European countries
agreed to a 5% reduction in greenhouse gas emissions against 1990 levels. During the second
commitment period a reduction of 18% against 1990 levels was agreed to, however the
composition of nations in this period was different to the first (13). These targets were
designed to be met primarily through national reductions.
Alternate pathways to meet targets are also included in the protocol, in the form of three
market-based mechanisms. The first mechanism, “joint implementation”, allows a
participating nation to earn emissions-reduction units via investment in an emissions-
reduction scheme in another participating nation. The second mechanism, “clean
development”, allows a participating nation to earn emissions-reduction units through
instituting an emission-reduction project in a developing nation. The third mechanism,
“emissions trading”, allows those nations in emissions-deficit to trade their assigned amount
of units, or carbon credits, to nations in emissions-surplus (13).
New Zealand (NZ) ratified the Kyoto protocol in 2002, and agreed to an unconditional target of
a 5% reduction in emissions against 1990 levels, by 2020. During the first commitment period,
1
Anthropogenic = created by people or caused by human activity
2NZ's target was to limit emissions to an average of 1990 levels each year (15). NZ’s position
under the Kyoto Protocol is provisional, awaiting international review by the UNFCCC in late
2014; however, the Ministry for the Environment anticipates NZ will meets its targets for the
first commitment period, when carbon removal from land-use reforms and forestry are taken
into account (16). A surplus of 90.8 million carbon credits is predicted, with a value of
approximately $27 million dollars (17).
1.2 The New Zealand Context
Although in a carbon credit surplus in 2012, NZ was the fifth highest greenhouse gas emitter
per capita in the developed world (16). NZ’s greenhouse gas emissions have increased by 25%
between 1990 and 2012; this also represents one of the largest increases in gross emissions
among developed nations (1,16).
NZ emissions were confined to four main areas: agriculture, energy, industrial processes, and
waste. The proportional contribution from each area fluctuates from year to year, however in
2012 the contributions were 46%, 42%, 7%, and 5% respectively (see Figure 1 below) (16).
Since 1990, agriculture has, on average, been the most significant source of emissions,
although its proportional contribution has declined since 1990 (18). This reflects the significant
increases that have occurred in the energy sector. Energy sector emissions have increased by
over a third during the 1990 to 2012 period, and levels surpassed those from the agriculture
sector in 2008 (16). Subsequent to 2008, the energy sector fell behind the agriculture sector
due to the global recession, favourable milk prices, and investment in renewable energy (18).
However, the relatively large average increase in emissions from the energy sector suggests
that it could be a key target for emissions-mitigation schemes.
The two main sources of emissions in the energy sector are road transport, and public
electricity/heat-production. Road transport is the largest contributor at 38.7%, compared to
19.6% from public electricity. Although public electricity/heat-production has a significant
emissions contribution, NZ’s high reliance on renewable energy renders this contribution
minimal by international standards (18). In contrast to this, NZ has one of the highest rates of
car ownership among OECD countries, with more than 5 cars per 10 people, 25-30 cars per
$1000GDP per capita, and one parking space for every two jobs (18,19).
3Figure 1: New Zealand's greenhouse gas emissions in 2012 (by sector, in million tonnes of CO2 equivalent) (16)
Furthermore, road transport emissions have increased by 68% between 1990 and 2012,
representing one of the top four contributors to NZ’s increasing total emissions (18). In view
of this, the road transport sector is arguably the sector in greatest need of greenhouse gas
mitigation policy in NZ.
42 Chapter 2: Health Co-benefits of Mitigating Climate Change Despite clear evidence of the need to address climate change for long-term international health, barriers such as short-term cost and political viability limit the global response to this issue. Climate change policy within the transport sector can be made more beneficial and cost effective, by including a focus on promotion of active transport. Such policies lead to direct short-term improvements in population health, which in turn lead to improved wellbeing, workplace productivity, and decreased healthcare costs for the community involved (20). Transport policy is made more ‘palatable’ when there are predicted co-benefits for climate change and health (21). This offers a strong incentive for the development and application of dual-oriented policy. Policies that promote modes of active transport, such as cycling, have many direct and indirect effects on health; particularly important are resultant increases in physical activity, and decreases in air pollution (22). Diseases influenced by these factors are highly prevalent in the NZ population therefore policy changes of this nature may be highly beneficial to our national health status. 2.1 Anthropogenic Air Pollution Anthropogenic air pollution is a broad term, which encompasses primary and secondary gaseous pollutants as well as small particles. Primary gaseous pollutants are those emitted directly from combustion sources, key examples are sulfur dioxide (SO2), nitrogen oxides (NO and NO2) and carbon monoxide (CO). Secondary gaseous pollutants are formed in the atmosphere from directly emitted pollutants; the most important of which is ozone (O3). There are also many particles in the atmosphere, which are small enough to be inhaled into the lung. Particulate matter (PM) is a term used worldwide in estimations of the concentration and effects of these small pollutant particles. Particulate matter has been studied extensively and has been consistently linked to serious health effects. It is considered to be a useful indicator of total air pollution. The main particle sizes implicated in human disease are PM10 (
Anthropogenic air pollution is a significant cause of morbidity and mortality; the majority of
which results from increased respiratory and cardiovascular disease (24). In NZ it is estimated
that anthropogenic air pollution is annually responsible for: 1,175 premature deaths, 607
extra hospital admissions and 1.49 million days of restricted activity due to respiratory and
cardiac illness (23). Because of to the nature of air pollution, this effect is generally described
as a concentration-response relationship (24). Exposure is in relation to a defined area rather
than to an individual person. There is a great deal of evidence to support the specific effects of
particulate matter, particularly PM10. Areas with medium or high exposure to PM10 have a
15% and 18% respective increase in mortality due to respiratory disease (25). This association
between air pollution and cardiopulmonary disease is supported by many international
studies. For example, a cohort study of six US cities found that people living in the most
polluted city had an adjusted mortality-rate ratio of 1.36 compared to people living in the
least polluted city (26).

Children are a group of the population significantly affected by air pollution; it is estimated
that for every 10μg/m3 increase in the concentration of PM10, there is a 1% increase in daily
mortality of 0-4 year old children due to acute respiratory infection (24). Air pollution also has
an impact on adult health; an American Cancer Society study shows that for every 10μg/m 3
increase in the concentration of PM2.5, there is a 6% increased risk of cardiopulmonary
mortality and an 8% increased risk in lung cancer mortality (27). Ethnic disparities must also be
considered, as Maori, in particular, are disproportionately represented in the adult premature
mortality figures. 18.3% of air pollution related mortality is in the Maori population; a
significant over-representation given that Maori are only 8.7% of the total adult population.
This is consistent with the increased exposure to air pollution, the PM10-mortality exposure-
response function for Māori is nearly three times that of the whole adult population (28).
However, the confidence intervals for the Māori adult and all adult response functions overlap
so this finding may not be statistically significant. Regardless, it is of concern as this subgroup
already experiences poorer health outcomes (23).

A reduction in anthropogenic air pollution has the potential to have significant health benefits
for the NZ population. One strategy to achieve this, which has been successfully demonstrated
internationally, is to target transport policy: particularly with the aim of reducing motor
vehicle usage (6,29). A NZ based study has shown that shifting 5% of vehicle kilometres to
cycling would reduce vehicle travel by approximately 223 million kilometres each year. This is

                                                                                                 6
predicted to annually save about 22 million litres of fuel and reduce transport-related
greenhouse emissions by 0.4%. Of note, the health effects of this reduction would include
approximately six fewer deaths per year, attributed directly to a reduction in local air pollution
(6).
The benefit of shifting towards active transport modalities is supported internationally.
Modelling studies of the large London and Delhi populations assessed the effects of air
pollution with the current emissions projection and compared this with interventions to
reduce emissions. Switching to low emission cars was shown to directly reduce air pollution
and lead to a saving in disability-adjusted life years (DALYs),2 in both cities. Switching motor
vehicle transport to active travel, including cycling, was shown to have a far greater benefit in
terms of air pollution and the DALYs it accounted for. With the assumption of “a doubling of
the total distance walked, and an 8 fold increase in cycling from the very low baseline levels,”
the London modelling assessment estimated an annual saving of 7332 DALYs and 530
premature deaths per million population (29).
2.2 Physical Activity and Non-Communicable Diseases
Rates of non-communicable diseases currently faced by the NZ population can be significantly
improved by regular physical activity; these include obesity, diabetes, cardiovascular disease,
many types of cancer, and depression (29,30). Physical inactivity is an increasing problem in
developed countries, and is now estimated to be the “fourth leading cause of death
worldwide” (31). Rates of physical activity in NZ are low, with only 52% of the population
meeting the baseline recommendations of 30 minutes 5 times per week. Physical activity
levels are even lower in the Māori population, with just 47% of people meeting the baseline
requirements (32).
Physical inactivity, or low physical activity, was shown to account for 2.8% of DALYs in 2010,
and about 3.2 million deaths (30). Inactivity directly accounts for 10% of breast and colon
cancers, 7% of diabetes, and 6% of chronic heart disease (33). These diseases all account for a
significant proportion of poor health in NZ.
2
Disability Adjusted Life Years (DALYS) are a way of objectively quantifying disease burden, in terms of
mortality and morbidity. One DALY can be considered as the loss of one healthy year of life. This is a
useful economic tool, which allows comparison between different disease states. (109)
7The Ministry of Health Annual survey found that 31% of NZ adults are obese, and a further
34% are overweight. Furthermore, there is a substantial inequality within the distribution of
this disease; 48% of Māori and 68% of Pacific adults are obese.3 Diabetes rates are high in NZ,
affecting 5.8% of all NZ adults; disease rates are also higher in the non-European population,
with a prevalence of 7.8% in Māori, and 12.5% in Pacific Islanders. Rates of Ischaemic Heart
Disease (IHD) are also high; 5% of NZ adults are currently diagnosed with this condition. Again,
the distribution of disease shows marked inequalities; men are 1.7 times as likely as women,
and Māori 1.8 times as likely as non-Māori to develop IHD (32).
The low rates of physical activity in NZ, and the potential health benefits of increasing them,
show a need for the development of physical activity-oriented policy. Worldwide
interventions to improve physical activity show that such initiatives are more effective when
partnered with other agencies, including the transport sector. Policy targeting urban design
and infrastructure is an efficient way to increase the physical activity of a community (34).
An important determinant of the success of such interventions is their role in addressing the
obesogenic environment. In the context of physical activity, this refers to the availability of
safe and enjoyable environments, including parks, sports grounds, and also activity centres
such as gyms and swimming pools. Individuals from safe, connected neighbourhoods were
found to do more physical activity, and were less likely to be obese, than individuals from
more deprived neighbourhoods (35). Therefore, to ensure that development of infrastructure
has a positive effect on equity, the deprivation and availability of resources in different areas
needs to be considered. These suggested methods to improve the rates of physical activity in
NZ align well with the international Ottawa Charter for health promotion. Objectives of this
document include building healthy public policy, creating supportive environments,
strengthening community actions, and developing personal skills (36).
Cycling has been shown to be an effective way to improve physical activity, and can be
promoted by transport policy changes targeting climate change mitigation. Rates of cycling in
NZ are particularly low, accounting for less than 1% of total trips under 7km. This is a decline
from the 1990’s, where cycling was estimated to be the mode of transport for 3.6% of short
total trips. An Auckland based study estimated the national health effects of shifting 5% of
short trips currently taken by cars to bicycles (6). This transition was shown to save 116.5
3
High Body Mass Index (BMI) itself accounts for 3.8% of global DALYs (32)
8deaths, and annual health costs of $200 million dollars. International evidence from a recent
American study showed that a cycleway costs around $235 (USD) per user annually, but has
medical savings of $622 per person due to the increased engagement in physical activity. This
shows it is both an energy and financially-efficient way to travel (37).
2.3 Safety
An increase in cycling also has potential health risks, the main risk being the potential increase
in traffic accidents. Multiple international and national studies have demonstrated that the
substantial health improvements far outweigh the effect of an increase in traffic accidents
(6,38,39). Despite this, fear of injury or death from cycling in a ‘car-dominant’ city, has been
shown to be a strong psychological barrier to cycling uptake (40).
Shifting 5% of short trips taken by vehicles to cycling is predicted to increase the total number
of annual hospital discharges in NZ from 77 to 109, with fatalities increasing from 3.5 to 5 per
year. However, there is a ‘safety-in-numbers’ effect, whereby the risk-benefit ratio improves
with a greater level of cycling. As the level of cycling increases, the proportion of people
getting injured will decline. “It’s estimated that a doubling in the prevalence of cycling is
associated with approximately a 34% reduction in death rate per km cycled” (6). Interventions
that increase the safety of cycling, including implementation of infrastructure such as
cycleways, can decrease the risk of injury, and also reduce the psychological barrier to cycling.
Part of the ‘safety-in-numbers’ effect is attributable to the increased infrastructure that
supports large cycling populations. Motor vehicles are implicated in most serious cycling
injuries in NZ, and as described by Macmillan et al., “those involving a light vehicle are
amenable to changes in commuting patterns.” A considerable increase in cycling can directly
reduce vehicle numbers on the road, therefore leading to a reduction in motor vehicle
accidents (40). It is likely that this would also improve the perception of cycling and cycle
safety.
2.4 Equity
Māori and Pacific populations often carry a higher burden of disease. If implemented
appropriately, transport policy could help reduce this extra burden on Māori and Pacific
peoples. Cycling is an economical form of transport, costing less than private car or public
9transport. International data suggests cycling is a particularly equitable form of transport, with
similar rates across all income groups, in countries with high levels of cycling, such as Germany
or the Netherlands, and in countries with low rates comparable to those of NZ, including the
U.S. and U.K. (41). Māori and Pacific people are over-represented in the more deprived areas
of NZ, where it is known that the environment is generally less supportive of physical activity
(35). This means that the location of infrastructure is an important consideration when
developing transport policy.4
4
Equity is discussed further on pg. 33, particularly in the context of Wellington, and in the discussion on
pg. 51.
103 Chapter 3: Transport Policies to Mitigate Climate Change
Modifying current and future transport policy is vital for the mitigation of greenhouse gas
emissions. According to the IPCC, growth in the transport sector has the potential to outweigh
all mitigation measures unless transport emissions can be decoupled from economic growth
(42). However, in the realm of personal transport activity, there is continuing and ever-
expanding growth and impact. The matter is further complicated by the reality that transport
has become enveloped in a complex matrix of economic, political, social, spatial and
technological influences (43).
So, how then can governing bodies best tackle this problem? Banister et al suggest a
sustainable mobility paradigm. This involves an approach to policy focused on:
the reduction in the need for transport
promotion of modal shift
land use and planning
increasing the efficiency of vehicles through the advancement of technologies (44)
3.1 International Transport Policy
The notion of modal shift, in particular, claims much support internationally. It calls for
transport policy measures that will result in a reduction in car use through the promotion of
public transport, walking and cycleways, effectively creating a new transport hierarchy (44).
However, while passenger transport is acknowledged as a significant sector in terms of
greenhouse gas production, it is not, in any way, an easy topic to address. As has been
mentioned, there is a complex web of influences at play. For modal shift, individual behaviour
and attitudes remain a considerable barrier to successful implementation of policy. Rajan
considers solutions for this matter falling into two broad categories: structural and
motivational (43). Structural policies attempt to alter the environmental context in which
decisions about transport are made. They can be further subdivided into ‘push’ or ‘pull’
measures which change peoples’ transport behaviours:
‘Push’ measures attempt to promote modal shift by increasing the cost or decreasing
the availability of personal vehicle usage. Examples of such policy measures include
11increased fuel and vehicle taxes, road tolls, priced parking, vehicle-free zones and car-
free days.
‘Pull’ measures attempt to promote modal shift by providing financial incentives for
reduced vehicle use and offering attractive alternatives. Examples of such policy
include the development of well-designed and efficient public transit options, reduced
fares for public transit, improved walking and cycling infrastructure, road space
reallocation or promoting car sharing. (43)
Meanwhile, motivational approaches rely on information provision, social modelling,
conformity pressures and the shifting of norms to encourage individual and societal behaviour
change. Measures include advertising and educational campaigns, role model endorsement
along with positive promotion of alternative transit options, employee or community
programmes encouraging cycling uptake and so forth (43).
Overall, it is clear that the transport sector, in particular personal transport, has an important
role to play in the mitigation of climate change. As Banister et al have demonstrated, there are
many ways in which policy can be used to facilitate this role. In particular, policy aimed at
encouraging modal shift has gained much international support. There are countless examples
of international, national and local governing bodies developing and utilizing such policies to
promote modal shift; we shall outline a few examples here.
3.1.1 Environmentally Sustainable and Healthy Urban Transport (ESHUT) (45):
ESHUT is a WHO co-sponsored initiative in Asia and the Western Pacific. It demonstrates how
international bodies have become involved in policy promotion and development. It aims to
address greenhouse gas emissions, air and noise pollution, road traffic injuries and second-
hand smoke; as well as increasing opportunities for physical activity and encouraging health
and social equity by ensuring safe and equal access to urban public transport. ESHUT
promotes the sustainable mobility paradigm and thus has been involved in a number of
activities promoting modal share. Examples of such activities include a focus on making bicycle
friendly cities via the provision of cycle lanes, cycle rental services and bicycle parking
facilities.
123.1.2 Arequipa, Peru (45):
The city of Arequipa has reorganised its transport system with the major goals of reducing
greenhouse gas emissions from transport sources and addressing key public health issues
(such as traffic-generated air pollution, injuries and barriers to healthy physical activity). Policy
has been multifaceted and incorporates a modified public transport system with a modernised
low emission fleet, as well as the development of new cycling and walking infrastructure.
3.1.3 ‘Bicing’ Barcelona, Spain (39):
Bicing is a bicycle-sharing program initiated in Barcelona, Spain in March 2007 in an attempt
to encourage modal shift through promoting and improving access to cycling as an alternative
form of transport. The program has proven to be incredibly successful and a study by Rojas-
Rueda et al has shown that low cost public bicycle sharing systems aimed at encouraging
commuters to cycle are worth implementing in other cities, not only for the health benefits
but also for potential co-benefits such as a reduction in air pollution and greenhouse gases.
3.1.4 Aguascalientes, Mexico (45):
The city of Aguascalientes, Mexico has taken to urban design policy to tackle transport issues
resulting from increasing sprawl, high personal transport use and inefficient public transport
networks. City policy makers and developers have planned a new development for 40,000
residents that will address structural factors via the completion of higher density, wider
sidewalks, 9 km of bike lanes and better parking distribution, as well as redesigned
intersections and traffic calming on main streets. Planners project that the development will
lead to a substantial increase in the proportion of local trips made on foot or bicycle, and trips
to destinations outside the community that are made by public transport will increase.
3.1.5 European Union (41):
An analysis by Pucher and Buehler has demonstrated the successes of the Netherlands,
Denmark and Germany in implementing policy that has led to significant modal shift within
their populations. They have outlined how a multifaceted approach to transport policy is
13required for such success. Elements of structural (both push and pull measures) and
motivational measures are clearly utilised. These included:
provision of separate cycle facilities in the form of cycleways
traffic calming measures
cycle rights of way in road rules
promotional events to boost enthusiasm for cycling
public education and training
taxes and restrictions on car ownership and use
land-use policies, ensuring more bikeable trips are made possible
They found that the most important approach to making cycling safe and convenient in Dutch,
Danish and German cities is the provision of separate cycling facilities.
3.2 National Transport Policy
The New Zealand Transport Strategy aimed to have an affordable, integrated, safe and
sustainable transport system by 2010. This included an integrated mix of transport modes to
ensure environmental stability. The latest NZ Transport agency (NZTA) strategy, has 2 key
features which are consistent with these aims: increase choice of transport modes and reduce
the adverse environmental effects due to land transport (46). This strategy supports the
installation of cycleways, as they encourage both intermodal transport and a reduction
in carbon emissions from private vehicles, thereby helping to create a healthier environment.
In 2006, a Ministry of Transport report, Getting there - on foot, by cycling, was released. This
report discussed potential ways of encouraging cycling and walking in communities around
NZ. It produced three main goals: encourage community environments and transport systems
that support walking and cycling, get more people choosing to walk and cycle, and improve
safety for pedestrians and cyclists. It is important to note that this initiative was subject to
business case approval (47).
3.2.1 Policies regarding transport modeshare in NZ
The majority of road usage is by car drivers, with people aged between 35-64 spending two
thirds of their total travel time driving (48). Vehicles transporting goods for national and
international trade also account for a large proportion of road usage. Public transport has
14moderate uptake in NZ, with 37% of New Zealanders have using this mode of transport in the
past year (49). By contrast, biking accounts for only 2% of total time travelled, demonstrating
its minor role in NZ transportation (50).
NZ infrastructure and city planning, as governed by local and national authorities, has been
largely targeted at car users (51). This emphasis reflects the current use of transport modes in
the NZ population. Although international evidence supports the multiple benefits of modal
share, it is not an option that has had much traction in NZ. Rather, reports have focussed on
reducing congestion and incidence of motor vehicle accidents (52).
The NZ energy efficiency strategy of 2011-2016 also alludes to the importance of promoting
and funding alternative means of transport in NZ. Largely, however, the focus of this report is
on the efficiency of motor vehicles and a more integrated use of rail, sea and airports for
transporting goods to national and international markets (53).
3.2.2 Broader national policy relevant to cycling
The Urban Design Protocol of 2005, written by the Ministry for the Environment, identifies
seven key qualities labelled the seven C’s, which combine to form high quality urban design.
The first aspect is Context, under which the most relevant idea is the consideration of the
health impacts on the population living and working there. Choice is another design concept
that discusses the ability to choose a variety of lifestyle options including mode of transport.
Connections places a high priority on alternative means of transport such as walking and
cycling, and their integration with other transport means, in order to reduce travel time and
reduce environmental impact. Finally, Custodianship places emphasis on the protection of the
environment, with development to help mitigate the effects of man-made hazards (54). These
concepts demonstrate the applicability of cycleways when striving for high quality urban
design.
3.3 New Zealand Political Party Policies on Climate Change
In NZ, the four major political parties are: National, Labour, Green and the Maori Party.
15These parties have a common overall goal of reducing NZ’s contribution to climate change,
and all consider the climate in their policy formation. Each party has a different approach and
degree of focus on this global issue.
3.3.1 National Party:
National policies are largely focused on reducing the government's financial deficit, building a
competitive economy, developing improved public services and rebuilding Christchurch (55).
In regards to natural resources, National plans to explore natural gas and oil deposits, whilst
maintaining environmental standards. This aligns with National’s economic goals. National
does want to increase environmental reporting so that national and regional authorities are
achieving their environmental targets. Infrastructure targets for National involve improving
highways and vehicle access. There are also plans to introduce electric trains in Auckland for
the first time (56).
3.3.2 Labour Party:
Labour plans to build local communities and invest in growth and jobs at a regional level.
There is no specific mention of the projects involved. However, a $200 million investment,
over four years, will go into regional development for projects that create jobs and growth
(57). In addition, Labour has specific policy plans for protecting the environment. These
involve introducing a national policy statement on the protection of water quality in NZ and
increasing marine protection, including reserves. Furthermore, Labour does not want to invest
in lignite development (58).
3.3.3 Green Party:
The green party has many policies regarding climate change and environmental protection in
NZ. These include reducing greenhouse gas emissions to a scientifically credible level for in
prevention of climate change, and aims to benefit current and future generations. The Green
Party believe that climate change mitigation will help to reduce Maori health disparities. The
Green Party also aim to introduce policy that makes ‘polluters’ accountable for pollution
production, through appropriate pricing schemes. Finally, the Green Party believes there is a
need for more investment into research regarding climate change and prevention (59).
163.3.4 Maori Party:
This party supports a NZ free from nuclear power and genetic engineering. Improvement of
public transport, developing sustainable buildings and use of emission free vehicles are all part
of Maori Party policy. The Maori Party plans to introduce cross party conversation regarding
oil exploration in NZ. They also want a moratorium (temporary prohibition) on 1080 poison
drops. Another priority of the Maori Party is mitigating the impact of emissions pricing on low
and medium income consumers through development of affordable and sustainable energy
services for household users (60).
Each governmental party has a different central focus, and range of accompanying policies.
The National Party places greater emphasis on economically oriented policy whereas, the
Green Party is the most environmentally active. Each party approaches climate change and
environment protection with differing levels of emphasis and with different mitigation
strategies.
3.4 Summary
NZ road transport and its policy centres around cars, which make up the majority of transport
modeshare. Efficient road infrastructure is important to support local community, and provide
a competitive environment for businesses. Many policies surrounding future transport
support the need for more fuel efficient vehicles and increased use of public transport. These
methods align with governmental aims to lower petrol consumption in NZ, in order to lower
NZ exposure to the volatile oil market. The government has also stated that protecting the
environment, promoting physical activity and promoting modal shift in the transport sector
will be beneficial to the nation for multiple reasons. Current policy and planning for future
road transport development includes a focus on infrastructure to promote modeshift to active
transport options.
174 Chapter 4: The Wellington Context
New Zealand is a country globally recognized by its ‘clean and green’ image, though there has
been some controversy about the accuracy of this reputation (61,62). Wellington City, as the
capital of NZ, identifies its unique position to take a leadership role in climate change
mitigation, and, in the words of the City Council, “[Serve] as a centre of excellence for urban
planning, resilience and ecological sustainability”. The Wellington City Council highlights the
importance of cities leading the charge in climate change mitigation, rather than relying on
national policy (63).
Plans and Policies: What are they for and what do they mean?
Greater Wellington Regional Council
Regional Land Transport Strategy 2010-2040 (RLTS)
This is the overarching transport document for the Greater Wellington
Region. It is prepared under the Land Transport Act 1998 and is the strategic
transport document that guides the development of the Wellington Region’s
transport system including public transport, roads, walking, cycling and
freight for the next ten years and beyond.
Regional Cycling Plan 2008
This is a series of implementation plans and corridor plans that have been
developed to translate the RLTS vision, objectives, outcomes and policies on
cycling into specific projects.
Wellington City Council
Wellington Towards 2040: Smart Capital
This outlines the Council’s strategic plan for Wellington City over the next 30
years, including a vision and goals.
18Wellington Transport Strategy 2006
This is the Council’s plan for the future development of Wellington City’s
transport system. It includes plans, budgets, and implementation
information.
Wellington City Cycle Policy 2008
This outlines the cycling-specific planning as set out in the Wellington
Transport Strategy 2006. It includes detail on cycling in Wellington, the
context set by other policies and strategies, and a framework for the
development of infrastructure.
Long-Term Plan 2012-22
This is prepared in accordance with the Local Government Act and covers 10
years until the 30th of June, 2022. It describes the city’s activities and
community outcomes; provides for integrated decision-making and a
coordinated use of resources; and gives a long-term focus for decisions.
District Plan 2010
This contains rules that affect the development of land or land-use and
promotes the sustainable management of natural and physical resources.
Climate Change Action Plan 2013
This outlines the strategies for Wellington City regarding carbon constraints,
the reduction of greenhouse gas emissions, climate impacts, extreme
weather events and sea-level rise.
4.1 Wellington City Emissions
Compared to national averages, Wellington is already seen as a leader in many facets of
climate change mitigation. Wellington has a lower carbon footprint than the rest of NZ on
average. For example, the city generates 6.2 tonnes of greenhouse gas emissions per person,
compared to the national average of 18 tonnes per person (63). However, the city recognizes
the need to reduce emissions even further, and thus outlined ambitious targets in a 2010
report on climate change. The city is aiming for 30% reduction in emissions from 2001 levels
19by 2020, with the Council itself aiming for a 40% reduction from their own 2003 levels. By
2050, both the city and the council have aimed for a reduction of 80% (64).
4.2 Climate Change Mitigation in Wellington
In order to meet these ambitious targets, many changes will need to be made to regional and
national policies. The New Zealand Energy Strategy outlines that by 2040, it will be possible to
reduce the country’s transport emissions to 1990 levels, however this is partly reliant on the
development of new fuels (53). These new fuels, however, are only expected to be available
by 2020, and there is no guarantee that they will be available at all. As such, Wellington is
somewhat dependent on national and international developments. Even with the
development of new technologies and support from national bodies, an aggressive
implementation of climate change mitigation strategies will need to occur. Wellington City’s
population is forecast to increase by over 20 percent in the next 20 years (63) and, in the
Wellington Region, with this increase in the population, as well as economic growth “road
demand and CO2 emissions are forecast to increase 13.9% and 13.6% respectively” (65). As
such, the coordination of many different sectors within Wellington, alongside clearly defined
and measurable goals, is required.
Climate change mitigation needs to be treated as a priority, and the city needs to know which
avenues of climate change mitigation will be most effective. Wellington City Council
recognises the implications of climate change and “the need to put climate change,
sustainability of resources and the environment at the forefront of planning for the future”
(63).
The meeting of ambitious emissions goals not only requires national, regional and municipal
direction, individuals also need to take meaningful and responsible action. The Long-Term
Plan for Wellington City includes educating residents and business on the importance and
means of reducing emissions (66). The Wellington Regional Land Transport Strategy (RLTS)
2010-2040 says, “People’s travel choices will recognise the risk and impact of climate change
and diminishing non-renewable resources” (65). Research has shown that Wellingtonians
already have more concern for the environment than the average New Zealander. In the 2010
Nielsen Quality of Life survey 82 percent of Wellingtonians agreed or strongly agreed that they
would change their lifestyle to help prevent global warming if they knew it would make a
20difference. This compares to 76 percent for the total NZ wide survey group (67). However,
when surveyed on perceived efforts of local governments or businesses in The 2013
Wellington Residents Monitoring Survey, only 43% of Wellingtonians agreed or strongly
agreed that Wellington is working to reduce its greenhouse gas emissions (64). This indicates a
clear desire for change from the status quo.
4.2.1 Climate Change Mitigation through the Transport Sector
As highlighted earlier in this report, changes within the transport sector can be particularly
effective as a means for climate change mitigation. In Wellington in 2010, four hundred and
twelve thousand tonnes of CO2, and 35% of the city’s emissions, were due to land transport.
This was second only to emissions from buildings and energy at 42% (68).
In line with this, the vision of the RLTS is: “To deliver an integrated land transport network
that supports the region’s people and prosperity in a way that is economically,
environmentally and socially sustainable” (65). Wellington Towards 2040: Smart Capital,
indicates that the need to respond to climate change is a big challenge in Wellington’s near
future. The strategy outlines four major goals: two of which, “connected city” and “eco-
friendly city”, directly address transport as a major avenue for change (63).
As such, there are a number of regional and city initiatives to shift towards a more
environmentally sustainable future. The regional website promotes carpooling as a good
means of reducing car numbers and congestion, linking to the website letscarpool.govt.nz to
allow people to find means of carpooling all across the region, and beyond (69). Carpooling is
also mentioned in the city’s Climate Change Action Plan 2013, however, with less information
about how the city is encouraging this (64).
Both the Regional and City Councils also aim for more vehicles that will run on renewable,
non-polluting and sustainable fuel sources. The RLTS states that the Regional Council will
“advocate for improved fuel efficiency and for alternative fuels”, and, “build infrastructure
that supports electric vehicles” (65). In 2012, the City Council undertook a pilot project with
eight Mitsubishi i-MiEV electric cars, and ran an exhibit outside Te Papa as part of a shift for
alternate fuel sources. The City Council also aims to optimise its own vehicle fleet as a priority
for 2013-2015 (64).
21Telecommuting is also promoted as a viable alternative to driving, with use of new
technologies such as Skype and other forms of online communication. Recent research in 15
international countries showed that in areas of high Internet access, young people were less
likely to have drivers’ licenses (70). Two recent developments within the central Government,
the ultra-fast broadband initiative and the rural broadband initiative, will provide even better
Internet access throughout the Wellington Region (63).
4.3 Mode Shift towards Cycling
The focus of this report is on modal shift away from private car use, and towards active
transport, in particular, cycling. The RLTS, The Long-Term Plan, The District Plan and The
Wellington Transport Strategy all place importance on this goal (65,66,71,72). The RLTS, as the
overarching transport document for the region, outlines the importance of walking and cycling
for short trips, and providing viable means to do this through safe, convenient and pleasant
networks (65). This is mirrored in the city’s Long-Term Plan, which states, “People want
Wellington to be a more pedestrian and cycling friendly city”. The Wellington City Cycle Policy
states, ““Every opportunity should be taken to ensure cycling is a viable option for short trips
to and from suburban centres”…”educational centres”… ”recreational centres and facilities”
(66).
A shift to active transport, in particular, cycling, is supported by those in the health sector, due
to the dual benefits of climate change mitigation and health promotion (21). This has been
discussed in detail earlier in the report. Wellington leads the country in the percentage of
people who take public transport, walk, run or cycle to work. In the central city, this
proportion is as high as 65% of residents (63). Over the previous ten years, car use has
dropped by almost 10 percent, likely the result of increased residential living in the inner city
(63). However, there is much room for improvement.
The RLTS has a 2020 Strategic Target of increasing “active mode share up to 30% of all trips in
urban areas”. This is the same target as set by the NZ Transport Strategy, though the national
target is set at 2040. In the Wellington Region in 2005-2009, this was at 26% (65).
Mode of transport chosen for a trip to work is a good parameter for mode share, as it is
measured in the New Zealand Census, among other surveys. In the Wellington Region in 2006,
22You can also read