EAERE Magazine - n.10 Fall 2020 - European Association of Environmental and ...
←
→
Page content transcription
If your browser does not render page correctly, please read the page content below
n.10
        Fall
       2020

 EAERE
Magazine

               1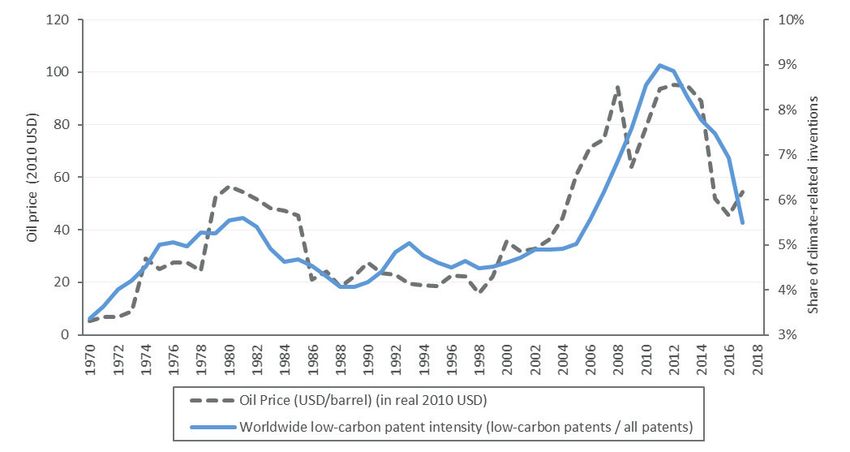
2
Table of contents

5
     Note from the Editor
     Astrid Dannenberg

6
     COVID-19 and the low-carbon transition
     Antoine Dechezleprêtre

     ERC-Grant “Health, Labor, and Environmental Regulation

11
     in Post-Industrial Europe” (HEAL)
     Ulrich Wagner

15
     Low-carbon macrofinancial transitions: What could go wrong?
     Emanuele Campiglio

19
     2D4D - Disruptive Digitalization for Decarbonization
     Elena Verdolini

24
     Forest sequestration, food security and climate change
     Luis Moisés Peña-Lévano and Farzad Taheripour

                                                              3
n.10 Fall 2020 EAERE Magazine serves as an outlet for new research, projects, and other professional news, featuring articles that can contribute to recent policy discussions and developments in the field of environmental and natural resource economics. It is published quarterly in the Winter, Spring, Summer, and Fall. Contributions from the wider EAERE community, especially senior level researchers and practitioners, and EAERE Country Representatives, are included in the magazine. EAERE President: Christian Gollier Editor: Astrid Dannenberg Editorial Assistant: Katie Johnson Contributing Authors: Emanuele Campiglio,Astrid Dannenberg, Antoine Dechezleprêtre, Farzad Taheripour, Luis Moisés Peña- Lévano, Elena Verdolini, Ulrich Wagner Graphic Project: Renato Dalla Venezia For questions and comments please contact: Astrid Dannenberg – dannenberg@uni-kassel.de or Katie Johnson – katie.johnson@eaere.org 4
Astrid Dannenberg is Professor of Environmental and Behavioral
                            Economics at the University of Kassel and Editor of the EAERE
                            Magazine.

Dear EAERE friends and colleagues,
This issue will be the last issue of this year, which has been a very complicated year and
may bring more complications in the remaining two months.
This issue is dedicated to the researchers who have been awarded with an EAERE
Award this year and who couldn’t be celebrated at the EAERE conference as usual.
We start with Antoine Dechezleprêtre, Environment Directorate and Economics De-
partment at OECD and winner of the European Award for Researchers in Environ-
mental Economics under the Age of Forty, who writes about the challenges that the
current COVID-19 crisis poses for the climate change crisis. We then have contributions
from three recent ERC Grantees, Ulrich Wagner from the University of Mannheim,
winner of an ERC Consolidator Grant, Emanuele Campiglio from the University of
Bologna, winner of an ERC Starting Grant, and Elena Verdolini from the Universi-
ty of Brescia, winner of an ERC Starting Grant, who present their research projects.
Reading about their work not only gives an impression of the research activities in our
association but is also especially interesting for young researchers who toy with the idea
of writing an ERC proposal. Finally, Luis Peña-Lévano from the University of Florida
and Farzad Taheripour from Purdue University present their article on forest seques-
tration, food security and climate change, for which they received the EAERE Award
for Outstanding Publication in ERE.
Enjoy reading,
Astrid Dannenberg

                                                                                         5   5
COVID-19 and the
low-carbon transition1
Antoine Dechezleprêtre
OECD and London School of Economics
Antoine Dechezleprêtre is a Senior Economist in the Directorate
for Science, Technology and Innovation, OECD, and a Senior Visiting
Fellow at the Grantham Research Institute of Climate Change and the
Environment, London School of Economics. His research deals principally
with the impact of environmental policies on innovation, technology
diffusion, emissions and firm performance. He is the winner of the 2020
European Award for Researchers in Environmental Economics under the
Age of Forty and holds a PhD in economics from Ecole des Mines de
Paris (France).
The COVID-19 and climate challenges crises, including the 2008 Global Financial
Crisis (GFC), show that economic recov-
The COVID-19 crisis is an enormous chal- eries are typically associated with stronger
lenge to economies and societies across emission growth, compensating for the
the world. The first priority for govern- initial downfall (Figure 1). The behavioural
ments has been to deal with the health cri- changes triggered by the pandemic (such
sis and save lives and, as containment mea- as more teleworking and teleconferenc-
sures have resulted in a drop in economic ing, shortening of global supply chains),
activity without precedent in recent histo- even if permanent, are unlikely to be large
ry, to adopt support policies that minimise enough to significantly alter the climate
the destruction of jobs and income. How- problem.
ever, the magnitude and urgency of the
crisis should not let us lose sight of other The COVID-19 crisis puts the low-car-
challenges. In fact, the COVID-19 crisis is bon transition at risk
a reminder of how vulnerable we are to
high-impact global shocks such as natural There is a risk that the crisis might actually
disasters triggered by climate change, and make things worse from the climate miti-
of the important role of public policies gation point of view. Reducing emissions
in mitigating the risks by reducing green- in the long run requires large investments
house gas emissions. The massive drop in in low-carbon technologies – both on the
air pollution levels during the lockdowns innovation and the diffusion side (IPCC,
also gave us a glimpse of how a cleaner 2018). But the fall in economic activity
world could look like. Therefore, the crisis combined with high economic uncer-
must not derail global efforts to address tainty means that firms may lose access
climate change, but should instead encour- to financing, reduce or postpone invest-
age policymakers to shape the recovery in ment, including in innovation (Baker et al.,
ways that are consistent with strategies to 2020). At the same time, the COVID-19
reduce greenhouse gas emissions. crisis has been accompanied by a massive
drop in fossil fuel prices, resulting from
Temporary emissions reductions a collapse of demand and an oil price
war. Low fossil-fuel energy prices pro-
The lockdowns imposed across the plan- vide weaker incentives for investment in
et have caused large reductions in CO2 low-carbon and energy efficiency technol-
emissions from transportation and indus- ogy at all stages, from R&D to commer-
trial activity. The IEA expects global CO2 cial diffusion. For example, there is ample
emissions to decline by 8% in 2020 com- evidence that fossil fuel prices are strongly
pared to 2019 (IEA, 2020). This tempo- correlated with global patenting activity in
rary drop in emissions, however, will be low-carbon technologies (Dechezleprêtre
inconsequential for climate change unless et al., 2011), as shown in Figure 2. In ad-
followed up with strong policy action. Past dition, young and small firms, which tend
6 6Figure 1. CO2 emissions and past economic crises. (Source: Global Carbon Project, 2020)
to be major drivers of radical innovation, sustainable energy sources. What can pol-
are likely to be much more severely affected icy makers do? In the short run, the most
by the COVID-19 crisis compared to larg- important message is: do no harm. Lifeline
er or incumbent firms, as they have poorer support to firms and industries should not
access to capital required to smooth over be combined with the dismantling or water-
transitory shocks (Bell et al., 2020). ing down of environmental policies. Both
in the United States and Europe, some in-
A role for public policies dustry lobbies have been pushing to weak-
en standards or to delay the introduction
With historically low oil prices, the fossil of planned climate policies. But, at a time
fuel industry – especially producers ex- of unprecedented uncertainty, signals from
ploiting costlier resources – is also under carbon pricing, emissions standards, and
stress. Hence, policies have a particular op- other environmental regulations need to be
portunity to tilt the balance towards more maintained to provide stability for low-car-
Figure 2. Worldwide low-carbon patent filings and oil prices. (Source: Based on data from the European
Patent Office’s Global Patent Statistical Database and Oil price data from the World Bank.)
77bon activities. This is particularly important covery, through improving power system
as energy investments are highly sensitive to flexibility (e.g. energy storage, smart grids,
public policies and require long-term plan- long-distance and cross-border power
ning horizons. transmissions), public transport, charging
stations for electric or hybrid vehicles, car-
Calls have also been voiced to make direct bon capture facilities, and renewable energy
support to firms contingent on environ- deployment. Support to enabling technol-
mental improvements. Certainly, bailouts ogies (such as digital technologies, artificial
of ailing companies provide an opportu- intelligence, communication networks) can
nity for governments to steer investment help perpetuate the behavioural changes
toward low-carbon production and emis- triggered by the crisis and improve produc-
sions reductions once they are afloat again, tivity growth.
and support workers through re-training
in low-carbon technologies. Efficiency Lessons from the past
improvement conditions can further help
ensure the future viability of firms in a Following the GFC, over half a trillion US
low-carbon world. The immediate priority, dollars was committed worldwide as part
however, remains to rescue as many viable of green stimulus packages. Yet, emissions
businesses as possible and in practice this recovered after the GFC, and continued on
may not be easily compatible with the im- an upward path. Obviously, the current cri-
position of conditions such as energy effi- sis is very different: uncertainty is unprece-
ciency improvements (Aldy, 2020). Howev- dented, fiscal space is limited, debt is much
er, credible commitments to attaching such higher, but on the other hand some cli-
strings in the future may be feasible and mate-related technologies (e.g. renewables,
would help setting incentives and expecta- batteries) are now vastly cheaper than ten
tions of investors. years ago. Notwithstanding these differenc-
es, a number of lessons can be drawn from
Green stimulus packages to support the this past experience (Agrawala et al., 2020).
longer-term recovery
First, it is very difficult for green recovery
There has been much talk in recent months packages to at the same time fix the econo-
about how to design green stimulus packag- my and the climate crisis. Some green poli-
es (e.g. Birol, 2020). The objective of green cies will be good for the recovery, others are
recovery packages is to use expansionary not really win-win (Hepburn et al. 2020).
policy to reignite growth while making Green stimulus packages can be effective
progress on the climate agenda. For most at reshaping the economy and at delivering
countries, one of the many legacies of the growth over the long-term, but not neces-
COVID-19 crisis will be high public debt, sarily at generating jobs in the short run.
with numerous claims on public support. For example, the Green American Recov-
This strengthens the need to spend money ery and Reinvestment Act (ARRA) induced
in ways that are most effective in reignit- large emissions reductions through renew-
ing growth, generating jobs while putting able energy deployment and subsidies for
the economy on track to meet emission new cars, but the job effects were modest
reduction pledges. For example, in many and costly (Gayer and Parker, 2013; Popp
countries government support to ener- et al., 2020). Energy efficiency retrofitting
gy efficiency retrofitting of buildings can of buildings generates jobs in the short run,
help absorb job losses from the construc- but emissions reductions have been gener-
tion sector, while reducing emissions in the ally disappointing. Trade-offs exist and
long run and providing important co-bene- green stimulus packages need to be com-
fits in terms of energy poverty and health. bined with other standard short-term poli-
Investment in infrastructure projects may cy measures to revive the economy.
be crucial for facilitating a low-carbon re-
8Second, the design of policies needs to movement in France has shown. The polit-
carefully take into consideration countries’ ical economy of carbon pricing thus needs
domestic settings (level of development, to play an important role in the design of
talents, skills, firms and infrastructure). Pre- such policies (Carattini et al., 2018). Car-
vious green recovery packages focused on bon taxes and the phasing out of fossil fuel
the demand side (feed-in tariffs, car rebates) subsidies carry the risk of disproportional-
with little attention paid to the supply side ly affecting lower-income households and
and to the development of global supply small businesses, which would magnify the
chains. Matching green investments to the negative impact of the crisis on vulnera-
skill base of the local economy matters for ble populations3. Compensation measures
the success of green recovery packages, through lump-sum payments to house-
so that green recovery packages should be holds and to the most affected firms can
complemented with training programmes be used to offset the distributional impacts
(Chen et al., 2020). of higher taxes and boosting investments
in green infrastructure can increase pub-
Third, investment support is not sufficient. lic acceptance for such policies (Douenne
Post-GFC green stimulus packages often and Fabre, 2020). Lessons learnt from the
lacked the important longer-term signals successful introduction of the British Co-
provided by carbon prices – EU ETS pric- lumbia carbon tax, where the higher carbon
es were low, the US abandoned ideas to tax is combined with labour and business
introduce a carbon tax. As a consequence, income tax reductions, could be applied to
large-scale publicly supported investments other countries (Harrison, 2013). Providing
such as CCS demonstration projects were households with viable alternatives to car-
all later abandoned for lack of private fi- bon-intensive choices, such as public trans-
nancing (Dechezleprêtre and Popp, 2017). port, energy efficiency improvements of
We risk being in a similar situation – across buildings and appliances, can help change
44 OECD and G20 countries, over 75% their behaviour, allowing them to benefit,
of emissions are priced below EUR 30/ not lose out from carbon taxes.
tCO2, a conservative estimate for the so-
cial cost of carbon (OECD, 2018). Green Conclusion
recovery packages will go nowhere if not
accompanied by clear trajectories of grad- The COVID-19 crisis has temporarily re-
ually increasing carbon prices over the next duced carbon emissions but could in fact
decades and removal of harmful fossil fuel derail global efforts to address climate
subsidies which undermine the business change. The post-crisis recovery pro-
case for a low-carbon transition2. grammes present an opportunity to more
closely align public policies with climate
Social acceptability considerations objectives and limit the risk of locking-in
carbon-intensive infrastructure. Forthcom-
Arguing for increased carbon pricing in the ing stimulus packages can be designed to
midst of perhaps the largest global reces- orient investment towards sectors and tech-
sion in history might sound fanciful. But nologies that can accelerate the transition,
even a moderate carbon tax announced and improve resilience to future shocks
now but imposed only well into the recov- from climate change, but they will be of
ery period can provide forward guidance little help if not accompanied by strong cli-
to investors, reduce uncertainty and ensure mate policies which make the business case
that the mistakes from the past are not re- for low-carbon investment viable.
peated, without immediately burdening
businesses and households with new taxes
(Van Dender and Teusch, 2020). It remains
that carbon pricing has proven difficult to
implement politically, as the Yellow Vest
99References Gayer, T. and E. Parker (2013). An evaluation of the
car allowance rebate system, Brookings Institution.
Agrawala, S., Dussaux, D., Monti, N. (2020). “What
policies for greening the crisis response and econom- Harrison, K. (2013). “The Political Economy of
ic recovery?: Lessons learned from past green stim- British Columbia’s Carbon Tax”, OECD Environ-
ulus measures and implications for the COVID-19 ment Working Papers, No. 63, OECD Publishing,
crisis”, OECD Environment Working Papers, No. Paris, https://dx.doi.org/10.1787/5k3z04gkkhkg-en
164. https://doi.org/10.1787/c50f186f-en
Hepburn, O’Callaghan, Stern, Stiglitz, Zenghelis
Aldy, J. (2020). Greener Stimulus? Economic Recov- (2020). “Will COVID-19 fiscal recovery packages ac-
ery and Climate Policy. www.energypolicy.columbia. celerate or retard progress on climate change?” Ox-
edu/greener-stimulus-economic-recovery-and-cli- ford Review of Economic Policy 36(S1)
mate-policy
IEA (2019). World Energy Outlook 2019, OECD
Baker, S. et al. (2020). “COVID-induced econom- Publishing, Paris, https://dx.doi.org/10.1787/
ic uncertainty and its consequences”, VOX CEPR caf32f3b-en.
Policy Portal, https://voxeu.org/article/covid-in-
duced-economic-uncertainty-and-its-consequences IEA (2020). Global Energy Review 2020, IEA,
www.iea.org/reports/global-energy-review-2020.
Bell, B. et al. (2020). “Prepare for large wage cuts if you
are younger and work in a small firm”, VOX CEPR Pol- IPCC (2018). “Global warming of 1.5°C. Special Re-
icy Portal, https://voxeu.org/article/prepare-large- port”.
wage-cuts-if-you-are-younger-and-work-small-firm
Levinson, A. (2019). “Energy Efficiency Standards
Birol, F. (2020). “How to make the econom- Are More Regressive Than Energy Taxes: Theory
ic recovery from coronavirus an environmental- and Evidence”, Journal of the Association of Environ-
ly sustainable one”, www.iea.org/commentaries/ mental and Resource Economists, Vol. 6/S1, pp. S7-S36.
how-to-make-the-economic-recovery-from-coro-
navir us-an-environmentally-sustainable-one OECD (2018). Effective Carbon Rates 2018: Pricing
Carbon Emissions Through Taxes and Emissions
Carattini, S., M. Carvalho and S. Fankhauser (2018). Trading, OECD Publishing, Paris, https://dx.doi.
“Overcoming public resistance to carbon taxes”, org/10.1787/9789264305304-en
WIRES Climate Change, Vol. 9.
OECD (2020). OECD Inventory of Support Mea-
Chen, Z., Marin, G., Popp, D. and Vona, F. (2020). sures for Fossil Fuels, www.oecd.org/fossilfuels/data/
“Green Stimulus in a Post-pandemic Recovery: the
Role of Skills for a Resilient Recovery”. Environ- Popp, Vona, Marin, Chen, (2020). “The Employment
ment and Resource Economics 76, 901–911. https://doi. Impact of Green Fiscal Push: Evidence from the Amer-
org/10.1007/s10640-020-00464-7 ican Recovery Act”, NBER Working Paper No. 27321
Davis, L. and C. Knittel (2019). “Are Fuel Economy Van Dender, K. and J. Teusch (2020). “Making envi-
Standards Regressive?”, Journal of the Association of ronmental tax reform work”, La Revue des Juristes de
Environmental and Resource Economists, Vol. 6, pp. 37-63. Sciences Po 18, pp. 106-111, http://revuedesjuristes-
Dechezlepretre, A., Glachant, M., Hascic, I., John- desciencespo.com
stone, N. and Ménière, Y. (2011). “Invention and
Transfer of Climate Change-Mitigation Technolo- End Notes
gies: A Global Analysis”, Review of Environmental Eco-
nomics and Policy, Vol. 5/1, pp. 109-130, http://dx.doi. 1
This article draws on Dechezleprêtre, A., Elgoua-
org/10.1093/reep/req023 cem, A., Kozluk, T., Kruse, T., 2020. “COVID-19
and the low-carbon transition: Impacts and possible
Dechezlepretre, A. & Popp, D. (2017). “Fiscal and policy responses”, OECD Policy Brief.
Regulatory Instruments for Clean Technology De-
velopment in the European Union”. Chapter 6, in 2
The latest combined OECD and IEA estimates in-
Karen Pittel, Ian Parry and Herman Vollebergh, dicate that governments provided USD 478 billion
Eds, “Energy Tax and Regulatory Policy in Europe: in fossil fuel support in 2019, more than double that
Reform Priorities”, MIT Press, Cambridge, 2017. of support given to renewable energy (OECD, 2020;
IEA, 2019).
Dechezleprêtre, A., Elgouacem, A., Kozluk, T., Kruse,
T., (2020). “COVID-19 and the low-carbon transi- 3
However, carbon taxes can often be less regressive
tion: Impacts and possible policy responses”, OECD than other commonly used climate-related policies
Policy Brief. www.oecd.org/coronavirus/policy-re- such as fuel-efficiency standards (Levinson, 2019;
sponses/covid-19-and-the-low-carbon-transition- Davis and Knittel, 2019)
impacts-and-possible-policy-responses-749738fc/
Douenne, T. and A. Fabre (2020). “French attitudes
on climate change, carbon taxation and other climate
policies”, Ecological Economics, Vol. 169, p. 106496,
http://dx.doi.org/10.1016/j.ecolecon.2019.106496
10ERC-Grant “Health, Labor, and
Environmental Regulation in
Post-Industrial Europe” (HEAL)
Ulrich Wagner
University of Mannheim
Ulrich Wagner is a Professor of economics at the University of Mannheim.
His research on empirical environmental economics has appeared in leading
economics journals and won him the Erik Kempe Award in 2015. Ulrich is a
co-editor of the Journal of the Association of Environmental and Resource
Economists and editorial board member of the Journal of Environmental
Economics and Management. He obtained his PhD in economics from
Yale University and subsequently worked as a postdoctoral research fellow
at the Earth Institute at Columbia University. Before moving back to his
native Germany, he was an Associate Professor at Universidad Carlos III
in Madrid.
Environmental regulation dates back at least position where they have to allocate scarce
as far as the thirteenth century when the King resources between improving environmental
of England banned the burning of sea-coal quality and other socially desirable objectives.
in London in order to mitigate air pollution As researchers in environmental economics,
(Brimblecombe, 1987). Today, improving air we have a responsibility to provide them with
quality is not only a priority in rapidly indus- the best possible measurements for cost-ben-
trializing economies such as China and India efit analysis, in particular when it comes to
where air pollution has been shown to short- estimating the damages of air pollution, for
en lives and increase morbidity, but it also which market prices are not available.
continues to be a top priority for policy mak-
ers in post-industrial societies. In line with Measuring the damages of air pollution is
the view that the demand for environmen- challenging for a number of reasons. A major
tal quality increases with economic growth obstacle to the estimation of causal impacts
(Grossman and Kruger, 1995), we observe is that air pollution exposure is not random
that the richest urban agglomerations in Eu- across individuals. In their review paper,
rope adopt very costly measures to further Graff Zivin and Neidell (2013) list numer-
reduce air pollution. ous reasons for why spurious correlations
between air pollution and health outcomes
As environmental economists, we teach our could arise over time or in the cross section.
students that regulating air pollution and oth- Sometimes it is precisely the – rational – at-
er environmental externalities is subject to tempt to avoid exposure to air pollution which
trade-offs. Improving environmental quality biases the estimation of the true dose-re-
is not a free lunch. Someone will have to pay sponse function with observational data1.
for it. We then introduce them to the concept Mismeasurement of pollution exposure is
of socially optimal pollution, characterized another important issue. Some air pollutants
by the equality of marginal social benefits of travel over long distances, so that the impacts
pollution and marginal social costs, as a util- are not confined to the place of emission.
itarian approach to resolving this trade-off.
I am sure that many of you share my expe- My ERC-project HEAL, submitted under
rience that this concept is often met with a the 2019 Consolidator Grant call to the SH1
healthy dose of skepticism. Some students panel, quantifies air pollution damages using
disapprove of the notion to put a price on an empirical framework that addresses these
environmental quality, others object to the challenges in a series of empirical applica-
simple aggregation of environmental dam- tions. HEAL will support evidence-based
ages across individuals. Sometimes there are environmental policy making in Europe and
more extreme positions, such as refusal to elsewhere through the development of new
compromise on either environmental quality empirical tools that bring together causal in-
or economic growth. But there is also a group ference and spatially detailed impact analysis.
of students who grow up to become policy Although the main focus is on air pollution,
makers and ultimately find themselves in a the results have straightforward and polit-
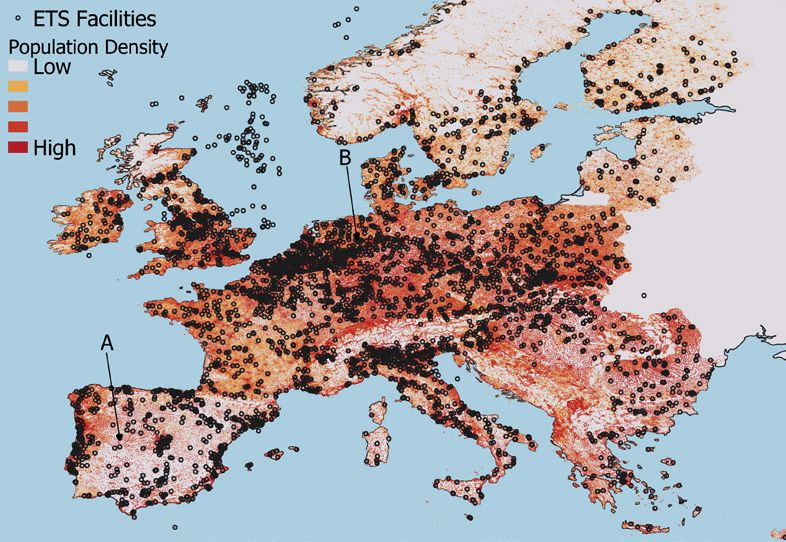
11ically significant implications for climate The map shows the spatial distributions
change mitigation. This is because both of people and ETS regulated facilities that
global climate change and regional air pol- also emit air pollution. Since CO2 is harm-
lution originate to a large extent from the less to human health, it makes economic
combustion of fossil fuels, an activity that, sense to allow market forces to allocate
in Europe as well as in other post-industrial CO2 emissions in ways that minimize the
societies, can be curbed only at steeply in- total abatement cost. However, the facilities
creasing marginal costs. displayed in Figure 1 emit CO2 jointly with
air pollutants that do have health impacts.
A large amount of the time and resources For example, assume that firm A in Spain
budgeted in HEAL is dedicated to analyz- sells a permit to firm B in Germany. This
ing the efficiency and distributional implica- trade is neutral in terms of CO2 emissions,
tions of changes in local air quality that arise but it might not be neutral in terms of ni-
as an unintended consequence of the Eu- trogen dioxide (NO2), an air pollutant. If,
ropean Union Emissions Trading Scheme for the sake of the argument, we assume
(EU ETS) for carbon dioxide (CO2). The that firm B is more pollution intensive than
EU ETS is the cornerstone of EU climate firm A, overall pollution increases. In addi-
policy and has served as a blueprint for tion, the permit trade shifts pollution to a
similar schemes in other countries2. There more densely populated area in Germany
are plenty of things that we have learned where it harms more people. While this is
about carbon trading through rigorous ex- a hypothetical example, the vast potential
post analysis of the EU ETS (the interest- for implicit pollution trades suggests that
ed reader is referred to the symposium in CO2 trading could have large impacts on
REEP vol. 10(1), 2016). However, an im- air quality and public health. Measuring
portant knowledge gap concerns the extent such health damages (or benefits) is far
to which carbon trading has reallocated air from trivial as they are jointly determined
pollution across Europe. by the heterogeneity in abatement costs
and pollution intensities across thousands
To understand why this matters, consider of polluting facilities, by complex patterns
the map of Europe displayed in Figure 1. of atmospheric pollution transport, and by
Figure 1. Polluters and Pollutees in the European Carbon Market
12differences in population density. Fowlie and Muller, 2019). However, there
The various work packages of HEAL con- is no ex-post evidence thus far on efficien-
tribute the buildings blocks for a spatially cy losses in the EU ETS where CO2 trades
explicit ex-post analysis of this issue. In may give rise to multiple implicit pollutant
painstaking data work joint with Laure de trades without being accounted for in the
Preux (Imperial College London), I have permit price.
linked EU ETS installations of polluting
facilities to the European Pollution Re- The analysis of distributional consequenc-
lease and Transfer Register (EPRTR). Our es is motivated by the fact that, efficiency
dataset comprises 5,745 geo-referenced aside, any reallocation of air pollution due
installations in 29 countries (cf. Figure 1), to the EU ETS creates winners and losers.
representing 92% of all CO2 emissions in In the U.S., emissions trading programs
the EU ETS. These installations release up have been subject to great public scrutiny
to 50 different pollutants to air, water, and regarding distributional impacts against the
land. In ongoing work with our Mannheim backdrop of environmental justice (Fowlie
colleague Dana Kassem, we use this dataset et al, 2012; Grainger and Rungmas, 2018).
to econometrically estimate the facility-lev- Due to its large scale and unique impor-
el impacts of CO2 trading on air pollution tance for carbon trading schemes elsewhere
emissions. The microeconometric model in the world, the EU ETS presents an ex-
allows us to predict pollution emissions by cellent opportunity for studying the distri-
each facility in a counterfactual scenario butional effects of carbon trading. Beyond
without CO2 trading. environmental justice, the distribution of
the public health impacts of carbon trading
To estimate health impacts in the coun- matters because it can have repercussions
terfactual, we need to translate emissions on public support for climate policy and
into human exposure to pollution. This is a for centralized policy making in the EU
complex process governed by weather, to- more broadly.
pography and chemistry. A state-of-the-art
chemical transport model will be calibrated Using the example of the EU ETS, I have
to carry out this step. Finally, the treatment described the interdisciplinary approach
effect on public health will be calculated taken in HEAL which emphasizes both
on a spatial grid for Europe by multiply- causal inference and spatial detail in the
ing the counterfactual pollution exposure empirical analysis of air pollution damages.
with monetized per-capita dose-response As part of the 5-year grant, I will employ
functions from the literature. The estimates this approach to obtain credible estimates
obtained in this way allow us to analyze the of the pollution-health gradient while also
efficiency and distributional consequences incorporating subclinical and long-term
of implicit pollution trades under the EU health impacts. The methodological ad-
ETS. vances of this research agenda will direct-
ly benefit cost-benefit analysis in a broad
The possibility of efficiency losses due to range of policy domains where air pollu-
heterogenous marginal damages across tion externalities matter, including energy,
space is well-known in the context of trad- climate and transportation.
ing schemes for emissions of local and re-
gional air pollutants (Baumol and Oates,
1988). Recent empirical research on this
matter has focused on emissions trading
programs for sulfur dioxide and nitrogen
oxide in the U.S., and examines the eco-
nomic gains from adjusting permit prices
to account for heterogeneous marginal
damages (Muller and Mendelsohn, 2009;
13
13References Baumol, W. and Oates, W. (1988). The theory of environ- mental policy. Cambridge University Press, Cambridge. Brimblecombe, Peter. (1987). The Big Smoke: A His- tory of Air Pollution in London since Medieval Times. Methuen, London and New York. Fowlie, M., Holland, S., and Mansur, E. (2012). “What Do Emissions Markets Deliver and to Whom? Evi- dence from Southern California’s NOx Trading Pro- gram.” American Economic Review, 102(2):965–93. Fowlie, M. and Muller, N. (2019). “Market‐based emissions regulation when damages vary across sources:What are the gains from differentiation?” Journal of the Association of Environmental and Resource Economists, 6(3): 593-632. Graff Zivin, J., and Neidell, M. (2013). “Environ- ment, health, and human capital.” Journal of Economic Literature, 51(3): 689–730. Grainger, C. and Ruangmas, T. (2018). “Who Wins from Emissions Trading? Evidence from California.” Environmental and Resource Economics, 71: 703-727. Grossman, G. and Krueger, A. (1995). “Economic Growth and the Environment.” Quarterly Journal of Economics.” 110(2): 353-377. Martin, R., M. Muûls, and U.J. Wagner (2016). “The Impact of the EU Emissions Trading Scheme on Regulated Firms: What is the Evidence after Ten Years?” Review of Environmental Economics and Policy, 10(1): 129-148. Muller, N. Z., and Mendelsohn, R. (2009). “Effi- cient Pollution Regulation: Getting the Prices Right.” American Economic Review, 99(5):1714–1739. End Notes 1 Experimental approaches to this topic remain limit- ed to very low exposures for obvious ethical reasons. 2 Canada, Japan, Kazakhstan, South Korea, Switzer- land, and the U.S. have also implemented (pilot) ETS for CO2. China is in the process of rolling out its pilot ETS to a nationwide scheme. Several countries plan to adopt ETS. 14
Low-carbon macrofinancial
transitions: What could go
wrong?
Emanuele Campiglio
University of Bologna, RFF-CMCC European Institute on Economics and London School of Economics

                                  Emanuele Campiglio is Associate Professor of Economics at the
                                  University of Bologna. He is also Affiliated Scientist at the RFF-CMCC
                                  European Institute on Economics and the Environment and Visiting
                                  Fellow at the LSE Grantham Research Institute. His research focuses
                                  on the links between climate change, macrofinancial systems and
                                  sustainability transitions. He is the recipient of a 5-year ERC Starting
                                  Grant for the project SMOOTH (Sustainable finance for a smooth low-
                                  carbon transition).

Mitigating climate change would be easy if           short-term planning horizons and still per-
we had a benevolent social planner, efficient        ceive the risk-return profile of low-carbon
markets and forward-looking economic                 investments to be unattractive. To compli-
agents. Governments would design credible            cate things, add the deep uncertainty creat-
coordinated policy plans so as to maximise           ed by financial crises, global pandemics and
intertemporal social welfare, and would stick        geopolitical conflicts, affecting all economic
to them. Physical investments would be rap-          agents.
idly reallocated towards an expanding set of
increasingly competitive low-carbon tech-            The real-world lack of a coordinated miti-
nologies. High-carbon capital stocks would           gation effort could have two undesirable
continue to be used but, since no new dirty          consequences. First, it could prevent the al-
investment would be made, they would                 location of sufficient resources to low-car-
smoothly decline as they reach their natu-           bon investments, leading us well beyond the
ral end of life. Banks and financial investors       2°C temperature threshold. Second, it could
would react by pricing climate-related risks         leave the transition exposed to volatility and
appropriately and gradually reallocating their       sentiment fluctuations, creating the condi-
portfolios, so low-carbon firms would have           tions for an abrupt and disruptive process.
a stable and inexpensive access to external          These two circumstances could overlap in
finance. Some sectors and agents might suf-          the scenario of a ‘late and sudden’ transition,
fer losses, but on aggregate they would be           leading to what the former governor of the
more than compensated by the profits to be           Bank of England referred to as a ‘Climate
made in the rising industries. At the end of         Minsky moment’ (Carney et al., 2019), which
the process, we would have achieved a rap-           might then have further negative effects on
id low-carbon transition without any major           the low-carbon transition process itself.
disruption.
                                                     The main aim of the SMOOTH project
However, for better or worse, this scenar-           (2020-2025) is to understand if and how it
io is far from being reality. Our world is           would be possible to achieve a rapid low-car-
fragmented and riddled with uncertainties,           bon transition in such an imperfect and
inertias and mistakes. Individuals take in-          evolving context, while avoiding large mac-
vestment decisions under the influence of            roeconomic and financial disruptions.
social norms and cognitive biases, and with
limited access to information they can only          This requires addressing three broad in-
partially internalise. Governments struggle          ter-linked research gaps.
to implement forward-looking policies due
to public spending constraints, social op-           1. Drivers of transition-related disruptions. What
position and regulatory capture by power-            could trigger macrofinancial disruptions
ful interests. High-carbon technologies are          along the transition process? A number of
still the most attractive investment option          suspects can be identified: technological de-
in a large number of productive sectors, es-         velopment, the introduction of mitigation
pecially in lower-income countries eager to          policies, changes in preferences, climatic
grow. Most financial investors operate under         events, and others. However, what matters

                                                                                                        15
most are not the triggers themselves, but overs. Figure 1 offers an overview of how
rather how these materialize. A predictable transition risks might materialise and be
and socially accepted policy strategy, even transmitted to the rest of the economic
when strong, would smoothly push eco- system (Semieniuk et al., 2020). A particu-
nomic agents to decarbonise their activities larly relevant type of transition-related cost
without major disruptions. An unanticipat- is asset stranding, i.e. the unanticipated loss
ed policy shock, possibly in the wake of of operability or monetary value attached
some unforeseen climate event, is instead to different types of assets (Caldecott,
likely to cause large economic losses. The 2018). Assets at risk of stranding due to
alignment (or misalignment) of expecta- a low-carbon transition include reserves
tions and investment decisions with fu- of fossil fuels (the ‘unburnable carbon’),
ture decarbonisation pathways is therefore fossil-dependent stocks of physical capi-
crucial in determining the smoothness of tal (e.g. coal-fuelled electricity plants), and
the transition. But what are these expecta- financial assets (e.g. bonds issued by fossil
tions, and how are they formed? How are extracting firms). The issue of asset strand-
investors internalizing their expectations ing and associated macrofinancial disrup-
into physical and financial investment deci- tions along the transition process is being
sions? Do they have the right economic, so- increasingly investigated, using a number
cial and institutional incentives to perform of methodological approaches (see for in-
long-term investments? While some light stance the programme of the recent 2020
is recently being shed on the topic (see for EAERE Conference). First, dynamic eco-
instance Krueger et al., 2020), these ques- nomic modelling of different sorts (IAM,
tions still remain largely unanswered. DSGE, CAPM, SFC, ABM, and others) is
being developed to capture possible aggre-
2. Transmission channels and impacts of transi- gate transition dynamics. Second, analyses
tion-related disruptions. Wherever the exact of production and financial networks are
origin of the disruption lies, sudden cli- trying to assess the exposure of economies
mate-related realisations by consumers, to stranding risks. For instance, Figure 2
firms, investors or governments could shows how a marginal shock in the fossil
trigger macroeconomic and financial spill- sector of the countries in the sample (e.g. a
4. Macroeconomic impacts
Loss in aggregate demand
Companies Households Government
• Lower investment • Lower consumption • Higher budget deficit
• Lack of external finance • Lower residential investment • Higher (cost of) debt
• Bankruptcy • Overindebtedness • Higher risk of default
Propagation via changes in inflation, income/wealth inequality, exchange rate, current account
F ∆Pur- ∆Expectations
∆Demand E chasing Further D ∆Confidence
power feedback ∆Credit availability
rounds
2. Economic costs 3. Financial impacts
• Stranded (physical)
assets Equity investors Banks Insurance
• Unemployment • Higher pay-outs
C
• Revenue & profit • Portfolio losses • Higher loan • Portfolio losses
∆Asset prices
loss (firms) • Decline in default ratios • Decline in
∆Financial
• Income loss returns returns
position
(households &
governments) Propagation effects within financial network
∆Prices
∆Expectations
A ∆Quantities B
∆Regulation
∆Expectations
G
∆Drivers 1. Transition risk drivers
Legend:
• Mitigation policies • Technology • Preferences ∆ = “change in”
Figure 1. Drivers, transmission channels and impacts of transition-related costs (Semieniuk et al. 2020)
16unitary loss of primary inputs used in the financial investments, such as climate-re-
extraction of fossil fuels, or a unitary in- lated disclosure requirements, differenti-
crease in taxes applied to fossil production) ated prudential regulations, sectoral credit
would trigger cross-boundary stranding of quotas, and others (Campiglio et al., 2018).
physical capital stocks (Cahen-Fourot et al., However, we still lack a good understand-
2019). However, despite recent advance- ing of the effectiveness and possible side
ments, we are still far from having a com- effects of the various policy options. Sec-
prehensive modelling framework capable ond, could these policies be implemented
of capturing the complex coevolution of if thought to be beneficial, and by whom?
financial, socioeconomic and environmen- Since the 2007 global financial crisis, many
tal variables along the transition. regions have experienced shifts in the dis-
tribution of powers and responsibilities
3. Policies and institutions for a smooth transition. between governments, central banks and fi-
Even assuming we were able to develop re- nancial regulators, sometimes coupled with
liable transition risk assessment techniques, institutional fragmentation and frictions.
AUS
USA
AUT
L
TW
BE
0
R
2 0
N
BG
TU
0 0
A
R
BR
SW
0
0
N
E
CA
0 0
SV 0
N 0 E
CH
0
0
0
SV
K
2
CHN
2
0
RUS
ROU
0 0
4
PRT
0
CYP
0
POL 0
0
NOR CZE
0
2
NLD
0
0
0
MLT
X DE
0
ME U
2
0
A
LV
0
X
0
0
LU U
LT 0 DN
0
R K
KO
0 0
ES
0
0
N
P
0
JP
0
0 0
ES
0 0 0
0
ITA
FIN
T
IRL
FRA
IND
IDN
GBR
HUN
GRC
HRV
Figure 2. Cross-boundary physical capital stranding triggered by defossilisation (Cahen-Fourot et al., 2019)
the question of how we would mitigate (or This process affected also the climate mit-
adapt to) these risks remains open. Two igation policy sphere, where central banks
main questions arise. First, what policies have become very active (see for instance
should be implemented? All economists the creation of the Network for Greening
agree on the need for a carbon price to shift the Financial System - NGFS) triggering
consumption and investment choices, but both enthusiasm and concerns over their
it is unclear whether i) a sufficiently strong legitimacy and the lack of democratic con-
price signal will ever be implemented; ii) it trol. So what is the most appropriate gov-
would be able to address all existing market ernance framework configuration to deliver
failures, including the ones present in finan- a consistent and comprehensive policy ef-
cial markets; iii) it could actually exacerbate fort for a smooth transition? What are the
transition risks, if implemented too abrupt- institutional obstacles to its achievement,
ly. Additional policies have been proposed and what second-best options are available
or applied (especially in emerging econo- within current configurations? Additional
mies) to target more directly physical and work is needed to answer these questions.
17
17Addressing the research gaps above is cru-
cial, but also very challenging. It will require
going beyond economics to incorporate
insights from finance, behavioural scienc-
es, transition theory, political economy and
other disciplines. Within the economics
discipline itself, it will require revamping
traditional modelling techniques, as well as
complementing them with non-equilibrium
and complexity modelling (Mercure et al.,
2019). The role of evolving and heteroge-
nous expectations, in particular, appears to
References
be crucially important in determining the
shape and speed of the low-carbon tran-
sition and its macroeconomic and financial Bordalo, P., Gennaioli, N., & Shleifer, A. (2018). Di-
consequences. However, despite the strong agnostic Expectations and Credit Cycles. The Journal
rise of the literature linking sentiments, an- of Finance, 73(1), 199–227. https://doi.org/10.1111/
imal spirits and heterogenous expectations jofi.12586
to aggregate fluctuations (see for instance
Bordalo et al., 2018), these approaches have Cahen-Fourot, L., Campiglio, E., Dawkins, E., Go-
din, A., & Kemp-Benedict, E. (2019). Capital strand-
yet to be systematically used to study cli-
ing cascades: The impact of decarbonisation on productive
mate and transition macrofinancial implica- asset utilisation (Working Paper No. 18). WU Institute
tions. for Ecological Economics.
Over the course of five years, SMOOTH Caldecott, B. (Ed.). (2018). Stranded Assets and the En-
will attempt to address these shortcomings vironment: Risk, Resilience and Opportunity. Routledge.
and offer new insights on how to achieve a
rapid and non-disruptive low-carbon tran- Campiglio, E., Dafermos, Y., Monnin, P., Ryan-Col-
sition. The project will be conducted by lins, J., Schotten, G., & Tanaka, M. (2018). Climate
an interdisciplinary team based at the Uni- change challenges for central banks and financial
versity of Bologna and at the RFF-CMCC regulators. Nature Climate Change, 8(6), 462–468.
European Institute on Economics and the https://doi.org/10.1038/s41558-018-0175-0
Environment in Milano. All research out-
puts, events and call for applications will be Carney, M., Villeroy de Galhau, F., & Elderson, F.
posted on the project website: https://site. (2019). Open letter on climate-related financial risks. Bank
unibo.it/smooth/. We are looking forward of England. https://www.bankofengland.co.uk/
to interacting with the EAERE research news/2019/april/open-letter-on-climate-related-fi-
nancial-risks
community and presenting our results at
future EAERE conferences!
Krueger, P., Sautner, Z., & Starks, L. T. (2020). The
Importance of Climate Risks for Institutional Inves-
tors. The Review of Financial Studies, 33(3), 1067–1111.
https://doi.org/10.1093/rfs/hhz137
Mercure, J.-F., Knobloch, F., Pollitt, H., Paroussos,
L., Scrieciu, S. S., & Lewney, R. (2019). Modelling
innovation and the macroeconomics of low-carbon
transitions: Theory, perspectives and practical use.
Climate Policy, 19(8), 1019–1037. https://doi.org/10.
1080/14693062.2019.1617665
Semieniuk, G., Campiglio, E., Mercure, J.-F., Volz,
U., & Edwards, N. R. (2020). Low-carbon transition
risks for finance. WIREs Climate Change, Forthcoming.
182D4D - Disruptive
Digitalization for
Decarbonization
Elena Verdolini
University of Brescia and RFF-CMCC European Institute on Economics and the Environment, Euro-Mediterra-
nean Center on Climate Change
Elena Verdolini is Professor in Political Economy at the Law Department,
University of Brescia, and Scientist at the RFF-CMCC European Institute on
Economics and the Environment (EIEE). Her research focuses on innovation
dynamics, technology transfer, green growth, and the economic impacts
of environmental and energy policies. Elena is a Lead Author of the 6th
Assessment Report of the IPCC in Working Group III and the PI of 2D4D
“Disruptive Digitalization for Decarbonization”, a 5-year European
Research Council Starting Grant.
Technological change plays a dual role in which innovators build on the shoulders of
deep decarbonization pathways. On the the giants by benefiting from intertemporal,
one hand, the diffusion of already available intersectoral and international spillovers (i.e.
low-carbon technologies and the invention Popp 2002, Nemet 2012, Verdolini and Ga-
of novel carbon-neutral options is necessary leotti 2011), the inducement effect of both
to achieve and surpass the Paris Agreement demand pull or technology push policies on
target of limiting mean global temperature either the level or the direction of (low-car-
increase to 2C degrees with respect to 1900 bon) energy innovation (i.e. Nesta el al. 2014,
levels (IPCC 2018). Indeed, one of the key Aghion et al. 2016) ; the potential impact of
differences across the alternative decarbon- low-carbon technology diffusion on compet-
ization pathways explored in the literature is itiveness i.e. (i.e. Rubashkina et al. 2015), la-
the nature and timing of innovation, tech- bour market impacts (Marin and Vona 2019)
nology diffusion and transfer. On the other and the dynamics of trade and embodied
hand, innovation is an enabler of the sustain- emissions (i.e. Sato and Dechezleprêtre 2015,
able transition because it can turn the decar- Meng et al. 2018).
bonization challenge into a wide set of so-
cial and economic opportunities. Specifically, Systemic approaches have also charac-
innovation promotes competitiveness, can terized the complexity of energy inno-
have positive labor market impacts, and can vation systems, and of the set of actors
increase the access to services and resources and institutions that shape low-carbon
for all citizens (EC 2018a). Innovation is at technology innovation processes (Sagar
the core of “A clear planet for all”, the Euro- and Holdren 2002, Anadon et al., 2016). The
pean vision for a prosperous, modern and cli- interaction of the different elements in an
mate-neutral economy by 2050 (EC 2018b), energy innovation system is complex, as con-
and technological diffusion also plays and nections among actors and institution occur
important role in supporting the achievement at many stages of the technology innovation
of sustainable development goals (Anadon et process, in multiple sectors and countries,
al. 2016; IPCC 2018). and at different scales. Recent research also
points to the key role of behavioral change
Given their importance, the phases, driv- to support low carbon deployment and diffu-
ers and potential impact of innovation in sion (i.e. d’Adda et al. 2017), and to the com-
low-carbon technologies are subjects of plex web of institutions and actors involved
much academic investigation (Carraro in the development and diffusion of low car-
et al. 2010, Popp et al. 2010, Popp 2019). bon technologies (i.e. Hughes and Urpelainen
Available literature explores, for instance, 2015; Geels at al. 2017). This extensive body
the level, growth and productivity of public of evidence inform the design of environ-
and private R&D funding (i.e. Goldstein et al mental and climate policies (i.e. EC 2018a;
2020, Mazzucato 2013) and their complemen- Chan et al. 2017). It also points to the im-
tarity (i.e. Popp and Newell 2012), the way in portance of appropriately modelling and cal-
19ibrating technical change dynamics in both this transition will create several challenges
top-down long-term integrated assessment (Hammond 2018). The understanding of
models and bottom up models (i.e. Iyer et the disruptive potential of digital technol-
al. 2015 and van Sluisveld et al. 2018). ogies, which is a function of both technical
characteristics and non-technical aspect, is
Yet, the framework conditions within still limited (Aghion and Jones 2018). This
which both low-carbon innovation and is partly due to their ground-breaking and
decarbonization are pursued are con- disruptive nature, which makes it hard to
stantly changing. Decarbonization is only extrapolate from previous history/experi-
one of several other mega-trends our soci- ence. Indeed, digital technologies are still
eties are facing, which include asymmetric highly concentrated. In 2014 (latest avail-
global population explosion, globalization, able data), roughly 750,000 industrial ro-
multiple revolutions in healthcare and ac- bots were estimated to be operational in
celerating, exponential information tech- OECD countries, constituting more than
nology development (Hammond 2018). 80% of the global stock. Indeed, Japan, the
Therefore, many new questions arise on United States, Korea and Germany alone
how these mega-trends will impact the in- account for almost 70% of the total num-
novation and technology diffusion needed ber of operational robots. Yet, the People’s
to support the achievement of the low-car- Republic of China leads in the adoption of
bon transition in future decades. robots, with an operational stock of over
The 2D4D “Disruptive Digitalization 86 000 units (OECD 2017).
for Decarbonization” ERC project spe- Digitalization will impact decarboniza-
cifically tackles the interaction between tion through several channels. Digital
digitalization and climate mitigation, technologies consume large amounts of
with a specific focus on Europe. Digital energy (Jones 2018, Horner et al. 2016)
technologies will have disruptive socio-eco- but they contribute to (energy) efficiency
nomic implications for decarbonization in economic and human systems through
narratives and pathways. By 2040, all ma- material input savings and increased coor-
jor energy-demand sectors will be deeply dination (IEA 2017, Huang et al. 2016).
affected by the digital revolution. Trans- Furthermore, the digital transformation
portation will be dominated by electric, au- will have profound distributional effects: it
tomated vehicles fully integrated with the will affect competitiveness (Varian 2018),
electricity system, home environments will trade (Goldfarb and Trefler 2018), and em-
be filled with smart devices and most manu- ployment (Acemoglu and Restrepo 2018;
facturing processes will rely on digital tech- Trajtenberg 2018). Digitalization may ben-
nologies (EC 2014; IEA 2017; Hammond efit certain regions/areas/socioeconomic
2018). In the same time frame, the Europe- groups more than others, as in the case of
an Union aims to be well ahead on the road integrated mobility services, which benefit
towards 2050 climate neutrality (EC 2011). cities more than rural and peripheral areas
Yet, current mitigation policies, which are (OECD 2017). Digital technologies may
disjoint from consideration about the im- also make it easier and cheaper (or harder
pacts of digitalization on energy use and all and costlier) to implement stringent climate
other socio-economic outcomes, will likely policies across sectors and countries (i.e.
be inefficient and/or ineffective in a deeply enhancing policy enforcement).
digitalized world.
While digitalization is expected to be a
At present, whether the digital revolu- fast process, this transformation takes
tion will be an enabler or a barrier for place against entrenched individual
decarbonization is a matter of debate. behaviors, existing infrastructure, the
Forecasts suggest that disruptive change legacy of time frames, vested interest
will happen fast, and experts recognize and slow institutional processes. It also
20requires trust from consumers, producers The 2D4D – Disruptive Digitalization for Decarbonization
and institutions. Finally, digital technologies project runs from October 1st 2020 to September 30th, 2025.
have sector-specific potentials and barriers. Stay tuned by following it on twitter: @2D4D_ERC!
The former includes, for instance, costs, Acknowledgement
material input and infrastructure require-
Elena Verdolini gratefully acknowledges funding from the Eu-
ments, technological maturity, sector-spe- ropean Research Council (ERC) under the European Union’s
cific potential. The latter relate to the Horizon 2020 research and innovation programme (grant
knowledge base (who invents what), mar- agreement No 853487).
ket structure, social acceptance by crucial
actors, regulatory requirements, incentives,
administrative barriers, among others.
Unveiling the link between digitaliza-
tion and decarbonization is crucially
important for industry, transportation
and buildings because these sectors
face the biggest mitigation challenges
(Luderer et al 2018). In 2014, they were
responsible for 26, 25 and 33 percent of
the European final energy consumption,
respectively (EEA 2017). Globally, these
sectors are crucial contributors to GHG
emissions, facing important barriers to
decarbonization. At the same time, digital
technologies will drastically reshape these
three sectors in the decades to come.
With this in mind, over the next five
years 2D4D aims at carrying out com-
prehensive, systematic, large-scale
assessments of the macro-econom-
ic implications emerging from a joint
consideration of digitalization and de-
carbonization needs and pathways. The
project will deploy a rich toolkit of com-
plementary data-based and qualitative re-
search approaches (including data science,
case studies, surveys expert elicitations and
integrated assessment modelling, among
others) to assess the disruptive technical
and socio-economic effects of digitaliza-
tion in different sectors of the economy,
the resulting impact on energy, economic
growth, social development and, conse-
quently, its implications for decarboniza-
tion. This understanding will be crucial to
inform the design and implementation of
“no-regret” decarbonization policies and
portfolios ensuring that digitalization and
decarbonization are mutually enhancing in
the achievement of climate targets and sus-
tainable development goals.
21
21You can also read