Grey-Bruce's State of the Environment Report 2014 - Grey Bruce Health Unit 101 17th St E, Owen Sound, ON, N4K 0A5 Tel: 519-376-9420 Toll: ...
←
→
Page content transcription
If your browser does not render page correctly, please read the page content below
Grey-Bruce’s State of the Environment Report

                                   2014

                       Grey Bruce Health Unit
                       101 17th St E, Owen Sound, ON, N4K 0A5
                       Tel: 519-376-9420 Toll: 1-800-263-3456
                       www.publichealthgreybruce.on.ca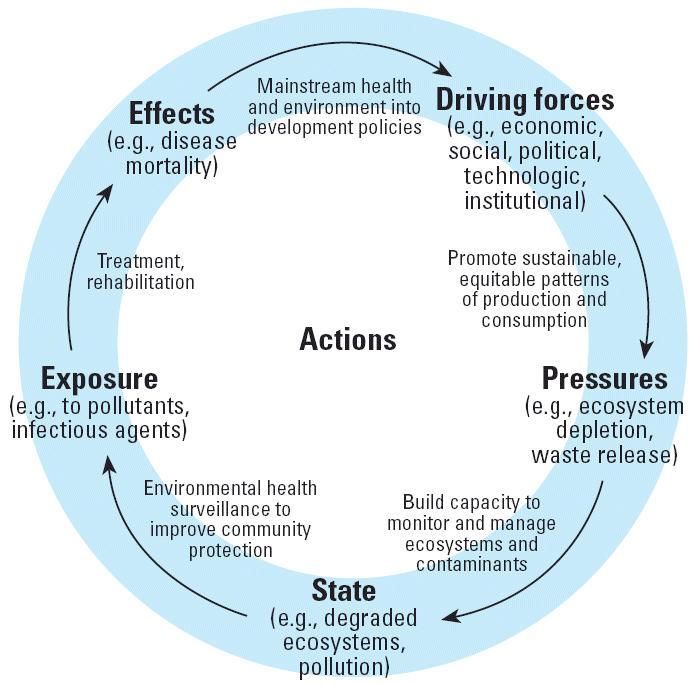
What is in this report?
This is the first assessment of the state of Grey-Bruce’s environment from a health perspective. This
report aims to capture and present information on the state of the environment for 2013 (unless
otherwise stated) in terms of: its condition, the pressures on it and driving forces contributing to those
pressures, human health implications, and societal actions to address environmental concerns. The
information in this report sets out baseline data as a yardstick against which to measure the changing
state of our environment and its health implications for humans in future years.

The focus of this report is the natural and ambient environment; however we acknowledge that
increasingly the built environment is considered part of the broader environment. The built
environment of Grey-Bruce may be addressed in a future report. It is also important to note that this
report is not yet a comprehensive report touching upon all the relevant environmental issues in Grey-
Bruce, but rather a first step in bringing them together.

© November 2014
Grey Bruce Health Unit
101 17th Street East
Owen Sound ON, N4K 0A5

                                                                                                             2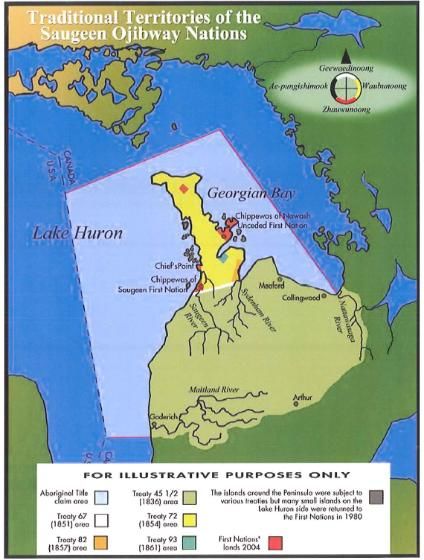
Acknowledgements

This report was researched and written by Steven Lam (MPH – University of Guelph). Alanna Leffley
(Grey Bruce Health Unit), Bob Hart (Grey Bruce Health Unit), and Dr. Donald Cole (University of Toronto)
conceptualized the report, provided direction, vision, and revision support; all of which helped shape
the outline and content of the report.

The report is a cooperative effort of the community as represented by various individuals who provided
valuable input towards the production of Grey-Bruce’s State of the Environment Report 2014. In
alphabetical order, these individuals are:

Andrew Barton, Grey Bruce Health Unit
John Bittorf, Sauble Grey Conservation Authority
Liz Buckton, Municipality of Meaford
Rick Chappell, Ministry of the Environment and Climate Change
Chris LaForest, Bruce County
Ian Mitchell, Ministry of the Environment and Climate Change
Angela Newman, Grey Bruce Health Unit
Various individuals from the Ministry of Natural Resources and Forestry

Many thanks are extended to Virginia McFarland (Grey Bruce Health Unit) for her help with data
analysis.

For further information, please contact:
Alanna Leffley, Senior Epidemiologist
Grey Bruce Health Unit
101 17th Street East, Owen Sound ON N4K 0A5
a.leffley@publichealthgreybruce.on.ca

Suggested citation:
Lam S, Leffley A, Hart B, Cole DC. (2014). Grey-Bruce’s State of the Environment Report 2014. Owen
Sound, Ontario: Grey Bruce Health Unit.

                                                                                                           3
Executive Summary

This first state of the environment report for Grey and Bruce counties sets a solid base from which to
monitor and evaluate the environment in future years. In this report, Grey-Bruce’s environment is
described in terms of: its current condition, pressures on it and the driving forces underlying those
pressures, human health implications, and societal actions to address environmental issues. The
purpose of this report is to inform decision makers, planners, organizations and the broader community
about the condition of the natural environment, whose health is essential to the well-being of residents
of Grey and Bruce counties. As we gain a better understanding of the environment, its health, and its
impact on human health, we can better protect our natural resources and human health.

There is a complex relationship between the environment and human health, and this report attempts
to simplify this relationship into a set of indicators (environmental indicators and ecological indicators).
While indicators were identified for many aspects of the environment, much data required for a
comprehensive picture was not available, incomplete, or not representative of the entire region.
Nevertheless, sufficient data were available to indicate that the Grey-Bruce environment was in
relatively good condition and trends were identified where sufficient data were available (Table 1).

Environmental indicators include indicators of land, air and water quality. For land quality indicators,
baseline energy consumption and greenhouse gas emission levels for Grey-Bruce were recently
established in 2011, allowing for measurement of change over time. Waste diversion rates were
increasing over time and some municipalities in Grey-Bruce have reached Ontario’s waste diversion goal
of 60%. More than half of Grey-Bruce’s land remained as farmland which generates $672 million
annually in gross farm receipts. Soil cover appeared to be increasing over time but there was no data on
other soil quality indicators.

For air quality indicators, air pollution levels consistently met provincial air quality guidelines, the
number of air pollutant exceedances above provincial standards was low, and particulate matter
concentrations have decreased significantly over time (p=0.035); however, it is important to note that
data came from just one monitoring station located in the town of Tiverton in the southern part of
Bruce County.

For water quality indicators, Adverse Water Quality Incident reports showed that municipal drinking
water quality appeared to be good; however private drinking water quality still presented concerns, as
private drinking water samples submitted for testing have decreased over time. Surface water quality
and beach water quality appeared to be in good condition. The number of exceedances above provincial
beach water quality standards was low, with 2013 being the lowest in 5 years. Water levels of Lake

                                                                                                               4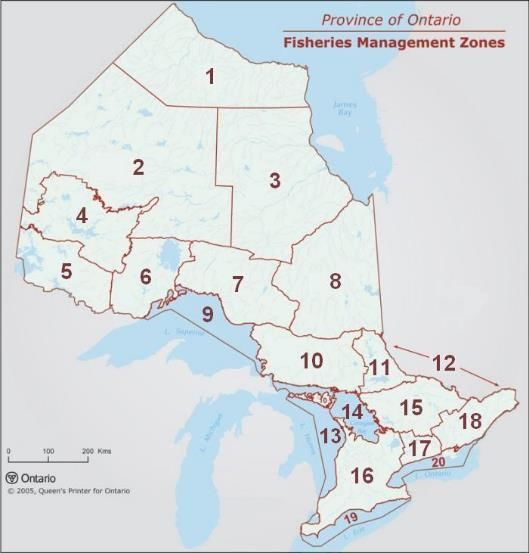
Huron and Georgian Bay appeared to be decreasing over the last 20 years with a record low in 2013,
however water levels rose above-seasonal-average in 2014.

For ecological indicators, the incidence of vector diseases in Grey-Bruce has remained low over time.
Forests and wetlands appeared to be in good condition; however more monitoring data is needed to
determine trends in their ecological indicators. The status of biodiversity and fish and fish habitat could
not be determined due to insufficient data.

Driving forces affect many aspects of the natural environment and include population growth, economic
growth and climate change. Population growth in Grey-Bruce was very low at less than 1% from 2006 to
2011. Economic growth generally leads to more resource use which can be accompanied by pollution
from agriculture, industries and transportation unless managed well; however economic progress in the
region could not be determined due to insufficient data. Grey-Bruce climate indicators showed steady
averages over the last 20 years. The climate indicators studied in this report were not detailed enough
to be able to draw strong conclusions but it appears that present driving forces do not exert large
pressures on the environment.

Pressures on Grey-Bruce’s environment vary depending on the type of environmental health indicator
one examines. For example, for water quality indicators, wetland condition indicators and fish and fish
habitat condition indicators, the main pressures are sewage discharge, agricultural runoff, industrial
leakage, and invasive species. Human health implications arising from the current state of the
environment are documented throughout the report.

Initiatives to address environmental issues by the community, organizations and government bodies are
documented throughout. With this report on the state of the environment, municipalities,
organizations, planners, decision-makers and the broader community have an opportunity to better
understand the natural environment and human health impacts. Regular updates to state of the
environment reporting can help residents of the area stay informed and aware, and help governments
and other stakeholders set priorities for action.

                                                                                                              5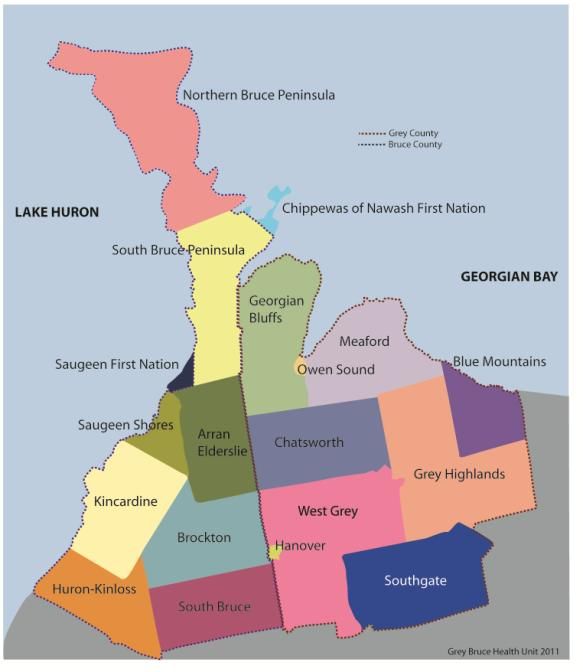
Table 1: Summary of key findings.

Indicator           Summary
Environmental indicators
Land            Energy: Requirements for energy use reporting for the broader public sector were
                recently implemented by the Ministry of Energy in 2011. Baseline energy consumption
                and greenhouse gas (GHG) emissions were established allowing for changes to be
                measured into the future.
                Waste: Waste diversion rates were steadily increasing over time in Grey County
                (p=0.009) but not in Bruce County. In 2012, the waste diversion rate for Grey-Bruce
                was 44%, which is lower than Ontario’s 60% waste diversion goal. Some municipalities
                in Grey-Bruce have reached Ontario’s waste diversion goal, with Owen Sound at 63%
                and Meaford at 60%.
                Agriculture: The number of farms and farm area in Grey-Bruce has gradually decreased
                from 2006 to 2011. Despite the overall decrease in the number of farms and farm area,
                the total farm revenue increased by nearly 12%. Farmland represented 51% of Grey-
                Bruce’s land, and farming generated about $672 million annual in gross farm revenue.
                Grey-Bruce has the most livestock, especially cattle and calves, compared to other
                counties in Ontario.
                Soil: Although soil cover appeared to be increasing over time, there was no data on
                other soil quality indicators (e.g., soil composition, soil biodiversity).
Air             Concentrations of key air pollutants (e.g., particulate matter and ozone) consistently
                met provincial air quality standards.
                The concentrations of particulate matter have decreased significantly over time
                (p=0.035).
                The number of smog days was low, with zero smog days declared in 2013.
                There is a huge data gap in air quality data as the only air quality monitoring station is
                in the town of Tiverton in Bruce County, which cannot represent air quality for all of
                Grey-Bruce.
Water           Drinking water quality: The number of Adverse Water Quality Incident reports from
                Grey-Bruce water systems from 2009-2013 was consistently low, and corrective action
                and re-testing resulted in the Ontario Drinking Water Quality Standards being met.
                While fewer owners of private wells were getting their well water tested over time,
                adverse results from total coliforms decreased significantly over time (p=0.004) and
                adverse results from E. coli appeared steady over time.
                Surface water quality: The majority of watersheds in Grey-Bruce score an “A” or “B” in
                terms of surface water quality.1
                Ground water quality: All wells in the Saugeen Valley Conservation Area scored an “A”
                in terms of ground water quality. The ground water quality in the Grey Sauble

1
    A = Excellent conditions and B = Good conditions, according to Conservation Authority Watershed Report Cards.

                                                                                                                    6
Conservation Area could not be determined due to insufficient data.
                 Beach water quality: The number of exceedances above provincial beach water quality
                 standards was low, with 2013 being the lowest in 5 years.
                 Water quantity: The water levels of Lakes Huron-Michigan appeared to be decreasing
                 over time. In January 2013, water levels dropped to their lowest point in 20 years,
                 however water levels have risen above-seasonal-average in 2014. Water quantity did
                 not appear to be a concern for municipal water systems in the region.
Climate          Climate change indicators (average temperatures and rainfall) appeared to be steady
change           over the last 20 years but further climate change and variability indicators were not
                 explored.
                 There was a low number of heat alerts in Grey-Bruce over the last 10 years.
Ecological indicators
Vectors          The number of cases of Lyme Disease and West Nile Virus in Grey-Bruce was very low
                 over time, with identified cases likely being travel related. There was no human cases
                 of eastern equine encephalitis in Grey-Bruce.
Biodiversity     66 species were identified as ‘species at risk’ Grey-Bruce. Data was not available on
                 where these species live.
Fish and fish    Progress was made in fish community objectives for Lake Huron; however objectives
habitat          were largely unmet as of 2010. Data was not available on the state of fish and fish
                 habitat.
Forests          The majority of watersheds in Grey-Bruce scored an “A” or B” in terms of forest quality.
Wetlands         The majority of watersheds in Grey-Bruce scored an “A” in terms of wetland quality.

                                                                                                            7
Preface
In May of 2014, the Grey Bruce Health Unit hosted a Healthy
Communities Conference to provide an opportunity to pool local
knowledge, skills, and energies. Areas of discussion were about how we
can have healthy environments and healthy local public policy, ensure
our communities support people at highest risk for poor health as well
as many other related topics.
The conference was opened with the following prayer by Jimelda
Johnston of the Southwest Aboriginal Health Access Centre who kindly
agreed to share it for this report.
“WeyWeyNaaboozhoo,
It’s great to be here, an honor to be part of this historical gathering in
the Saugeen Territories, a land sacred to indigenous people around the
Great Lakes.
Our ancestors are smiling today and happy to be included in such an
important event as Healthy Communities.
One of our greatest values in life is relationship – right relationship –
within Creation, our families, our community, our nation and beyond,
nation to nation, community to community, family to family and self to
creation.
Another of our greatest values in life is inviting ‘Zahweygizhemidoo’
(Our Creator) into the work, play, and relationships, so if we can for a
moment before the event unfolds, focus and remember who we are
addressing:
Boozhoo Mishomis, Boozhoo Nokomis, Ogimah Binesse Kwe is my
name, Maang Dodem, I am Mediwiwin, I am Anishnabae Kwe
Creator, maker and giver of all life, we turn to you at this time of
Knowledge seeking and creating right relationship with each other and
ask you to be among us… and we give gratitude for our life and all the
ways you share your perfect essence, you’re most beautiful perfect
Creation. We are grateful for the four directions and the spirit keepers
of those directions: Waabanong, Zawhwenong, Negahbenong,
Giwaydinong whom have been fulfilling their responsibility from the
beginning of time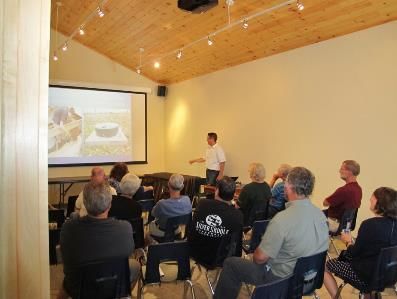
Miigwetch, for giving us a Loving Mother that provides us with all that
we need to enjoy and live a good life, to help us heal, help us grow,
nurtures us, protects us, provides every medicine for us, and loves us
like a Mother with a heart, we are grateful.
Miigwetch, for the water that flows through her, and is the essence of
all life. We are grateful for the Thunderbirds that bring the purification
and nurturing so essential for our babies and the water that surrounds
them before their feet touch our loving mother, water that is so
essential for future generations. We are grateful for the water, the
water beings and the spirit keepers of the water, which are so essential
to life for without water no life will survive. And for Grandmother
Moon who in her waning and waxing works with the ebb and flow of
water throughout Creation, both within and outside ourselves. We are
grateful for our Grandmother Moon and this perfect essence of
Creation.
Geezis, our Grandfather Sun’s movement is closer to our Mother giving
warmth and balance, essential to life and sustenance in this beautiful
Creation. We are grateful.
We are grateful for the winds and air, from our first breath to our last
breath. We have been blessed with the touch both within and outside
ourselves, experiencing YOUR gentleness and strength. We are Grateful
for the winds of the four directions that are so essential to life…
Miigwetch, for the animals and birds, swimmers and flyers, crawlers,
those below and above. Gratitude for our Dodems, those ones that
Honor us to walk with them, and speak for them as they cannot speak
for themselves. We are grateful for our relatives, so essential to the
balance and enjoyment of this Creation.
We ask, invite you into this time and place to acknowledge this life,
which is not so much about our story, but your story and honouring the
essence of healing, healthy relationships and healthy communities.
There is so much to be grateful for, we can’t even remember it all at this
time, but know from our heart that we are grateful for everyone and
everything in Creation.
Miigwetch, Zahweygizemidoo
Miigwetch Zahweygizemidoo
Miigwetch Zahweygizemidoo
Miigwetch Zahweygizemidoo
Neh Kahnegenah………All my relations”
9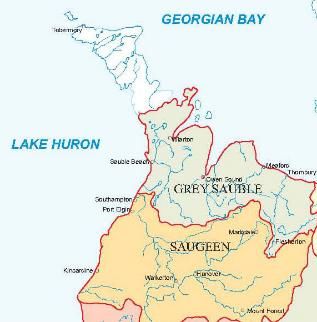
Table of Contents
Acknowledgements.......................................................................................................................... 3
Executive Summary ................................................................................................................ 4
List of Figures ................................................................................................................................. 12
List of Tables .................................................................................................................................. 12
Background .............................................................................................................................. 13
   Purpose ...................................................................................................................................... 13
   Ecosystem health ....................................................................................................................... 14
   Reporting and framework .......................................................................................................... 15

Health Unit Counties Profile ............................................................................................. 16
   What is unique about Grey-Bruce?............................................................................................ 16
   Aboriginal population ................................................................................................................ 17
   Population growth and economic growth ................................................................................. 18

Environment ............................................................................................................................ 19
   Land............................................................................................................................................ 19
       Energy use .............................................................................................................................. 19
       Waste ..................................................................................................................................... 21
       Agriculture ............................................................................................................................. 23
       Soil .......................................................................................................................................... 27
   Radon ......................................................................................................................................... 29
   Climate change........................................................................................................................... 30
   Air ............................................................................................................................................... 35
   Water ......................................................................................................................................... 40
       Drinking water quality............................................................................................................ 40
       Surface water quality ............................................................................................................. 43
       Groundwater quality .............................................................................................................. 46
       Beach water quality ............................................................................................................... 49
       Water quantity ....................................................................................................................... 51

Ecological Indicators ............................................................................................................ 53
   Vector monitoring ...................................................................................................................... 53
   Biodiversity ................................................................................................................................ 57

                                                                                                                                                            10
Fish and fish habitat monitoring ................................................................................................ 59
Forest conditions ....................................................................................................................... 61
Wetland conditions .................................................................................................................... 63
Conclusion ................................................................................................................................ 65
Challenges and Future State of the Environment Reporting ......................................................... 67
References ..................................................................................................................................... 68
Appendix A – Saugeen Ojibway Nation Territory Map .................................................................. 75
Appendix B – Waste Disposal Information .................................................................................... 76
Appendix C – Municipal Drinking Water Systems.......................................................................... 77
Appendix D – Conservation Authority Grading System ................................................................. 79
Appendix E – Source Protection Area Map .................................................................................... 80
Appendix F – Beach Information.................................................................................................... 81
Appendix G – Full List of Known Species at Risk ............................................................................ 82
Appendix H – Definitions of Species at Risk Categories................................................................. 84
Appendix I – Fishery Management Zones ...................................................................................... 85
Appendix J – Data Gaps.................................................................................................................. 86
11List of Figures
Figure 1. The DPSEEA Framework. ....................................................................................................... 15
Figure 2: Map of Grey-Bruce municipalities. ....................................................................................... 17
Figure 3: Map of Conservation Authority boundaries. ........................................................................ 17
Figure 4: Total residential waste generated per person from 2008-2012........................................... 22
Figure 5: Percentage waste diverted from 2008-2012. ....................................................................... 22
Figure 6: Area of land under tillage in Grey-Bruce from 2006-2011. .................................................. 27
Figure 7: Annual amount of rainfall from 1992-2013. ......................................................................... 31
Figure 8: Annual average summer temperatures (Jun, Jul, Aug) from 1992-2013. ............................ 31
Figure 9: Annual average winter temperatures (Dec, Jan, Feb) from 1993-2013. .............................. 32
Figure 10: Annual number of heat alerts from 2003-2013. ................................................................. 32
Figure 11: Number of emergency department visits due to natural cold and heat from 2003-2012. 33
Figure 12: Average annual ozone levels from 2003-2013. .................................................................. 36
Figure 13: Number of hourly ozone exceedances (>80 ppb) from 2003-2013.................................... 36
Figure 14: Average fine particulate matter (PM2.5) levels from 2003-2013. ........................................ 37
Figure 15: Number of fine particulate matter (PM2.5) Exceedances (>30 µg/m3) from 2003-2013. ... 37
Figure 16: Number of smog days for Grey-Bruce and Ontario from 2003-2013. ................................ 38
Figure 17: Overall surface water quality of watersheds in Grey-Bruce. .............................................. 44
Figure 18: Percentage of beach water sample exceedances above standard from 2004-2013.......... 49
Figure 19: Surface water elevation for Lake Michigan-Huron from 1994-2014. ................................. 51
Figure 20: Passive surveillance of ticks from 2010-2013. .................................................................... 54
Figure 21: Number of human cases of Lyme disease from 2005-2013. .............................................. 54
Figure 22: Number of human cases of WNV from 2002-2012. ........................................................... 56
Figure 23: Overall forest condition of watersheds in Grey-Bruce. ...................................................... 61
Figure 24: Overall wetland condition for watersheds in Grey-Bruce. ................................................. 63
Figure 25. Healthy communities. ......................................................................................................... 65
List of Tables
Table 1: Summary of key findings. ..........................................................................................................6
Table 2: Energy consumption of Grey-Bruce Municipalities in 2011................................................... 20
Table 3: Total number of farms, farm area, and farm revenue in Grey-Bruce in 2006 and 2011. ...... 24
Table 4: Number of cattle, calves, goats, sheep and lambs by top county producers in 2011. .......... 24
Table 5: Number of boil water advisories and adverse water quality incidents from 2009-2013. ..... 41
Table 6: Private water sample test results for bacteria (total coliforms and E. coli) from 2003-2013.42
Table 7: West Nile virus monitoring in Grey-Bruce from 2001-2013. ................................................. 55
Table 8: Number of species at risk in Grey-Bruce in 2014. .................................................................. 57
12Background
This is the first State of the Environment Report (SOER) oriented towards human health for Grey and
Bruce counties. The development of the report was led by the Grey Bruce Health Unit (GBHU) with
involvement from external agencies. Stakeholders from the GBHU, Ministry of the Environment and
Climate Change, Ministry of Natural Resources and Forestry, Grey Sauble Conservation Authority,
and municipal and county planners provided material or advice for the report, or commented on
specific aspects of the report.
Purpose
The purposes of the report are to:
Provide information on the current state of Grey-Bruce’s natural environment;
Describe pressures on the state and driving forces behind those pressures;
Describe implications for human health and actions to mitigate adverse health effects; and
Increase awareness among decision-makers and the community about the importance of
the environment, leading to more informed decisions surrounding management of the
environment.
Human health and well-being are affected by the quality of the natural environment. A healthy
natural environment can help us adapt to climate change, population growth and economic growth.
Many people know that the air we breathe, the water we drink, and the land that surrounds us
influence the health of individuals and communities. It is important to understand that ecological
resources such as forests, wetlands and natural areas are also important to our health as they help
to cool our environment, reduce the impacts of flooding and other natural hazards, as well as
support sustainable water resources. A SOER can help us determine how healthy Grey-Bruce’s
environment is, by documenting the quality of the air, water, land, and ecological resources.
Further, SOERs can inform policy and decision makers on priority areas for actions to ensure a
healthy future for Grey County and Bruce County.
Traditionally, a pressure-state-response (PSR) framework, a linkage-based framework, is used to
describe environmental indicators in SOERs. This framework is described below:
Pressure – humans exert pressure on the environment (e.g., burning of fossil fuels);
State – the state/condition changes as a result of the pressure (e.g., worsening air quality);
Response - develop and implement policies which influence human activities (e.g., initiatives to
reduce use of fossil fuels).
13A comprehensive SOER takes into account indicators of stress on the environment, indicators of the
state of the environment, and indicators of societal response (Rapport and Singh 2006). Although
the PSR framework incorporates these elements, it has limitations. Firstly, it provides a static
representation of the environment and ignores significant interactions between components.
Secondly, a ‘bottom line’ that would provide the community with an overall assessment of
environmental trends is lacking with this framework. Thirdly, the PSR framework has been
considered less suitable for describing human health linkages (WHO 1997). Most importantly, this
framework alone does not provide a sense of immediacy to motivate actions to protect the natural
environment, and subsequently health (Rapport and Singh 2006).
Ecosystem health
Ecosystem health, or ‘Ecohealth’, is a transdisciplinary approach that recognizes the complex
biophysical, social, and economic relationships between ecosystems and human health (Blockstein
and McManus 2007). Ecosystems provide many ecosystem goods and services that are vital to
human health and livelihood. Humans in turn are altering the capacity of healthy ecosystems to
deliver goods and services. Greater awareness of the value of ecosystems is needed among decision-
makers and the public at large. In a SOER, it is important that we not only consider the state of air,
water, and land, but also the state of ecosystems and how they affect human health.
In order to better understand the linkages between the health of ecosystems and health of humans,
collaboration is needed among sectors, disciplines and diverse stakeholder groups to integrate their
perspectives on ecosystems and health. Individuals from public health, Ministry of the Environment
and Climate Change, Conservation Authorities, Ministry of Natural Resources and Forestry, and
municipal and county planners were consulted in the creation of this report.
An environmental scan of SOERs in Ontario showed that an Ecohealth focus has been used in past
SOERs such as “Focus on Our Environment: York Region’s State of the Environment Report 2005”
(YRHSD 2005) and “Renfrew County State of the Environment Report 2004” (Harrison 2004). A
linkage-based framework which links the environment and ecosystems to human health was not
used in past SOERs. Our report attempts to link these factors by using the framework below.
14Reporting and framework
All information used in this report were compiled from a variety of sources and assembled into the
Driving Force, Pressure, State, Exposure, Effect and Action (DPSEEA) framework (Figure 1). The
DPSEEA framework was created by the World Health Organization to guide the development of
environmental indicators. It aims to describe a comprehensive picture of the way broad driving
forces exert pressures on the state of the environment, affecting human health through various
exposure pathways. For some indicators that do not fit well within this framework (i.e., no clear
exposure or health effect), the Driving Force, Pressure, State, Impact and Response (DPSIR) was used
(European Environment Agency 1997). Instead of describing the exposure or health effect of the
indicator, the DPSIR framework describes the impact of the indicator on human health and
ecosystems. For the purposes of our report, response and action are considered synonymous.
Figure 1. The DPSEEA Framework.
(Source: Carneiro et al. 2006, adapted from Corvalan et al. 2000).
Reproduced with permission from Environmental Health Perspectives.
15Health Unit Counties Profile
What is unique about Grey-Bruce?
Grey and Bruce counties are upper-tier, regional municipalities located in Southwestern Ontario
nested between Lake Huron and Georgian Bay (Figure 2). Together they have a population of
158,760 across 8,601 km2 (Statistics Canada 2011a), encompassing 17 municipalities each with its
own unique characteristics including culture, resources and environmental surroundings.
Major tourist attractions located within Grey-Bruce include the Bruce Peninsula National Park,
several beaches (e.g., Sauble Beach, Southampton Beach, Northwinds Beach), the Bruce Grey Trails
Network, many conservation areas and the Niagara Escarpment. The Niagara Escarpment is a
United-Nations-designated “world biosphere reserve” and is one of only twelve such reserves in
Canada. These reserves are recognized for their balance between development and conservation.
The Niagara Escarpment is at the heart of many of Grey-Bruce’s natural attractions and one of
Canada’s most significant landforms. Grey-Bruce’s unique natural features support the area’s
recreation, agriculture and tourism industries.
Grey-Bruce has abundant freshwater assets such as Lake Huron, Georgian Bay and many rivers,
wetlands and watersheds. We all live in a watershed; an area of land that drains into a common
waterway such as a river, stream, lake or wetland. Each watershed offers natural beauties of
beaches, waterfalls or woodlands and provides ecosystem goods and services such as safe drinking
water, clean air, and sustainable water resources which contribute to livable communities. The
watersheds of Grey and Bruce counties are looked after by five conservation authorities, with Grey
Sauble Conservation Authority and Saugeen Valley Conservation Authority covering the majority of
Grey-Bruce (Figure 3). Nottawasaga Conservation Authority (Grey Highlands, The Blue Mountains),
Maitland Valley Conservation Authority (Huron-Kinloss, South Bruce) and Grand River Conservation
Authority (Southgate) cover smaller parts of Grey-Bruce.
16Figure 2: Map of Grey-Bruce municipalities. Figure 3: Map of Conservation Authority boundaries.
Grey Bruce Health Unit, 2011. Conservation Authorities of Ontario, 2012.
Aboriginal population
Aboriginal people including First Nations and Métis account for 2.9% of the total population in Grey-
Bruce (Statistics Canada 2011a). Aboriginal people have a major role to play in environmental
management and development within their traditional territories and have a close connection to the
land. There are three distinct Aboriginal groups in Grey-Bruce including the First Nations, Métis
Nation of Ontario and Historic Saugeen Métis. There are two First Nations communities in Grey-
Bruce which include the Chippewas of Nawash Unceded First Nation (located near Wiarton in Bruce
County) and the Chippewas of Saugeen First Nation (located near Southampton in Bruce County).
These two communities share a common Traditional Territory which covers much of Grey-Bruce
(Appendix A). When working together on matters of mutual interest, they are collectively identified
as the Saugeen Ojibway Nations. The Historic Saugeen Métis, also known as the ‘Lake Huron
watershed Métis’, are an independent Métis community located in Southampton (Bruce County).
The Métis Nation of Ontario is an Aboriginal organization for the Métis population and is active in
conservation efforts in the Georgian Bay area.
17Population growth and economic growth
Population growth can be determined by looking at the change in population since the last census. A
comparison of the 2011 census with the 2006 census indicates that Ontario’s population increased
by almost 6% (Statistics Canada 2011a). In Grey County, the population increase was 0.2% while in
Bruce County the population increase was 1.2%. For Grey-Bruce, the overall increase was 0.6%.
The top three communities in terms of population growth were: Chippewas of Nawash First Nation
(↑12.9%), Saugeen Shores (↑8.0%), and Hanover (↑4.8%). The top three communities in terms of
population loss were: The Blue Mountains (↓5.5%), South Bruce (↓4.3%) and Saugeen First Nation
(↓4.2%) (Grey Bruce Health 2012).
Economic growth could not be estimated for Grey-Bruce. While measures of economic growth exist
at the national and provincial level exist (e.g., gross domestic product), measures of economic
growth at the municipal level is not well established.
Rural versus urban areas
Grey-Bruce is largely rural with 53% of the Grey-Bruce population living in a rural area and 47% living
in small population centres (Statistics Canada 2013). By comparison, only 19% of Ontarians live in a
rural area, with 12% living in small population centres, 9% living in medium population centres, and
the remaining 60% living in large urban population centres. The City of Owen Sound (population
22,000) is the largest city or town in Grey-Bruce. Grey and Bruce counties share a public health
agency, the Grey Bruce Health Unit (GBHU).
18Environment
Land
Land use in Ontario is guided by several pieces of legislation and accompanying regulations. The
Planning Act and the Provincial Policy Statement are two significant components of the planning
system. The Planning Act sets out the ground rules for land use planning in Ontario and describes
how land uses may be controlled and who may control them (MMAH 2013). The Provincial Policy
Statement, issued under the Planning Act, provides direction on matters of provincial interest
related to land use planning and development. It recognizes the complex inter-relationships among
economic, environmental and social factors in planning. It includes policies on key issues that affect
our communities, such as the efficient use and management of land and the protection of the
environment and resources. The Niagara Escarpment Plan is the Ontario Government’s land use
plan that controls development on the Escarpment.
The Official Plan is an important tool when making land use decisions. Official Plans are produced by
upper and single tier municipalities in Ontario and are used to guide development in the area that
the municipality has jurisdiction. Goals of Official Plans include respecting the natural environment,
minimizing adverse impacts on the environment, protecting significant features and water quality.
They also provide policies and guidelines for the protection of natural heritage and archaeological
resources for their economic, environmental and social benefits. There are two upper-tier Official
Plans in Grey-Bruce; the Grey County Official Plan and Bruce County Official Plan.
Energy use
Energy is important to our daily life and is an important pressure on the environment. The
production and use of energy impact our environment by contributing to air pollution, global
warming, disturbances of ecosystems and potential radioactivity from nuclear waste. Bruce Power,
the world’s largest operating nuclear facility, is located in Southern Bruce County near Kincardine.
Emerging energy alternatives in Grey-Bruce are solar and wind. Although solar and wind are clean
and viable sources of energy supply, they vary more in production than nuclear power. It is crucial to
use energy efficiently and to conserve it wherever possible. Indicators of energy use include
electricity consumption and greenhouse gas emissions.
19Driving force: Population growth, economic growth (e.g., industries, transportation, and agriculture)
are driving forces acting on energy use. Both provincial and local economic growth are drivers acting
on energy use as Grey-Bruce is a net exporter of electricity from Bruce Power.
Pressure: Methods of energy production and demand for energy are pressures.
State: In 2011, Ontario’s Ministry of Energy introduced Regulation 397/11 under the Green Energy
Act 2009 which requires that all municipalities and selected public sector bodies develop energy
Conservation and Demand Management Plans (Ministry of Energy 2014a). As a first step in the
process, municipalities must provide summaries of their 2011 energy consumption and greenhouse
gas emissions for a range of facilities. They were required to report to the Ministry of Energy by July
1, 2013 and every year thereafter. See Table 2 below shows the energy consumption and
greenhouse gas emissions for Grey and Bruce counties in 2011.
Table 2: Energy consumption of Grey-Bruce Municipalities in 2011.
Municipality Total Electricity Total Green House Gas
Consumption (kWh) Emissions (kg CO2)
Grey County
Owen Sound 8,795,105 2,033,551
Chatsworth 853,016 218,123
Hanover 7,167,584 1,918,307
Georgian Bluffs 1,175,054 244,928
The Blue Mountains 3,883,272 812,199
Southgate 732,680 162,725
Meaford Not available Not available
Grey Highlands 2,321,419 551,743
West Grey 2,021,618 418,664
Bruce County
Northern Bruce 1,252,476 271,452
Peninsula
Huron-Kinloss 2,063,780 305,373
Kincardine 6,609,755 1,172,114
Arran-Elderslie 2,200,253 524,288
Brockton 1,945,871 467,493
Saugeen Shores 3,528,209 439,565
South Bruce 1,585,669 375,253
South Bruce Peninsula 2,192,719 408,033
Energy use and greenhouse gas emissions for the Broader Public Sector, Ministry of Energy, 2014b.
Impact: Burning of fossil fuels, such as coal, natural gas and oil produces a portion of Ontario’s
electricity but also the majority of greenhouse gas emissions, contributing to climate change.
Ontario’s energy supply mix is about 59% nuclear, 23% hydro, 11% gas, 2% coal and 3.4% wind
(Bruce Power 2013). Wind turbines are found throughout Grey-Bruce and produce little or no
pollution or greenhouse gases; however they are perceived as a source of health concern among
20some residents. A recent large study found an association between wind turbines and distress in
humans, however future research is needed to determine if a causal relationship exists or not (Arra
et al. 2014). Nuclear power also generates electricity which produces no air pollution or global
warming emissions when they operate. This too concerns some residents about the risk of radiation
coming from Bruce Power, though current radiation emissions from Bruce Power are well within
regulatory limits (Bruce Power 2014).
Response: Bruce County has an energy conservation plan (2014-2018) to reduce energy
consumption and greenhouse gas emissions (Bruce County 2014a). The Saugeen Valley Conservation
Authority has educational programs on energy conservation (Saugeen Conservation 2014).
Municipalities are working on Energy Conservation and Demand Management Plans to support
energy planning to reduce energy consumption and its related environmental impact. There are
many conservation and renewable energy programs available in Ontario through the Ministry of
Energy.
Data Challenge: One municipality is still working on their energy consumption and greenhouse gas
emissions report. As reports become available, a complete baseline of energy consumption and
greenhouse gas emissions can be determined and trends observed.
Waste
Reduction, reuse and recycling of waste materials are positive actions that reduce our impact on the
land. Converting and diverting waste reduces energy needed to collect and transport waste to
landfills and are important for extending the life of landfill sites. These actions have societal,
economic and environmental benefits that are vital for a sustainable community. Promoting
sustainability in our natural environment can help reach the goal of having a healthy community.
In Bruce County, the responsibility for waste management is split between the county and local
municipalities (Bruce County 2014b). Local municipalities are responsible for waste collection, blue
box recycling, electronics recycling and landfill site operations. Bruce County manages the
Household Hazardous and Special Waste Collection Program, is involved in waste management
education, and monitors the capacity and operations of the local landfill sites. In Grey County, the
responsibility for waste management is with local municipalities (Grey County 2014a).
Responsibilities include waste collection, recycling, landfill site operations and hazardous waste
disposal.
Indicators of the state of waste include the total residential waste generated per person and the
residential waste diversion rate. Residential waste accounts for approximately 34% of landfill waste
in Grey-Bruce (estimated using provincial ratio to residential waste from Statistics Canada). As the
population grows, it is important that the waste generated per person decreases to minimize impact
on landfills. The residential waste diversion rate is the percentage of Blue Box and other residential
waste that is kept out of landfill each year (WDO 2014a).
21Driving force: Population growth and economic development (e.g., industries) are driving forces for
waste generation.
Pressure: Levels of packaging and changes in consumption patterns are pressures on landfills.
State: The total residential waste generated per person in Grey-Bruce has not changed significantly
over time (Figure 4). The amount of waste diverted from landfills has increased significantly over
time for Grey County (p=0.009) but not for Bruce County (Figure 5). It is important to note that each
municipality in Grey-Bruce has its own waste management plan and so has very different waste
diversion rates. Please see Appendix B for total residential waste generated and diverted per year
for individual municipalities.
450 50%
Residential Waste Generated
Percentage Waste Diverted
400
350 40%
300
30%
(kg/person)
250
200 20%
Grey Grey
150
100 Bruce 10% Bruce
50
0 0%
2008
2009
2010
2011
2012
Year Year
Figure 4: Total residential waste generated Figure 5: Percentage waste diverted from
per person from 2008-2012. 2008-2012.
Residential Generally Accepted Principles (GAP) Diversion Residential Generally Accepted Principles (GAP) Diversion
Rates, Waste Diversion Ontario. Rates, Waste Diversion Ontario.
Fun Fact: According to Waste Diversion Ontario’s 2012 Top 20 Municipalities for Diverting
Residential Waste, Owen Sound ranks second best at 63.09% (WDO 2014b). Three other
municipalities in Grey-Bruce are also on the list, including Meaford at 4th place with 59.75%.
Impact: The landfill capacity is limited and landfills take up valuable land space. Landfills also
produce greenhouse gases which contribute to climate change. Many materials that end up as
waste contain toxic substances. Over time, toxins from landfills have potential to leach into our soil
and ground water, becoming an environmental and health hazard.
Response: Decreasing the environmental health impact of landfills can come from producing less
waste and diverting more waste. Waste recycling in Grey-Bruce is growing each year thanks to the
efforts of municipalities and provincial governments. Most municipalities in Grey-Bruce have a
22waste management plan to achieve the provincial 60% waste diversion target (no target year
specified). These management plans include strengthening existing or developing new waste
diversion programs, developing educational campaigns to promote recycling, and performance and
target monitoring. The Province provides long term direction for municipalities to move forward.
Composting is the natural breakdown of organic material by bacteria and fungi. Most household and
yard waste can be composted and most municipalities in Grey-Bruce have a leaf and yard waste
composting program. Further, homeowners can compost at home through a backyard composter.
Through the Blue Box Program which began in 2004, Ontario households play a key role in diverting
packaging and printed paper waste from landfills (WDO 2014b). Almost 7 million tonnes of
recyclable materials have been diverted since 2004. Each year, Waste Diversion Ontario requires
municipalities to complete a survey, called the Municipal Datacall, in order to be eligible for funding
for the Blue Box Program. Data collected through the Municipal Datacall allow Waste Diversion
Ontario to monitor the effectiveness and efficiency of the program.
Data Challenge: Industrial, commercial and institution (ICI) waste account for a large percentage of
landfill waste each year (66%), yet very little data is available on ICI diversion rates or waste
composition. Because of the lack of data and reporting requirements, a trend in ICI waste diversion
could not be determined.
Agriculture
Agricultural land is beneficial for the production of food for humans and animals and it is necessary
for sustainability. It is dependent on ecosystem services including the hydrological cycle, pollination,
biological pest control and maintenance of soil structure (Power 2010). Agriculture is an important
sector of Grey-Bruce’s economy and is a large component of the region’s land use. Agriculture can
also retain a green environment and provide visual relief from urban development.
Driving force: Climate change, population growth and economic growth are driving forces acting on
agriculture.
Pressure: Climate variability, extreme weather events (e.g., droughts), warming weather, water
quantity and quality, farming practices, pest and disease infestations, land use, and demand for
agricultural products are pressures relevant to agriculture.
State: More than half (58% or 2360 km2) of the total land area of Bruce County is farmland, and
nearly half (44%, 1986 km2) of the total land area of Grey County is farmland (Statistics Canada
2011b). The number of farms and farm area in Grey-Bruce has decreased from 2006 to 2011 (Table
3). Despite the overall decrease in number of farms and farm area, total farm revenues increased by
nearly 12%. Farms are becoming smaller and more productive.
23Table 3: Total number of farms, farm area, and farm revenue in Grey-Bruce in 2006 and 2011.
Grey County Bruce County
2006 2011 2006 2011
Total number of farms 2,687 2,248 2,259 2011
% change in number of
↓16% ↓11%
farms
% change in number of
↓13.5%
farms for Grey-Bruce
Total farm area (acres) 567,212 490,707 613,156 583,239
% change in farm area ↓13.5 ↓4.9
% change in farm area for
↓9.2%
Grey-Bruce
Gross farm revenues ($) 267,295,850 288,295,498 338,509,444 384,427,884
% change in gross farm
↑7.9% ↑13.6%
revenues
% change in gross farm
↑11.7%
revenues for Grey-Bruce
2011 Census of Agriculture, Statistics Canada
Grey-Bruce has a lot of livestock compared to other counties in Ontario, with cattle and calves being
the most common type of livestock produced (Table 4).
Table 4: Number of cattle, calves, goats, sheep and lambs by top county producers in 2011.
Rank County Number of farms Total
reporting
Cattle and Calves
1 Bruce 1,224 158,710
2 Wellington 1,241 142,197
3 Huron 1,002 129,529
4 Grey 1,299 111,208
Goats
1 Oxford 104 12,086
2 Bruce 117 10,390
3 Perth 131 9,660
4 Grey 114 8,217
Sheep and Lambs
1 Wellington 208 27,548
2 Huron 191 26,166
3 Grey 262 25,181
4 Bruce 154 21,020
2011 Census of Agriculture, Statistics Canada.
Impact: The high number of livestock farms in Grey and Bruce counties can result in large amounts
of manure, potentially threatening ecosystems. Nutrient and pesticide runoff can negatively affect
water quality of lakes and streams. Animal waste is a major source of nitrates and its entry into lakes
24and streams contribute to algae blooms. Algae blooms can lead to increased treatment needs for
drinking water and negative impacts on recreational activities such as swimming, fishing and
tourism. Further, drinking water can be compromised leading to enteric illness in humans.
Response: The region could take a leadership role in slowing the decrease in number of farms and
farm land area. Supporting agriculture and increasing the ability for farmers to be economically
sustainable could be incorporated into county Official Plans. Further, promoting stewardship
programs targeted towards farmers can mitigate adverse environmental impacts associated with
agriculture.
Ontario Farmland Trust protects and preserves Ontario farmlands and associated agricultural
features through land securement, stewardship, policy research and education (Ontario Farmland
Trust 2014).
The Nutrient Management Act 2002 addresses some of the agricultural runoff concerns by
identifying how much manure is produced and stored on the farm, how runoff is managed and a
plan for unforeseen circumstances or emergencies. Healthy Lake Huron is an initiative led by a team
of dedicated environmental professionals to address the algae problem in Lake Huron through
science and policy objectives. For more information, please visit healthylakehuron.ca.
Data challenge: Run-off from agricultural operations contributes to water pollution, but there is no
data on the extent of agriculturally related pollution.
25Environmental Awareness on the Farm
An Environmental Farm Plan (EFP) is an assessment tool that farm families can use to identify and
develop best practices for on-farm environmental stewardship in up to 23 different areas on the farm.
With this tool a farm's environmental strengths and areas of concern are identified and a realistic
action plan with a time table is produced. Environmental cost-share programs may be available to
assist in implementing projects. Detailed information about EFPs can be obtained from the Canada-
Ontario Environmental Farm Plan website.
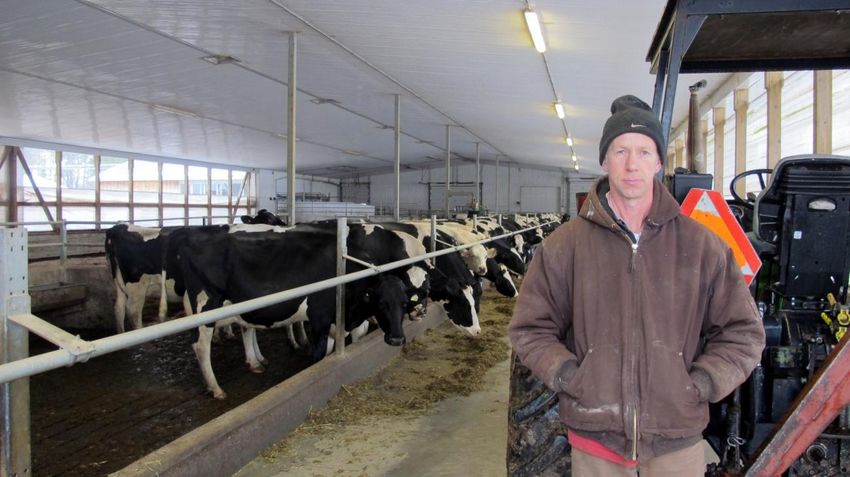
Locally, the Long Alley Organic Dairy Farm, run by Ingo Huesing and his family, has had an EFP in
place for several years. As part of their plan, the Huesing family has constructed fully contained
manure storage on the farm to protect ground and surface water. As well, they capture surplus heat
from the onsite yoghurt-making operation to provide hot water in the barns.
Ingo Huesing, Long Alley Farm
26Soil
Healthy soil support the growth of plants and animals and provides humans with clean air, food, and
water. It serves as the foundation for sustainable agriculture as well as the foundation for homes
and infrastructure. The wide range of soil functions makes it a crucial environmental media and it is
important that soil health is monitored.
Soil cover is important for maintaining organic matter. Organic matter holds nutrients and supports
soil biodiversity. During farming practices, disturbances of soil should be kept at a minimum through
minimal tillage. Tillage involves preparing soil for planting or seeding (Statistics Canada 2008).
Conventional tillage, conservation tillage and no tillage are defined by the amount of crop residue
left on the ground. The zero-till approach avoids any mechanical tillage of soil and attempts to keep
soil disturbance to a minimum. Higher levels of tillage result in higher loss of soil cover.
Driving force: Climate change, land use, population growth are driving forces acting on soil
pressures.
Pressure: Extreme weather events, farming practices (e.g., tillage, erosion, and compaction), loss of
biodiversity and pollution from industries are pressures on soil conditions.
State: There has been an increase in the adoption of no tillage and conservative tillage with a
simultaneous decline in the use of conventional tillage (Figure 6).
250000
200000
Area (acres)
150000
No Tillage
100000
Conservative Tillage
50000
Conventional Tillage
0
2006 2011
Census Year
Figure 6: Area of land under tillage in Grey-Bruce from 2006-2011.
2011 Census of Agriculture, Statistics Canada.
Impact: An increase in soil cover over time indicates improvement in environmental sustainability as
the soil is more protected from degradation (AAFC 2013). Given that more than half of Grey-Bruce’s
land is farmland (Statistics Canada 2011a) and the lack of heavy industries, soils in Grey-Bruce may
not have suffered from significant amounts of contamination. However, it is important to note that
damage to soils can negatively impact ecosystems directly through loss of biodiversity living within
27You can also read