CSIRO Contribution - Part 2 - (FRDC 2018-197) - CSIRO Research
←
→
Page content transcription
If your browser does not render page correctly, please read the page content below
Informing development of the 2020-2025 FRDC RD&E plan
                                  (FRDC 2018-197)

               CSIRO Contribution- Part 2
Qualitative Mathematical Models to Support Evaluation of
                  Alternative Futures
  Jeff Dambacher1, Alistair Hobday2, Fabio Boschetti3, Chris Moeseneder4, Linda Thomas2
                     1
                      CSIRO Data61, Hobart, Tasmania, 7000, Australia
           2
               CSIRO Oceans and Atmosphere, Hobart, Tasmania, 7000, Australia
                3
                  CSIRO Oceans and Atmosphere, Crawley, Western Australia
                   4
                     CSIRO Oceans and Atmosphere, Brisbane, Queensland

                                       May 2, 2020

                                                                                          1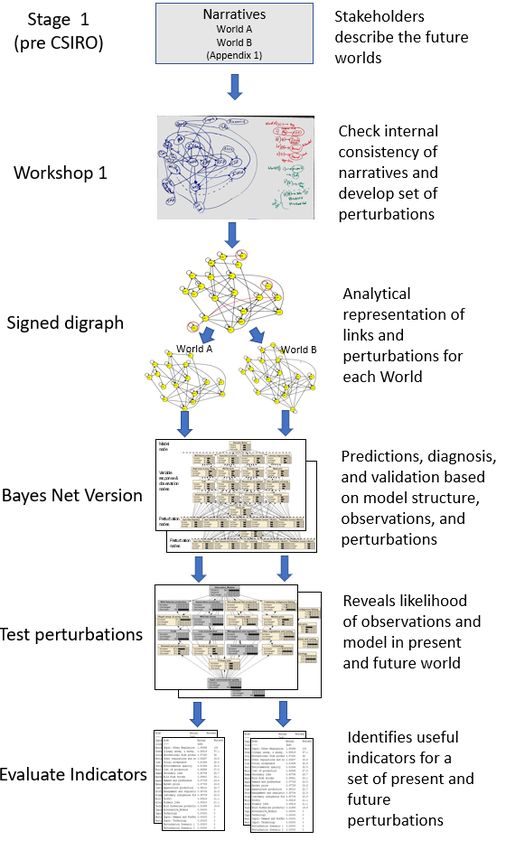
Contents
Summary ................................................................................................................................................. 3
Methods .................................................................................................................................................. 5
   Narratives and scenarios for Worlds A and B ..................................................................................... 5
   Model building and analysis ............................................................................................................... 5
Results ..................................................................................................................................................... 6
   Bayes Net Representation of Worlds A and B .................................................................................... 9
   Model Testing from Historic Perturbation Scenarios ......................................................................... 9
   Model Testing from Alternative Future Forecast Scenarios ............................................................. 12
Informative Indicators........................................................................................................................... 14
   Conclusion ......................................................................................................................................... 17
Appendix 1. Narratives underpinning alternative future scenarios developed into World A and World
B qualitative mathematical models ...................................................................................................... 18
   World A: Divided We Fall .................................................................................................................. 18
   World B: Wisdom of the Connected ................................................................................................. 24
Appendix 2. Agenda of expert elicitation workshop where World A and World B qualitative models
were developed .................................................................................................................................... 30
Appendix 3. Overview of qualitative models ........................................................................................ 31

                                                                                                                                                             2
Summary
This project contribution extends the use of the information that was assembled on two of
the possible futures. Our results show how the FRDC can test the effect of different
perturbations on elements of the seafood system, and to determine what indicators are
most useful as predictors of trajectories of change.
The purpose of this modelling exercise was to support FRDC 2018-197. This project was reviewing
FRDC research objectives through a process that developed alternative scenarios of possible futures
relevant to Australian fisheries. The development of these possible future scenarios was undertaken
in a process that ran in parallel to the CSIRO contribution. This process involved a series of
stakeholder workshops and follow-up discussions, to which CSIRO staff were occasional observers,
and is referred to hereafter as Stage 1.
Two of these scenarios were chosen in Stage 1 as a central focus for analysis, and the CSIRO team
then developed qualitative mathematical models to complement these scenarios. Our qualitative
models can account for past, present and potential future dynamics of Australian aquaculture and
wild-caught fisheries.
The qualitative models developed to describe present day dynamics were then tested to see if they
could account for previously observed shocks or perturbations the Australian aquaculture and
fisheries system. This involved a face-to-face workshop and teleconference with representatives of
the Stage 1 expert group.
Based on external input to management, employment and environmental variables, the qualitative
models produced a set of predictions that were highly consistent with previously observed
impacts in Australian fisheries and aquaculture.
The models were then tested to see how well they compared to the dynamics described in the
future scenarios, and here model predictions were found to be highly consistent with the dynamics
played out in the two future scenarios – that is, both worlds are likely.
The models were then analysed to identify informative indicators for a range of possible
perturbations to the system, with the intent that such indicators could be of use to inform
monitoring programs and management of fishery and aquaculture systems in Australia. These
indicators associated with some of the scenarios that were explored are:
• For an input to other regulations the two most informative indicators for World A were
illegal unreported and unregulated fishing and recreational fishery production, while for
World B wild fish stocks and other regulations were the top two indicators. For an input to
demand and preference both models had a cluster of top indicators that included wild
fisheries production, social acceptance and environmental quality. For an input to
technology, besides technology itself, there were no other indicators that were highly
informative.
These indicators should be the focus of efforts to determine which world is emerging and could be
used by FRDC to proactively understand the emergence of a future seafood world.
This project contribution extends the use of the information that was assembled in Stage 1 and
allows the FRDC to test the effect of different perturbations on elements of the seafood system, and
3to determine what indicators are most useful as predictors of trajectories of change. This level of
detail is not included in the draft FRDC 2020-25 strategy but can inform execution of the strategy.
With ongoing support from CSIRO, these models can now be used to explore alternative
perturbations, identify the informative indicators, and to determine when these models of the
future (World A and B) are no longer realistic representations of real situation. If insufficient
information is being gather on these indicators, the efforts could be made to collect such data, or if
the information is too expensive, the alternatives can also be investigated to determine how many
alternative indicators provide the equivalent conformation.
The flow of activity is summarised in the schematic below.
4Methods
Narratives and scenarios for Worlds A and B
Two scenarios were selected based on Stage 1 of the project for development into qualitative
mathematical models:
World A: Divided we fall—dominant motivation is fear, social influencers are polarising and divisive.
World B: Wisdom of the masses—government policy is integrated, environmental impacts are
known, measured and managed.
Detailed narratives that underpin these scenarios (Appendix 1) were interpreted by a group of
seafood experts in a workshop setting (Appendix 2). Model development proceeded by asking
participants to describe the current state and structure of Australian aquaculture and wild-caught
fisheries, such that the components and elements of the present-day system would likely contain or
could encompass those of the future World A and World B systems. Following construction of this
model, participants were asked to describe emergence of Worlds A and B from the present-day
system either as a change in graph structure or as a set of external drivers or inputs to the system
acting on specific model variables.
Following the model-building exercise, a subsequent workshop was convened by teleconference to
record observations from experts on the previous behaviour of the Australian aquaculture and wild-
caught fisheries system due to perturbations from economic and environmental sources. These
observations of the experts were recorded and later compared to qualitative model predictions as a
means of hind-cast model validation. Next a set of “observations” were recorded based on the
expected future behaviour of the system encoded within the narratives underpinning Worlds A and
B. These observations were then used as a means of forecast model validation.
Model building and analysis
Qualitative mathematical models, encoded as signed directed graphs, or signed digraphs were used
to describe the general dynamics of Australia’s aquaculture and wild-caught fisheries. Here
participants were asked to describe essential components, processes and factors associated with
aquaculture and fisheries production and consumption within Australia. These descriptions were
encoded into sign directed graphs, or signed digraphs (Box 1) which provide a qualitative depiction
of variable in a socio-economic or ecological system and the structure of the relationships by which
they are linked. Positive effects and processes that cause the increase of a variable (e.g., a rate of
reproduction or profit or a rate of addition) are depicted by a link ending in an arrow: ; negative
effects (e.g., a rate of mortality or degree of suppression or a rate of removal) are shown by links
ending in a filled circle: —.
Based on the structure of the signed digraph, one can assess if the model has the potential to be
stable after a pulse perturbation, such that it can return to equilibrium following a short-term shock
or disturbance to the system. The models can also be analysed to predict how the equilibrium levels
of the system variables will respond to a press perturbation, which is a sustained change to internal
or external conditions (Box 1).
5Results
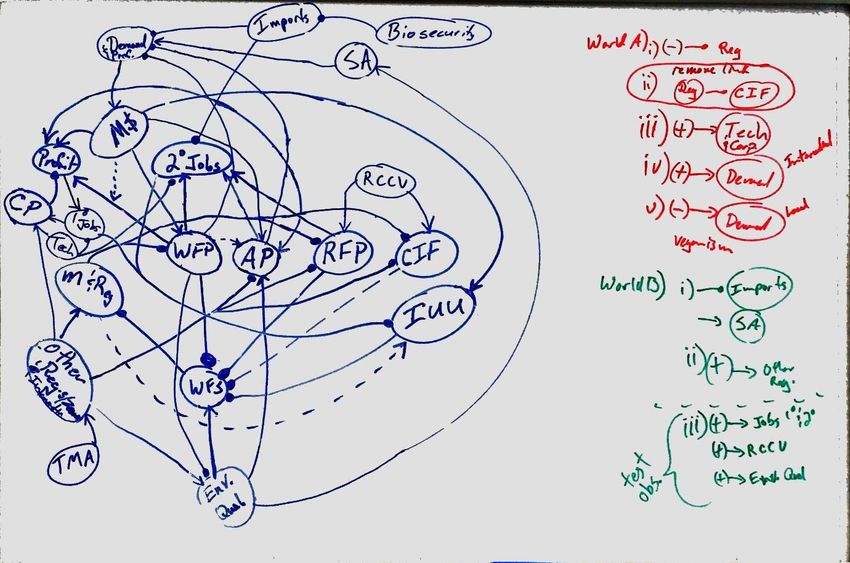
The expert elicitation workshop led to the development of a single signed digraph model that
described the components and process of the present-day Australian aquaculture and wild-caught
fisheries system (Figure 1). The workshop also developed a set of press perturbations that were
thought to underpin the development of Worlds A and B. This information was added to Figure 1,
and translated into the signed digraph shown in Figure 2.
Figure 1. Whiteboard image of signed digraph of present-day Australian aquaculture and wild-caught
fisheries. Perturbation scenarios underpinning development of Worlds A and B described set of
inputs denoted in red and green, respectively; model variable—1⁰ jobs: primary job, 2⁰ jobs:
secondary jobs (i.e., tourism), AP: Aquaculture production, CIF: customary (Indigenous) fisheries, CP:
cost of production, IFP: Indigenous fishing production, ITMA: international trade and market access,
IUU: illegal, unregulated and unreported fishing, M$: market price (domestic), M&Reg: management
and regulations (government agencies), Other regulations & interventions: non-agency policies and
procedures, RCCV: recreational, community and cultural values, RFP: recreational fisheries
(extractive and non-extractive), SA: social acceptance & norms, Tech: technology and
corporatization, TMA: trade and market access, WFP: wild fisheries production., WFS: wild fish
stocks.
6Figure 2. Signed digraph models of Australian wild caught fisheries and aquaculture systems
developed from the elicitation workshop (Figure 1). For the present-day system the red coloured link
from OR to CIF is absent, and the absence (presence) of this link is basis for World A (World B) model
in Figure 3, and red coloured circles denote variables that were omitted or aggregated into adjacent
variables to reduce model dimension; system variables: AP: aquaculture production, BS: biosecurity,
CIF: customary indigenous fisheries, CoP: cost of production, D&P: demand and preference, EQ:
environmental quality, Imp: imports, IUUF: illegal unreported unregulated fishing, M&R:
management and regulation, MP: market price, OR: other regulation and zoning, PJ: primary jobs,
Pro: profit, RCCV: recreational community cultural values, RFP: recreational fisheries production, SA:
social acceptance, SJ: secondary jobs, Tec: technology, TMA: trade and market access, WFP: wild fish
production, WFS: wild fish stocks.
In the model system of Figure 2 the demand and preference (D&P) for Australian fish products
control the market price (MP), and market price acts to increase profit (Pro), effort in wild fish
production (WFP), aquaculture production (AP) and illegal, unreported and unregulated fishing
(IUUF). Production from wild fish and aquaculture act to suppress demand and social acceptance
acts to increase preference. NB: to minimize model dimension demand and preference were
included as a single variable, where fisheries production suppresses demand, and preference, which
is sensitive to social acceptance, increases it. Biosecurity pressure acts to decrease imports and
imports act to suppress demand for domestic production and secondary jobs (SC). Secondary jobs
increase as a function of the levels of wild fish and aquaculture production and recreational fisheries
production (RFP). Social acceptance is shown to be driven by environmental quality (EQ), which is
negatively affected by levels of wild fish production and protected or increased by intensity of non-
7fishery agency regulations (i.e., OR: other regulation and zoning). Environmental quality acts to
increase levels of aquaculture production and stocks of wild fish (WFS). Other regulation and zoning
(OR) is increased by the levels of trade and market access, and also acts to suppress levels of
aquaculture production and recreational fishery production, and to increase the cost of production
(CP) and the intensity of fishery agency management and regulation (M&R). NB: the negative effect
of other regulation and zoning on customary Indigenous fisheries (CIF) shown in red Figure 2 is not a
feature of the present-day system, but is included in the future model of World B. Wild fish stocks
decrease as a function of the levels of wild fish production, recreational fisheries production,
customary Indigenous fisheries and illegal, unreported, and unregulated fishing. The level or
intensity of management and regulation of all fisheries (M&R) is a negative function of the
monitored levels of wild fish stocks (i.e., management agencies act to suppress catch when stocks
are low in abundance). The levels of recreational and customary Indigenous fishing is driven by
recreational community cultural values (RCCV). The adoption of technological advances (Tec) leads
to a decrease in primary and secondary jobs. Finally, the cost of production decreases profits and is
increased by number of primary jobs.
To reduce the dimension of the signed digraph model of Figure 2, three variables (TMA, RCCV, and
BS) were either omitted or aggregated into adjacent variables to create the models for World A and
Work B (Figure 3). The link from other regulation and zoning (OR) to customary Indigenous fisheries
(CIR) was added to the model for World B, as were two perturbation variables (P# WB) that were
used to represent a combination of multiple of perturbations underpinning the dynamics describe
for World B.
World A World B
Figure 3. Signed digraph models for present day system, and Worlds A and B derived from Figure 2;
system variables: AP: aquaculture production, BS: biosecurity, CIF: customary indigenous fisheries,
CoP: cost of production, D&P: demand and preference, EQ: environmental quality, Imp: imports,
IUUF: illegal unreported unregulated fishing, M&R: management and regulation, MP: market price,
OR: other regulation and zoning, P# W B: World B perturbations 1 and 2, PJ: primary jobs, Pro: profit,
RCCV: recreational community cultural values, RFP: recreational fisheries production, SA: social
8acceptance, SJ: secondary jobs, Tec: technology, TMA: trade and market access, WFP: wild fish
production, WFS: wild fish stocks.
Bayes Net Representation of Worlds A and B
The signed digraph models for Worlds A and B were incorporated into a Bayes net representation
(Box 3) containing an alternative model node that includes models for World A, World B and a null
model (Figure 4). Seventeen nodes are included in the Bayes net to represent responses or
observations for the signed digraph variables, and five perturbation nodes provide the means to
control press perturbation inputs for single variables or combinations of variables.
Model
node
Variable
response &
observation
nodes
Perturbation
nodes
Figure 4. Bayes net structure for representing signed digraph models of Figure 3.
Model Testing from Historic Perturbation Scenarios
A test of the signed digraph model to account for past perturbations to the Australian aquaculture
and wild-caught fisheries system was made by creating perturbation scenarios where there was a
spilling or decrease of primary jobs couple with an increase in the intensity of other regulations and
zoning—i.e., economic rationalization of the Australian fisheries sector (Figure 5). These inputs were
applied only to Model A, which represent the present-day system, and to the null model. Thus, this
is a hind-cast test of Model A against the null model for relative consistency of model predictions
against historic observations, as given by the experts in the elicitation process. Historic observations
were entered for a decrease in wild fish production and profit and primary jobs, and an increase in
cost of production, management and regulation, and other regulation and zoning.
The Bayes net results indicate that model for World A had a likelihood of 83% against the null model
(with model for World B excluded from the comparison).
9Figure 5. World A model test from historic press perturbation scenario where there was a loss of
primary jobs and an increase in the intensity of other regulation and zoning.
An additional test of the model for World A was made in Bayes net that included a single
perturbation node to assess an input due to a decrease in environmental quality (Figure 6). NB: the
Bayes net in Figure 6 was needed only for this historic comparison, as this mode of input was not
included in other scenarios, thus keeping the number of input nodes in the other Bayes nets to a
workable minimum of 5 nodes. Observations were entered for decrease in wild fisheries and
aquaculture production, wild fish stocks, profit and environmental quality, and an increase in cost of
production and management and regulation.
The results indicate a likelihood of 96% for World A model against the null model.
10Figure 6. World A model test from historic press perturbation scenario where there was a decrease
in environmental quality.
We combined the results of the two perturbation scenarios through the use of Bayesian priors,
whereby the likelihood obtained from the second test (input to environmental quality) was applied
as a prior to the World A model.
Here a combined likelihood of 99% was obtained for the World A model against the null model
(Figure 7).
11Figure 7. World A model test for two separate historic press perturbation scenarios of Figures 5 and
6, where likelihood for World A model from Figure 6 was used as prior in perturbation scenario
presented in Figure 5.
Model Testing from Alternative Future Forecast Scenarios
To evaluate the consistency of the signed digraph models for Worlds A and B with the two possible
futures, we tested them against a set of “observations” derived the written narrative underpinning
the two future scenarios (Appendix 1).
From the workshop elicitation (Figure 1) World A, i.e., Divided we fall, was described as evolving
from the present-day state of the system through a set of external perturbations that included a
decrease in other regulations and zoning and an increase in demand and preference and adoption of
technology (Figure 8). Observations derived from the narrative underpinning World A (Appendix 1)
included a decrease in recreational fish production, wild fish stocks, secondary jobs, cost of
production, demand and preference, social acceptance, environmental quality and primary jobs, and
an increase in customary Indigenous fishing, illegal, unreported and unregulated fishing, market
price, profit and adoption of technology. In this test the World A model had a likelihood of 97%
(Figure 8).
12Figure 8. World A model test from forecasted press perturbation scenario.
From the workshop elicitation (Figure 1) World B, i.e., Wisdom of the masses, was described as
evolving from the present-day system by the inclusion of an additional link from other regulation to
customary Indigenous fishing (Figures 2 and 3) and an increase in other regulation and zoning,
adoption of technology, demand and preference, social acceptance secondary jobs, environmental
quality, primary jobs, recreational fisheries and customary Indigenous fisheries. Observations
derived from the narrative underpinning World B (Appendix 1) included an increase in wild fish,
aquaculture, recreational and customary and indigenous fishing, wild fish stocks, secondary jobs,
market price, profit, management and regulation, demand and profit, social acceptance,
environmental quality and adoption of technology, and a decrease in illegal unreported and
unregulated fishing. This test returned a likelihood of 99.8% for World B model against the null
model.
13Figure 9. World B model test from forecasted press perturbation scenario.
Informative Indicators
Informative indicators for Worlds A and B models were identified based on a series of analyses
based on inputs to other regulations, demand and preference and adoption of technology (Table 1).
For an input to other regulations the two most informative indicators for World A were illegal
unreported and unregulated fishing and recreational fishery production, while for World B wild fish
stocks and other regulations were the top two indicators. For an input to demand and preference
both models had a cluster of top indicators that included wild fisheries production, social acceptance
and environmental quality. For an input to technology, besides technology itself, there were no
other indicators that were highly informative.
These indicators should be the focus of efforts to determine which (if either) World is emerging and
could be used by FRDC to proactively understand the emergence of a future seafood world.
14Table 1. Informative indicators for three input perturbations for World A and World B models.
Input to Other Regulations
World A World B .
Input to Demand and Preference
World A World B .
15Input to Technology
World A World B .
. .
16Conclusion
The workflow (Figure 10) explains how the narratives developed by the FRDC stakeholder groups can
be converted into predictive and informative decision-support tools. This level of detail is not
included in the draft FRDC 2020-25 strategy, but can inform execution of the strategy.
With ongoing support from CSIRO, these models can now be used to explore alternative
perturbations, identify the informative indicators, and to determine when these models of the
future (World A and B) are no longer realistic representations of real situation.
If insufficient information is being gather on these indicators, the efforts could be made to collect
such data, or if the information is too expensive, the alternatives can also be investigated to
determine how many alternative indicators provide the equivalent conformation.
Figure 10. Project workflow, indicating the stages and outcomes of each stage, described in the main
body of the report.
17Appendix 1. Narratives underpinning alternative future scenarios
developed into World A and World B qualitative mathematical models
These narratives were developed in Stage 1 of the project and supplied to the CSIRO team. They
are included here to show the information base used to construct the qualitative models.
World A: Divided We Fall
Dominant motivation is fear, Influencers are polarising and divisive
The year is 2030. People are afraid. Of the unknown, and each other. In times of fear people look
for someone to guide and protect them. Leaders. Influencers. But influencers understand the
power of fear and harness this base human motivator, through polarising and divisive behaviour,
in effort to preserve their power.
Looking back, you can see how it started. What caused it. All the fear. Decades of the corrosive
impact of big industry, driven by a need to deliver profit for their shareholders, enabled by blind
confidence and corrupted power took its toll on fragile ancient landscapes. Growing extremes of
temperature… Destructive climate violence ripping across the globe, to which Australia has not been
immune… As rising oceans slowly began devouring the land. Despite these obvious signs of
environmental distress, leaders and influencers continue to provide information and arguments
justifying polar opposites in terms of cause, leading to no action.
Climate slowly became the major dictating force in terms of primary industries to 2030, with far
reaching impacts on how many Australians lead their day-to-day lives. Australia continues to
experience storms, floods, fire and drought with increasing frequency. These environmental events
increasingly displaced and harmed Australians during the ‘20’s. Eventually insurers began to refuse
to insure coastal properties. Given the enormous proportion of Australia’s population that live on
the coast this fuelled tremendous uncertainty in the housing market, sparking the recession in the
early 20’s.
Arguments over whether humans and human impacts were the cause of the changing climate raged
on. This argument, whether intended or not, reduced the chances of action being taken and things
changing. Regardless of what caused it, the swelling caravan of climate refugees at our northern
shores eventually made it impossible for Australian politicians to continue to sell climate change as
someone else’s problem. Natural resources progressively became scarce and highly contested during
the 20’s. Contested among those seeking to harvest and produce them, and increasingly from the
hungry mouths fighting to consume them as we continue to be told on one hand we are in the midst
of a food security crisis and the next that we do not.
Sensing opportunity, political influencers began using the climate refugee situation to their
advantage. Championing an ‘Australia First’ rhetoric, which was underpinned by a view that Australia
must conserve its resources for Australians, and not deplete them by sharing with the growing
displaced population. Establishing a narrative in which ‘we’ needed to save ourselves from ‘them’,
they sought to depict the refugees fleeing their sinking homelands as somehow deserving of this
outcome. Somehow less than equals.
18The power of confusion
Despite a Labour government forming a majority government (just) in 2022, extreme right wing and
deep green fringe parties are the major beneficiaries from the current environment, largely using
digital platforms as their megaphone and character assassination tactics over sound policy. The
surgical targeting of different groups, and granular monitoring of results enabled through social
media was better than a better mousetrap. It was now perfect. Governments were impotent in
attempting to control the influence of these tech giants, who are only interested in their balance
sheets. The result has been an unabated digital tidal wave of lies, hate and division.
Sensing the growing ineffectiveness of centrist, evidence-based politics the larger parties have also
taken to the new supercharged form of personality politics. Use of covert footage to capture
opponents in compromising situations has become commonplace, however increasing use of deep-
fake technology, including through regular state-sanctioned cyber interference from growing
international economic superpowers means that voters don’t know if what they are seeing, and/or
their political leaders are saying is real any more. The only successful people in politics are those that
can align themselves with a populist influencer, and in general this needs to be done secretively and
by manipulation; the public don’t know of the alliance, they just hear the message from their
favourite sports celebrity or reality tv star.
There have been very, very few examples of major policy being enacted during recent times. Since
the Emissions Trading Scheme was enacted in 2023 after Labour came into power in the 2022
election there has been very few further developments of policy on climate change. Even the ETS is
not fit for purpose and is not achieving what it set out to do, being constantly fiddled with in efforts
to appease the big end of town.
The extensive knowledge of ‘ancient time’ that exists in coastal Indigenous communities remains an
untapped and valuable resource that has the potential to be highly beneficial in natural resource
management but Western interactions and approaches to mapping, researching, dividing and
allocating resources remains challenging. The Australian public voted against Constitutional
recognition of Indigenous people in 2022 in fear of what this might mean. Despite this, and perhaps
as a ‘runner-up prize’, Indigenous communities were allocated fishing rights for a number of inshore
fisheries in 2025. This was a knee-jerk decision by the Australian Government, made in response to
growing public discontent over commercial and recreational fishing practices, which were the focus
of devastating campaigns during the early 20’s by powerful and extreme Environmental Non-
Government Organisations (ENGOs). Initially, the recreational fishing sector thought they would be
spared in the campaigns… Perhaps even benefit, having built what they thought to be an alliance
with some of the extreme green groups during 2010-2019 as they worked in lockstep to eject
commercial fishers from fisheries such as Westernport Bay in Victoria, to stop the Supertrawler, and
to enact the still apparent moratorium on Atlantic Salmon farming in Tasmania. However, this was
all part of a strategy by deep green groups who saw no place for fishing of any type in Australia. It
was actually much easier to shift public sentiment against recreational fishing when the time came…
The rec fishers had no data to demonstrate the minimum impact on the environment of substantial
social benefits they claimed to have, and the live baiting practice was a near guaranteed trump card
to whatever recreational fishers, managers or scientists had, it tugged at heart strings. And with
nearly 90% of Australians now living in major cities, very few people bother to battle traffic for the
hours required to get to a fishing location that is not ruined by habitat loss and contamination
anyway.
19When the anti-fishing campaigns began to wash over the Australian public, representatives of the
recreational fishing sector immediately saw the error in their single-minded pursuit of an estimate of
their economic importance during 2019-20. In a world where the everyday Australian was sick of
money ruling everything, nobody cared what your economic contribution was. The Indigenous
fishing community was the only sector whose ‘brand’ was not perceived as entirely focussed on self-
interest and greed. The political response was easy, and the re-allocation was swift.
The re-allocation resulted in significant clashes between recreational, commercial and indigenous
fishers throughout 2026, catalysing accusations by the growing white nationalist movement that
indigenous communities were trying to exclude non-indigenous people from enormous swathes of
coastline in order to limit availability to affordable and healthy food and recreational pursuits. This
has been a trigger point since the seafood shortage in 2022 that was caused by a novel virus causing
mortality events in wild fisheries and aquaculture farms alike, but more importantly significantly
impacting export of seafood products with widespread bans on Australian products. The
undescribed virus is thought to have been introduced to impact and kill carp. It is hypothesised that
this move was in response to some groups dissatisfaction that the Federal Government rejected the
National Carp Control Plan in 2019/20 and refused to revisit the idea of controlling carp. The
rejection was on the back of strong campaigns by international academics together with ENGOs and
capitalised on genuine angst from sections of the Australia’s rural communities (these people were
used in the same way that recreational fishers were).
These events fed the unprecedented adoption of cell-based seafood protein during 2024 & 2025 and
meant that unfortunately the allocation of fishing rights to Indigenous communities was not a
success, even for those who were beneficiaries of the decision. The re-allocation decision was made
in haste and without consultation by the Labour party as an election commitment in 2025 and was
not accompanied by sufficient follow up policy and legislation by the States to allow for the
establishment of functional business structures or governance. Similar political decisions have seen
allocation of areas from the commercial fishing sector to recreational fishers, commercial and
recreational fishers to marine parks and vice versa. Most instances are not achieving the optimal
outcome for the management of the resource, or optimised outcomes from an economic, social or
environmental perspective, but do continue to drive a wedge between the different user groups of
aquatic resources, and pit them as the bad guys in terms of the left leaning urban population of
Australia.
Currency is still king, and the beast is getting bigger. Giant mining conglomerations and intensive
agriculture firms are winning access to huge swathes of land and sea. Whilst around these affluent
empires, everything else is collapsing. Forgotten by the systems, more people are living on the knife
edge of subsistence. The living wage decimated with the collapse of global economies – work/life
balance has become non-existent.
The political system does not implement the will of the people anymore. Many question if it ever
really did. This is largely due to large-scale changes in global trade in the form of binding Free Trade
Agreements that were implemented in 2023, enabling international corporations to take nations to
court for loss of income if their aspirations for growth and trade are impeded.
Indigenous people challenged the Australian government over the tragic predicted pollution of the
ground water with a successful land right claim in 2023. This resulted in a surprising out of court
settlement between Indigenous groups and the Australian government, involving the purchase of
quota from high value fisheries on their behalf.
20From then Indigenous people continued to focus on the future of Sea Country, equity for all that
interact and the ongoing use for future generations. This resulted in dramatic changes to affluence,
but emergence of a spiritual crisis as many people were no longer living on Country, having traded it
away, forcing closure of traditional homelands, loss of cultural practice and identity, making people
unwell. ‘Another stolen generation’. Whilst efforts to ‘close the gap’ were successful from an
economic perspective, the mental health and wellbeing chasm is widening.
The Australian Bureau of Statistics report steadily increasing concern among Australians for their
future, driven in a large regard by the ever-increasing cost of living, and growing insecurity of
employment. A survey in 2025 revealed that 7 in 10 Australians reporting they are now under-
employed, in no small part driven by the sweeping adoption of automation that occurred across
various industries in the early 20’s. This technological revolution was enabled via investment from
the ten multi-trillionaires who now own 70% of Australia’s corporations and share 99% of the
national earnings. Completely reliant on the political donations provided by the ten trillionaires, no
competitive party is willing to advance bold policy reform to effectively mitigate climate change.
Even if they did, it would never win sufficient support from the community, who are struggling under
present *known* conditions to make ends meet, and continue to be swayed by the fearmongering
campaigning of the Australian Coal Party
Under-privileged people have started going off the grid out of necessity. Unable to compete in the
high cost, low employment world. Living in shanty cities and attempting to live off the land in places,
these forgotten communities do what they can to survive. This shift out of society brings with it
exacerbated ecological problems, without infrastructure and means to process waste and emissions.
However, there is also a glowing ember of humanity, as people start re-connecting in order to
survive. Bartering products. Protecting each other. Recreational fishing – once a pastime, is now a
means for securing food.
Speed of innovation has increased dramatically, particularly over the last 6 yrs. however this has
been of little benefit for most, feeding a growing expectation of perfection and consistency of supply
which has squeezed out the smaller operators, and resulted in significant amalgamation across a
variety of industries.
The way we consume information, and the style of information we crave, is different now. The
eventual death of free-to-air TV in 2024 was a result of the fact that people increasingly sought
personalised content, and the internet was ready to pounce. The few remaining online independent
news outlets report a growing homelessness epidemic, with 12% of Australia’s public now without
steady accommodation. This growing trend can be attributed to sweeping foreclosures that were
implemented under a package of strict austerity measures imposed on the Australian government in
response to accepting a bail out from an emerging international economic superpower after the
Australian Financial Crisis in 2022. The major news networks refuse to cover the continuing decline
in living standards after the outbreak of civil unrest in Sydney’s Western Suburbs in 2025, which was
sparked by de-staffing of the 20th large manufacturing facility in West Penrith in three years. This
may be out of a desire to reduce societal friction but is more likely a measure by the trillionaire
media mogul to ensure ongoing compliance and preserve the conditions, from which he and his
(largely male) trillionaire compatriots derive great benefit.
Society is changing, and this is caused by a variety of factors. People venture out less. This is in part
because of continuing poor lifestyle balance as those who still work feel compelled to do so longer in
effort to demonstrate their indispensability, but also in response to the growing crime rates, high
21costs of entertainment, unpredictable weather and significant travel time. Also, the incentives to go
out just aren’t there anymore. The digital revolution that swept through just before the 2022
financial crisis has meant that most of the work that remains can be done from home (spurred on
thanks to technology to ensure optimal productivity). All the ingredients required to 3Dprint each
week’s meals are delivered. Finding a partner is done most efficiently online… That’s for those who
bother with a human partner. The divorce rate topped 62% back in 2027, a sure sign of our
increasingly solitary existence. The AI giant ‘solone’ took advantage of this trend, launching their
hugely successful new range of ‘techno-friends’ in 2026 with sweeping adoption of their products
that were reported to be “the perfect antidote for those fearful of being hurt, scammed, or let down
by flesh-and-blood “loved ones”
There are some changes such as the larger scale roll out of electric cars my most manufacturers.
Unfortunately to date there has been little in the way of significant policy or Government
investment/leadership on activities such as these. While the level of private investment is good, the
free market is only working on the already converted and changing behaviour more broadly proves
more difficult. Especially in an age where community values are driven largely by fear and the
polarizing landscape of social influencers.
Water security continued to be an enormous issue until the mid-20’s, when the great desert drought
presented catastrophic security risk for South Australia, the Northern Territory and Perth, and
resulted in implementation and activation of a network of desalination plants able to meet 80% of
Australia’s consumptive needs. This had an unexpected positive outcome for the health of Australian
rivers (once the drought broke), as the reduced reliance on natural flows enabled a significant re-
allocation to the environment. The significant demands for compensation by water holders – at a
time that coincided with the Australian Financial Crisis – resulted in an unprecedented revocation of
rights without compensation. This resulted in significant friction between urban and rural
communities, leading to the second significant case of civil unrest in 2025 (within a month of the
Western Sydney fighting that took place).
The huge transition to desalinated water has presented a new problem: how to dispose of the three
million metric tonnes of salt generated each year. But also, a new opportunity: the Australian
Government found a way to turn the waste product into an asset, burying the alt deep underground,
and using it as a giant battery to store energy generated by renewables. Scientists also identified an
opportunity for salt waste to be diluted into rising sea levels which are largely a result of melting
freshwater polar icecaps.
Consumer behaviours is largely broken into three categories: those who form their eating habits
around what they believe to be ‘sustainable’, those who fetishize food, treating it as an escape, and
those who have largely abandoned eating altogether in favour of increased productivity, via the new
pill-based diet that delivers all nutritional needs in three daily pills.
Dogmatic pursuit of ecological sustainability by powerful ENGOs has contributed to dangerous levels
of global poverty. The Industry is divided, deeply divested. Among the sustainability-focussed
consumers there is distinct fragmentation within food trends, with almost equal percentages of
people identifying as various groups: vegans, vegetarians, pescatarians, traditional etc. Nearly all
food outlets (especially ones tailoring to niche diets) are owned and faced by celebrities and
influencers in the community (apparently deriving a nice tan from a Bali holiday with 20 of your best
friends which derived 2.5bn likes from 16 posts paid for by Uber makes you an expert on gut health).
The food trend continues to state the idea of sustainability, however in many cases this is mostly
22based on values and less on science or data. Bespoke products are very trendy still but are often
interlaced with lab-produced and 3D printed food stuffs presented in a single dish.
The largest food trend of the last decade has without a doubt been the rise and plateau of ‘meatless
meat’, with both the rise and plateau being equally dramatic. Meatless meat began to make its way
in to mainstream food supply chain around 2019, enabled by the growing population of people
concerned about sustainability and animal welfare. It quickly took off, penetrating the supermarkets,
fast food chains and even making it on to middle class restaurant menus. As quickly as it rose and
was touted as the saviour of all environmental sustainability issues caused in food production. This
however, quickly plateaued as a number of influencers in the food world discussed the impact that
single plant production industries can have. There remains a strong consumer base for meatless
products, but the expansion has somewhat abated.
Among the feed-fetishizes sustainability is not a bad word: it’s meaningless. Over the last ten years
the word has been often used as a catch-all term to deal with environmental impacts, and social
benefits and impacts, with varying degrees of accuracy. Unable to discern truth from market spin
without significant investment of time, this group has written off the concept of sustainable
purchasing entirely. However, the advent of in-home 3D food printing in 2024 had an unexpected
conservation outcome. The ability to produce the tastiest meal of any desired combination of
flavours from a mixture of synthetic ingredients and protein filler has seen consumption of red meat
and seafood go down by 66%, and the significant rationalisation of the food industry that resulted
has also had a good impact on reducing waste associated with food packaging. Advent of the pill-
based diet also delivered improved sustainability outcomes by those who subscribed to it.
For Australian primary products there is still a strong wave of high profits for products exported to
wealthy Asian countries. These products include red meat, horticultural products like cherries,
blueberries and some apples, wine and seafood.
The digital revolution that swept through just before the 2022 financial crisis has meant that most of
the work that remains can be done from home (spurred on thanks to technology to ensure optimal
productivity). Many led us to believe that failure to utilise technology would see the nation fail, the
government followed this with significant injection into research, development and innovation
specifically targeted at avoiding being the “analogue country in a digital world” (Scott Morrison
speech to accompany the $500m technology innovation fund announcement, 10 October 2020,
coined from an online post made by Henry Jacobson a technological influencer hailing from Sydney’s
northern beaches and has 300M twitter followers). This has meant that those who work are able to
conduct this remotely. This has seen a resurgence in the regional populations of Australia. Some 30%
of the population now lives in regional areas, a huge swing from 10% in 2020. Unfortunately, due to
the way in which the community sources food and resources (all the ingredients required to 3Dprint
each week’s meals are delivered by drone to anywhere within 1000km of a major centre) there is
little to no benefit to regional communities as a whole. People are too scared to source food locally
for fear it will be unsustainable.
And the demand for nutraceuticals has exploded, both as a supplement targeting 3Dfoodprint and
pill-based diet consumers, and to help offset poor lifestyle of the food-fetishized community. This
has been the largest area of growth in the seafood industry in the last decade.
The major fisheries are owned wholly by individual corporations. They utilise very few boats and
other capital but maximise the use of technology and automation, meaning that the cost of
production is much reduced. This allows them to produce to market. Products that received $50 -
23$100 per kilo ten years ago are now fetching between $1,000 and $5,000 per kilo. Post the economic
downturn in the mid-20s exports reduced significantly. Seafood and some other specialist proteins
(Wagyu beef, aged meats etc) have fared extremely well from the extreme high-end restaurant
scene that has blossomed in the late 20’s in response to the opportunity to source high end products
from primary production in Australia. This high-end experience comes at a cost of between $3,000
and $10,000 per head. Obviously only the extremely wealthy can access this kind of experience.
World B: Wisdom of the Connected
Government policy is integrated, environmental impacts are known, measured and managed
The recession that transformed Australia’s political, economic and social system
Dysfunction, inequity and disharmony reached a tipping-point during the Mother-Of-All-Recessions
which shook the foundations of Australia in 2020 – 2022. Economic commentators reported it to be
the most significant economic perturbation in Australia’s history since the Great Depression. Fuelled
by the trade wars of 2019, this event was unlike the Global Financial Crisis, in that Australia was not
immune this time. Without a buoyant mining sector to shield the economic body-blows, there were
dramatic job losses particularly across manufacturing, retail and agribusiness sectors.
Unemployment reached 15%, and home foreclosures exceeded 12%, hitting hardest in rural and
regional areas, and leading to a strong property market decline. Ineffectiveness of government
policy to stave off the spiralling crisis, beyond a series of measures serving mainly to prop up large
corporations considered ‘too big to fail’ and the banking sector ensured that those worst affected
were people occupying lower socio-economic strata.
Government implemented an aggressive stimulus package in 2023 in attempt to quell unrest,
restore confidence and spark industry recovery. Certain industries were prioritised for
reinvigoration, including Australia’s agriculture system. This was in part due to the food security risks
revealed as a result of our historical reliance on imports during the 2019 trade wars. Coupled with
substantial changes to fiscal policy, these measures slowly, steadily began to take effect. The
stimulus package resulted in a lot of money flowing into the agriculture system, and aquaculture
sector in particular, as capital from the impact investment and superannuation sectors started
looking for ‘safer bets’, and areas that would deliver a good outcome. Over time this catalysed
Australia’s rebound and setting it on a trajectory to thrive.
The dynamics of this period catalysed a range of significant changes throughout Australia’s political,
societal and economic landscape. Much of the outrage associated with the Recession was directed
at the systemically short-sighted, populist politics fuelled largely by corporate self-interest, and
consequent poor outcomes for Australian society in 2022 that led to that event. The sentiment of
the time was best captured by the headline banner of the leading fact sharing site of the time (“The
Whole Truth”), which read “The system is broken, the people have spoken”. The collective holding of
political leader’s “feet to the fire”, coupled with the growing trend of economic activism as the
community developed a deeper sense of their own power, sparked significant and unavoidable
reform across the parliamentary process in an effort to address the significant dysfunction in
decision-making. Key areas of reform included changes to the party process more aligning to
Scandinavian systems. The result was a significant improvement in the functionality of the political
process during 2022-2025, and quality of decision-making. In 2030 the political discourse now is
largely evidence-based, respectful and progressive, wherein evidence is presented and evaluated,
24solutions are identified and debated, bills are drafted, and debated, and voted upon based on the
facts.
This new area of respectful discourse and the associated redefinition of Australia’s culture and
character was a key factor in Australia returning to explore the process of becoming a republic. This
promoted an era of reflection. Taking stock of our national culture, sociological and ecological
condition after the mother-of-all-recessions, and looking around the world for inspiration, this
period would be marked in history as a key stage in the evolution of Australia’s awareness. A stage
of enlightenment. But it was not without challenges.
Climate change, population growth and the revenge of ecological systems
Australia’s human population began concentrating increasingly into urban population centres. This
concentrated anthropogenic impacts to urban areas. The high urbanisation of Australian
communities would have resulted in continued dislocation of Australians from their food source,
were it not for the introduction of a mandatory process wherein all Australian schools, students
were required to being exposed for two weeks per annum, to the primary production sector to
understand the origin of food, and build empathy with those who produce it.
Continued massive global population growth, coupled with strongly episodic climate change events
throughout the South Pacific and South-East Asia over the past 5 years, awakened forced migration
in 2026. This has placed environmentalism and social responsibility mainstream. With 20 million
climate refugees now knocking on the door of northern Australia, the Australian Government could
no longer pretend this was someone else’s problem. The urgency felt by growing risk of ecological
crisis, coupled with the very real economic crisis of 2020-2022 fresh in the minds of the public,
spawned national recognition of a need to change, matching the raising global consciousness of the
time. Enabled by the improved decision-making at a political level, this paved the way for bilateral
drafting of an ambitious bill called ‘understanding costs and distributing benefits bill’, passed in
February of 2026. The bill sought to address growing social inequality and ensure holistic accounting
in the delivery of products and services.
Central to the reform was implementation of a progressive taxation system to improve accessibility
to key services (education, healthcare, housing) strengthening the safety net for Australia’s most
vulnerable, whilst still rewarding and incentivising effort and achievement. Overall people paid more
taxes, but the system worked. The collection and reporting of verifiable data on the impact of this
economic reform clearly demonstrated its effectiveness, improving the harmonious nature of
society, enabling a greater sense of shared understanding, common purpose, and ability to recognise
and respond to issues as a society.
The media taking a healing role in society
Traditional media had taken its last loops of its death spiral in 2023. The broad reform in media laws
in 2022 was largely ineffective, lagging behind market, whose changes were driven by an era of
‘information enlightenment’. An unquenchable demand for verifiable facts, rich education, and
balanced reportage. This, coupled by widespread disaggregation of media and the fierce competition
in this digital sector that ensued, resulted in a dramatic change in tone from the historically
polarising, sensationalist narrative of media. Over time this had a key role in healing societal
cohesiveness, as demonstrated in the annual National Holistic Accounting Framework which reports
trends in societal trust and wellbeing (among other variables) that was implemented in 2023.
Evidence-based and holistic decision-making in government
25With the political system operating as it should (acting on behalf of the people, on the basis of
evidence) governments at federal and state levels were liberated to deliver their function more
effectively: to undertake analysis and advise ministers on optimal approaches, and development of
policy on how best to achieve desired outcomes. No longer were political advisors seeking to
enforce an outcome upon the highly trained and well experienced public servants that operated
their departments. A fundamental shift occurred wherein decision-making at a political level, and
policy developed by government was on the basis of robust, verifiable evidence. Adaptive
management, Triple bottom line and ecosystem-based management are no longer trinkets or
mirages on the horizon. They are business as usual, enforcing a level of systems thinking, integration,
and active and evidence-based adjustment of policy settings never seen before.
In parallel with the increasingly evidence-based government function, was a natural evolution
towards a higher level of structural integration across government policy and structures in Australia.
This was borne out of a clear recognition that complex interconnected systems (whether societal or
ecological) do not lend themselves to a reductionist form of management into disconnected silos.
The growing climate crisis reinforced on a daily basis that we cannot consider our food production
systems (or any other) in isolation from the underpinning environment. This resulted in the
establishment of the ‘Environment & Humanity” (E&H) Mega-Department and radical re-
prioritisation, with this portfolio now considered the most important under Treasury. All
government departments which rely upon ‘leasing’ of environmental resources to produce food,
fibre, wood and other valuable commodities - including fisheries - were then subsumed into the E&H
Department, with a simultaneous re-ordering of policy so that all uses of ecological systems were
considered secondary to their health, connectivity and functionality.
The power of information and data
Robust, audited systems were put in place to measure and report on a broad suite of metrics under
the National Holistic Accounting Framework. The framework covered accounting all aspects of
Australia’s natural environment and the impacts of human intervention on it. This included the
standard economic variables, but also social wellbeing aspects (under-employment, satisfaction,
trust, cohesion), and a range of environmental variables (soil salt levels, soil carbon, water quality,
temperature, sea-level, contaminants and their cumulative impacts). The data now being received
has dramatically affected decision-making in many of the food and agribusiness sectors.
For example, fish numbers are now tracked for various life-stages. Monitoring has also extended
beyond target species to also include other ecosystem elements not historically monitored due to
lack of economic value. Monitoring has also been expanded spatially to include areas outside of
those traditionally monitored, which historically only focussed on places of high conservation value
and/or where development is planned. These diverse data streams are not only being collected, but
more importantly, shared and used. A variety of digital tools and platforms have come to life that
everyone can play on. This has resulted in a breaking down of the data ‘fiefdoms’ that emerged
among scientific institutions in the early 2000’s. The Science sector has been comprehensively
disrupted. But far from spelling the demise of science as an institution: it spawned its re-birth, as
data and scientific publications became open source, paving the way for us to begin to understand
our world in previously unimaginable ways.
Interestingly, the open-source nature of data and information sharing has meant that the cost of this
heavily data-driven system is not dramatically more than in prior decades. It turns out that a lot of
the information required to ensure that key aspects are known, measured and managed was already
being collected in the past, just not shared.
26You can also read