5.3 DAM & LEVEE FAILURE - New Jersey Office of Emergency Management
←
→
Page content transcription
If your browser does not render page correctly, please read the page content below
DAM & LEVEE
          5.3
                FAILURE
5.3 - 1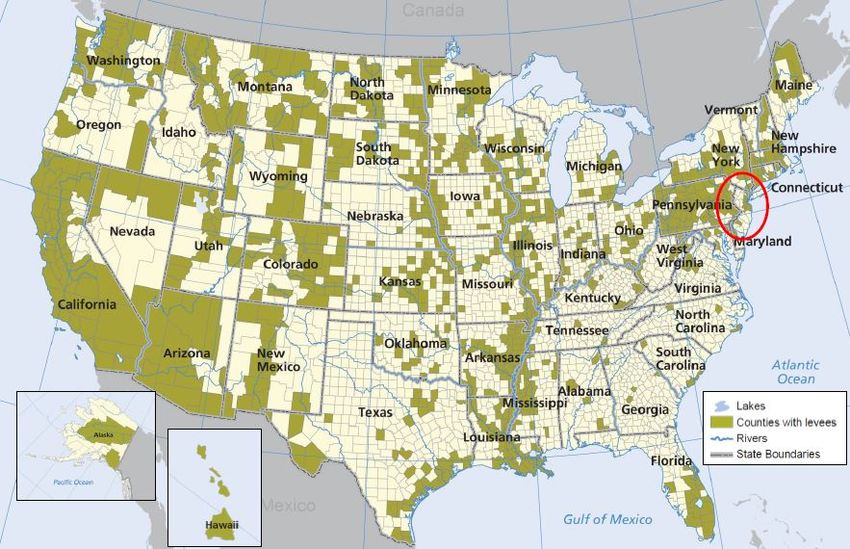
SECTION 5.3 DAM AND LEVEE FAILURE
5.3.1 HAZARD DESCRIPTION
DAM FAILURE
A dam is an artificial barrier that has the ability to store water, wastewater, or liquid-borne materials for
many reasons (flood control, human water supply, irrigation, livestock water supply, energy generation,
containment of mine tailings, recreation, or pollution control. Many dams fulfill a combination of the
stated functions (Association of State Dam Safety Officials 2013). They are an important resource in the
United States.
Man-made dams can be classified according to the type of construction material used, the methods
used in construction, the slope or cross-section of the dam, the way the dam resists the forces of the
water pressure behind it, the means used for controlling seepage, and, occasionally, according to the
purpose of the dam. The materials used for construction of dams include earth, rock, tailings from
mining or milling, concrete, masonry, steel, timber, miscellaneous materials (plastic or rubber), and any
combination of these materials (Association of State Dam Safety Officials 2013).
Dam failures typically occur when spillway capacity is inadequate and excess flow overtops the dam, or
when internal erosion (piping) through the dam or foundation occurs. Complete failure occurs if internal
erosion or overtopping results in a complete structural breach, releasing a high-velocity wall of debris-
filled waters that rush downstream damaging and/or destroying anything in its path (FEMA 1996).
More than a third of the country’s dams are 50 or more years old. Approximately 14,000 of those dams
pose a significant hazard to life and property if failure occurs. There are also about 2,000 unsafe dams in
the United States, located in almost every state.
Dam failures can result from one or a combination of the following reasons:
Overtopping caused by floods that exceed the capacity of the dam
Deliberate acts of sabotage
Structural failure of materials used in dam construction
Movement and/or failure of the foundation supporting the dam
Settlement and cracking of concrete or embankment dams
Piping and internal erosion of soil in embankment dams
Inadequate maintenance and upkeep (FEMA 2013a)
LEVEE FAILURE
Levees are man-made structures, usually an earthen embankment designed and constructed with sound
engineering practices to contain, control, or divert the flow of water in order to provide protection from
temporary flooding. A levee is built parallel to a body of water, typically a river, to protect the lives
and properties behind it. Currently, there are thousands of miles of levees across the United States. No
levee provides full protection from flooding (FEMA 2013c).
Levees are typically barriers between floodwaters and a nearby municipality. They include a series of
culverts, canals, ditches, storm sewers, or pump stations, called “interior drainage” systems. These
systems channel water from the land side of a levee over to the water side. When floodwaters
exceed the height of a levee, overtopping occurs. As the water passes over the top, it can erode the
levee, worsening the flooding and potentially causing an opening or beach in the levee. A levee breach
occurs when part of a levee gives way, creating an opening through which floodwaters may pass. A
breach can occur gradually or suddenly. The most dangerous breaches happen quickly during
periods of high water. The resulting torrent can quickly swamp a large area behind the failed levee
with little to no warning (American Society of Civil Engineers 2010).
5.3 - 2
USACE operates, maintains, and evaluates levees to determine if they meet accreditation requirements.
          Most levees are owned by local communities and flood control districts that must ensure proper
          operation and maintenance of the levee system as well (FEMA 2013c).
          As per the National Committee on Levee Safety, levees, when functioning properly, reduce the risk of
          flooding for communities. However, an unexpected levee breach or failure can be catastrophic,
          with the flooding causing loss of life, emergency evacuations, and insufficient time to reduce damages
          to property.
          5.3.1.1 REGULATIONS
          Dam Failure
          The potential for catastrophic flooding caused by dam failures led to the passage of the National Dam
          Safety Act (Public Law 92-367). The National Dam Safety Program (NDSP) has been used for 30 years to
          protect Americans from dam failure. The NDSP is a partnership of the states, federal agencies, and other
          stakeholders that encourages individual and community responsibility for dam safety. Under FEMA’s
          leadership, state assistance funds have allowed all participating states to improve their programs
          through increased inspections, emergency action planning, and the purchase of needed equipment.
          New Jersey is one of those participating states. FEMA has also expanded existing training programs and
          initiated new training programs. Grant assistance from FEMA provides support for the improvement of
          dam safety programs that regulate most of the dams in the United States.
          New Jersey Department of Environmental Protection – Dam Safety Section
          The NJDEP Dam Safety Section under the Bureau of Dam Safety and Flood Control has responsibility
          for overseeing dam safety in the State. In 1912, the New Jersey legislature passed a series of safety
          regulations related to the construction, repair, and inspection of existing and proposed dams in the
          State. In 1981, the law was amended and became the Safe Dam Act, N.J.S.A. 58:4. In 1985, the Dam
          Safety Standards, N.J.A.C. 7:20 regulations were passed, leading to the Dam Safety Section.
          The primary goal of the program is to ensure the safety and integrity of dams in New Jersey and,
          thereby, protect people and property from the consequences of dam failures. The Section also
          coordinates with the Division of State Police, local and county emergency management officials in the
          preparations and approval of Emergency Action Plans.
          The Dam Safety Section reviews plans and specifications for the construction of new dams or for the
          alternation, repair, or removal of existing dams and must grant approval before the owner can proceed
          with construction. Engineers from the Section evaluate each project, investigate site conditions, and
          check recommended construction materials. During construction, engineers identify conditions that
          may require design changes, check for compliance with approved plans and specifications, and approve
          foundations before material is placed.
          Existing dams are periodically inspected to assure that they are adequately maintained and owners are
          directed to correct any deficiencies found. The regulations require the owner to obtain a professional
          engineer to inspect their dams on a regular basis. These investigations include a comprehensive review
          of all pertinent material contained in the Department’s files, a visual inspection, technical studies when
          necessary, and the preparation of a comprehensive report (NJDEP 2012a).
          The owners or operators of all dams which raise the waters of any stream more than 70 feet above
          its usual mean low-water height or which impound more than 10,000 acre-feet of water shall have a
          regular inspection performed annually and formal inspections performed every three years by a New
          Jersey licensed professional engineer obtained by the owner. In addition, these inspections must be
          attended by a professional engineer assigned from the NJDEP.

5.3 - 3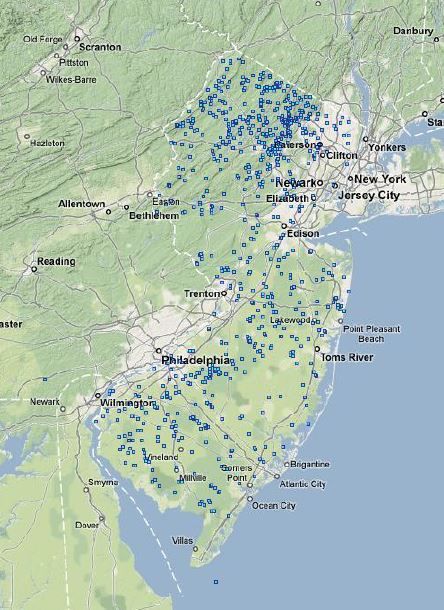
United States Army Corps of Engineers Dam Safety Program
The United States Army Corps of Engineers (USACE) is responsible for safety inspections of some
federal and non-federal dams in the United States that meet the size and storage limitations specified in
the National Dam Safety Act. USACE has inventoried dams and has surveyed each state and federal
agency’s capabilities, practices, and regulations regarding design, construction, operation, and
maintenance of the dams. USACE has also developed guidelines for inspection and evaluation of dam
safety (USACE 1997).
Federal Emergency Management Agency National Dam Safety Program
The National Dam Safety Program (NDSP) is used to protect people from dam failures. The NDSP is a
partnership of state and federal agencies, and other stakeholders that encourages individual and
community responsibility for dam safety (FEMA 2013b). The Program was established to improve
safety and security around dams by providing assistance grants to state dam safety agencies to assist
them in improving their regulatory programs; funding research to enhance technical expertise as dams
are built and rehabilitated; establishing training programs for dam safety inspectors; and creating a
National Inventory of Dams (NID). The NDSP includes:
Information needs for dam safety – under FEMA’s leadership, state assistance funds have
enabled all participating states to better their programs through increased inspections,
emergency action planning, and the purchase of needed equipment.
Dam safety training – grant assistance provides vital support for the improvement of state dam
safety programs that regulate most of the dams in the United States.
Dam safety research – a national research program in dam safety focuses on priorities and
produces products for both the layperson and the expert and develops technological tools that
drive data collection and analysis toward a better understanding of risk and remediation needs
(FEMA 2013b).
The National Dam Safety Program Act was signed into law on October 12, 1996 as part of the
Water Resources Development Act of 1996. It was amended by the Dam Safety and Security Act of
2002. It is administered through the Department of Homeland Security and FEMA. The Act calls for
FEMA to provide educations to the public, to dam owners and others about the need for strong dam
safety programs, nationally and locally, and to coordinate partnerships among all players within the dam
safety community to enhance dam safety (Association of State Dam Safety Officials 2004).
Federal Energy Regulatory Commission Dam Safety Program
The Federal Energy Regulatory Commission (FERC) has the largest dam safety program in the United
States. FERC cooperates with a large number of federal and state agencies to ensure and promote
dam safety and, more recently, homeland security, on dams associated with hydropower. There are
3,036 dams that are part of regulated hydroelectric projects and are included in the FERC program. Two-
thirds of these are more than 50 years old. As dams age, concern about their safety and integrity grows,
so oversight and regular inspection are important (FERC 2011). FERC staff inspects hydroelectric projects
on an unscheduled basis to investigate the following:
Potential dam safety problems
Complaints about constructing and operating a project
Safety concerns related to natural disasters
Issues concerning compliance with the terms and conditions of a license (FERC 2011).
Every five years, an independent consulting engineer, approved by the FERC, must inspect and
evaluate projects with dams higher than 32.8 feet (10 meters) or with a total storage capacity of more
than 2,000 acre- feet (FERC 2011).
5.3 - 4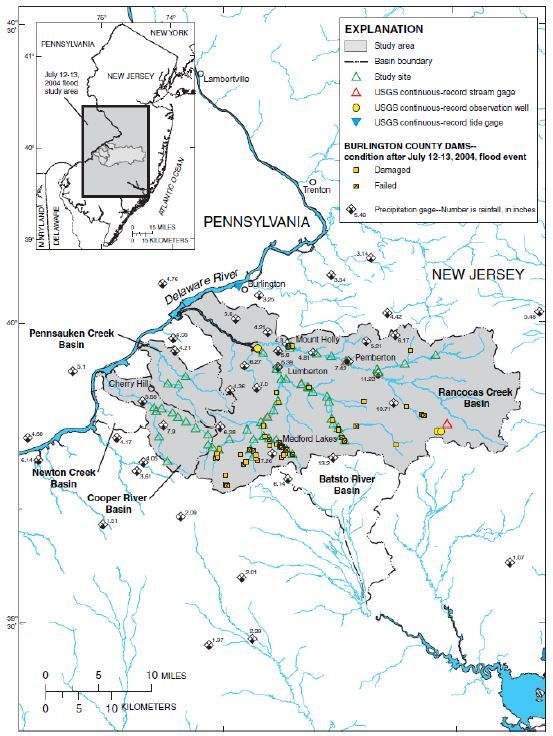
FERC monitors and evaluates seismic research in geographic areas where there are concerns about
seismic activity. This information is applied in investigating and performing structural analyses of
hydroelectric projects in these areas. FERC staff also evaluates the effects of potential and actual large
floods on the safety of dams. During and after floods, FERC staff visits dams and licensed projects,
determines the extent of damage, and directs any studies or remedial measures the licensee must
undertake. FERC’s Engineering Guidelines for the Evaluation of Hydropower Projects guides the FERC
engineering staff and licensees in evaluating dam safety. The publication is frequently revised to reflect
current information and methodologies (FERC 2011).
FERC requires licensees to prepare emergency action plans and conducts training sessions on how to
develop and test these plans. The plans outline an early warning system if there is an actual or potential
sudden release of water from a dam failure. The plans include operational procedures that may be
used, such as reducing reservoir levels and reducing downstream flows, as well as procedures for
notifying affected residents and agencies responsible for emergency management. These plans are
frequently updated and tested to ensure that everyone knows what to do in emergency situations (FERC
2011).
Levee Failure
USACE and FEMA
USACE and FEMA have differing roles and responsibilities related to levees. USACE addresses a range of
operation and maintenance, risk communication, risk management, and risk reduction issues as part of
its responsibilities under the Levee Safety Program. FEMA addresses mapping and floodplain
management issues related to levees, and it accredits levees as meeting requirements set forth by
the National Flood Insurance Program.
Depending on the levee system, USACE and FEMA may be involved with the levee sponsor and
community independently or—when a levee system overlaps both agency programs—jointly. Under
both scenarios, the long-term goals are similar: to reduce risk and lessen the devastating consequences
of flooding. Some USACE and FEMA partnering activities related to levees include:
Joint meetings with levee sponsors and other stakeholders
Integration of levee information into the National Levee Database
State Silver Jackets teams
Sharing of levee information
Targeted task forces to improve program alignment
Coordination between USACE and FEMA with regard to levees is now standard within many of each
agency’s policies and practices. Over the past several years, both agencies coordinated policies
where appropriate; jointly participated in meetings with stakeholders; and participated in many
multiagency efforts, such as the National Committee on Levee Safety, the Federal Interagency
Floodplain Management Task Force, and the Silver Jackets Program.
The Silver Jackets is a program that provides an opportunity to consistently bring together multiple
state, federal, tribal, and local agencies to learn from each other and apply their knowledge to reduce
risk. The Program’s primary goals include the following:
Create or supplement a mechanism to collaboratively identify, prioritize, and address risk
management issues and implement solutions
Increase and improve risk communication through a unified interagency effort
Leverage information and resources and provide access to such national programs (FEMA’s
Risk MAP and USACE’s Levee Inventory and Assessment Initiative)
Provide focused, coordinated hazard mitigation assistance in implementing high-priority actions
such as those identified by state hazard mitigation plans
5.3 - 5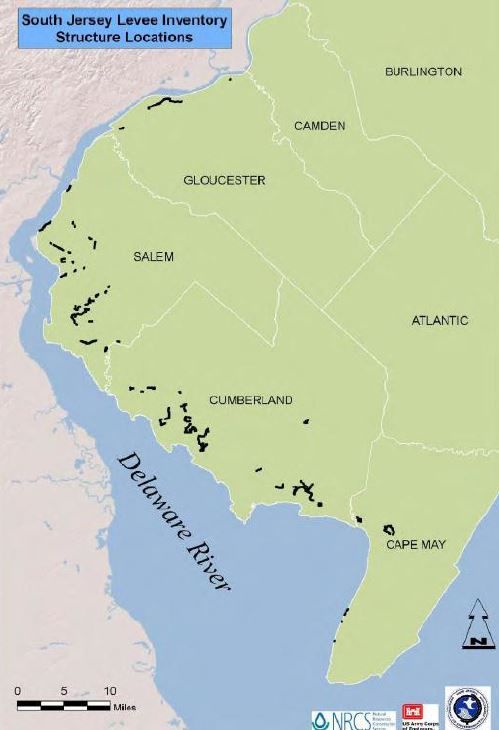
Identify gaps among agency programs and/or barriers to implementation, such as conflicting
agency policies or authorities, and provide recommendations for addressing these issues
New Jersey has an active Silver Jackets team for life-cycle flood risk management. The focus of the
State’s team is the Passaic River Flood Advisory Commission recommendations, flood inundation
mapping, and outreach and coordination.
National Committee on Levee Safety
Congress created the National Committee on Levee Safety to “develop recommendations for a national
levee safety program, including a strategic plan for implementation of the program.” The Committee
adopted the vision of “an involved public and reliable levee systems working as part of an integrated
approach to protect people and property from floods,” and has been working toward this goal since
October 2008 (National Committee on Levee Safety 2010).
The Committee is made up of representatives from state, regional, and local agencies, the private
sector, USACE, and FEMA.
New Jersey
Currently in New Jersey, no single agency oversees the operation and maintenance of levees or levee
systems nor has specific regulatory authority or responsibility over the safety of existing or proposed
levees or levee systems. Rather, the oversight is accomplished through coordination of federal, state and
local authorities.
5 . 3 . 2 L O C A TI O N
DAM FAILURE
According to the National Inventory of Dams (NID), there are 87,359 dams in the United States. Of
these 87,359 dams, federal agencies own 3,808; state agencies own 6,435; local agencies own 15,938;
public utilities companies own 1,686; and private entities or individuals own 56,541. Ownership to 2,951
dams is undetermined (USACE 2013a). Figure 5.3-1 displays the location of these dams throughout the
United States. The NID categorizes the dams according to their primary function:
Recreation - 31.8% (27,733 dams)
Flood Control - 17.0% (14,883 dams)
Fire Protection - 12.9% (11,253 dams)
Irrigation - 9.3% (8,133 dams)
Other - 8.1% (7,087 dams)
Water Supply - 7.2% (6,307 dams)
Undetermined - 5.0% (4,416 dams)
Fish and Wildlife – 3.8% (3,300 dams)
Hydroelectric – 2.5% (2,209 dams)
Tailings – 1% (839 dams)
Grade Stabilization – 0.7% (573 dams)
Debris Control – 0.5% (422 dams)
Navigation – 0.2% (204 dams) (USACE 2013b)
5.3 - 6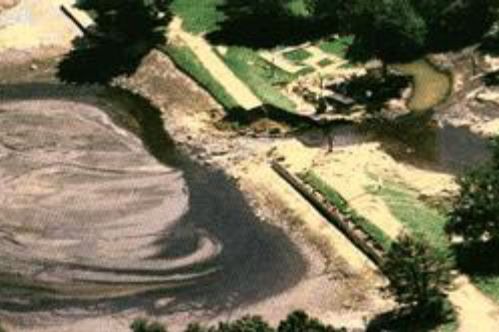
Figure 5.3-1 Locations of Dams in the United States (National Inventory of Dams)

          Source: USACE

          According to the NID, there are 825 dams in New Jersey. Of these 825 dams, federal agencies own 23;
          State agencies own 125; local agencies own 282; public utilities companies own 1; and private entities or
          individuals own 394 (Figure 5.3-2) (USACE 2016). Nearly half (48%) of the dams in New Jersey are
          owned by private entities or individuals and the public utilities sector owns the least number of all dams
          in New Jersey.
          However, the NJDEP maintains a listing of 1,998 dams across the State (NJDEP 2018). Figure 5.3-2
          displays the location of these dams throughout New Jersey.

5.3 - 7
F i g u r e 5 . 3 - 2 L o ca t io n s o f D a m s in N e w J er s ey ( Na t i o n a l I nv e nt o r y of D a m s )

Source: USACE

                                                                                                                     5.3 - 8
Levee Failure
Levees are located across the country, but certain states rely on them more than others (such as
Arkansas, Louisiana, Missouri, Mississippi, and California). There is no exact number of miles of levees
in the United States; however, it is believed to be as many as 100,000 miles of levees. More than
85% are thought to be locally owned and the remaining 15% are overseen by the USACE or other
federal or state agencies. FEMA has estimated that levees are located in approximately 22% of the
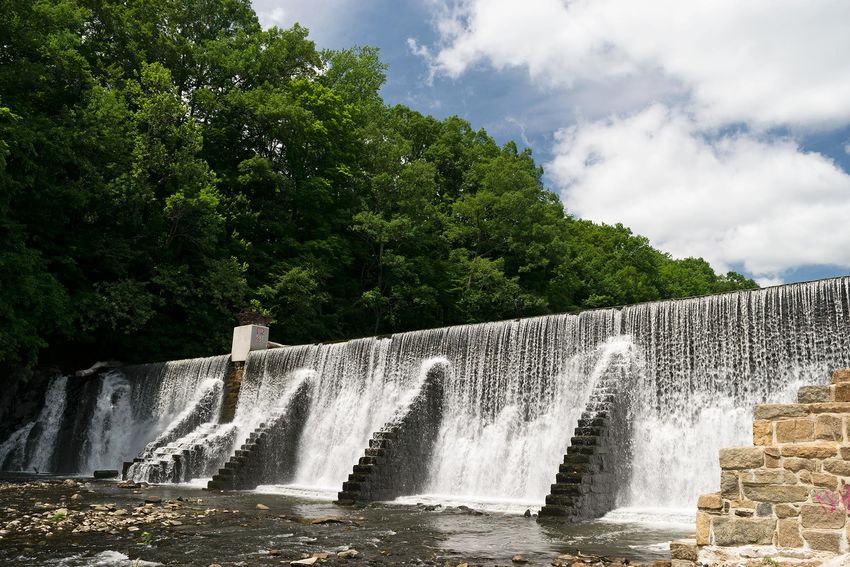
counties in the United States, and 43% of the population lives in counties with levees. Figure 5.3-5
shows which counties in the United States contain levees, including Bergen, Essex, Gloucester,
Hudson, Middlesex, Monmouth, and Union Counties in New Jersey, according to the American Society of
Civil Engineering. Information shown on this figure is current as of August 2009. The red circle indicates
the approximate location of New Jersey.
Figure 5.3-3 United States Counties Where Levees Are Found
Source: American Society of Civil Engineering 2010
A comprehensive listing regarding the types and locations of levees across the State is not available.
This is due in part to the lack of oversight at the State level, but more notably because many of the levee
systems were not built through formal processes. Table 5.3-1 lists the locations of levee systems
throughout the State reported in the USACE National Levee Database. These systems represent the
major structures across the State in which the USACE has provided some degree of assistance or
oversight during development. The table includes levees that are owned federally, by the State, or
locally. According to USACE, there are 10 levees in New Jersey in Essex, Gloucester, Monmouth, and
Union Counties. The following table provides details about these levees.
5.3 - 9Table 5.3-1 USACE Levees in New Jersey
LENGT RIP
SPONSOR(S SEGMENT INSPECTIO
COUNTY SYESTEM NAME H STATU
) S N RATING
(MILES) S
S. Orange, Rahway
Essex Town of South Minimally
East Branch, RB 1 0.09 Active
County Orange Acceptable
South**
S. Orange, Rahway
Essex Town of South Minimally
East Branch, LB 1 0.1 Active
County Orange Acceptable
North**
Dupont
Repauno
Works,
Greenwich
Township,
Gloucester Gloucester
Gibbstown* 4 3.96 Inactive N/A
County County,
Hercules, Inc,
Logan
Township,
Gloucester
County
Hazlet
township, NJ
Keansburg
Raritan Bay & Sandy
Monmouth borough, NJ
Hook Bay, 1 5.63 Active Unacceptable
County Middletown
Keansburg**
township, NJ
Union Beach
borough, NJ
Union Rahway, Rahway River Minimally
City of Rahway 1 0.96 Active
County South Branch RB** Acceptable
Union Town of Hillside, Elizabeth, Minimally
1 0.34 Active
County Hillside River Left Bank** Acceptable
Elizabeth, Elizabeth,
Union City of
River Right Bank 1 1.28 Active Unacceptable
County Elizabeth
South**
Elizabeth, Elizabeth
Union City of
River Right Bank 1 0.21 Active Unacceptable
County Elizabeth
North**
Elizabeth, Elizabeth,
Union City of
River Left Bank 1 1.71 Active Unacceptable
County Elizabeth
South**
Elizabeth, Elizabeth
Union City of Minimally
River Left Bank 1 0.16 Active
County Elizabeth Acceptable
North**
Source: USACE
The South Jersey Levee Inventory was created to identify and characterize the location, extent, and
characteristics of existing levees/dikes in and along the Delaware Bay and the lower Delaware River
in the southern New Jersey counties of Cape May, Cumberland, Gloucester, and Salem. The inventory
provides an estimate of the amount, type, and extent of vulnerability of people and property, including
agricultural acreages and businesses, protected by the levees. The goal of the information obtained
5.3 - 10through the inventory would assist in providing for enhanced levee safety management and emergency
response activities.
The South Jersey Levee Inventory was conducted by the United States Department of Agriculture
(USDA) Natural Resources Conservation Service (NRCS) under an agreement signed in August 2006 with
the USACE. Funding was provided by the Bureau of Dam Safety and Flood Control of the NJDEP. The
inventory was divided into two parts: field inventory and the Light Detection and Ranging (LiDAR)
analysis. The field inventory initially identified 107 levees using 2002 aerial photography. After the
inventory was completed in May 2010, 70 structures were verified as actual levees. LiDAR analysis of
these determined the location, extent, and areas protected from tidal inundation and flooding. Over
3,000 structures are identified as being protected by levees in six (of the 70 levees) selected levee
locations. Approximately 86% of all levees identified in the four South Jersey counties surveyed were
located in Cumberland and Salem Counties. Overall, the inventory revealed that 70% of the levees are
owned by private individuals and each of the 22 municipalities in the four counties studied had at least
one levee (http://www.nrcs.usda.gov/Internet/FSE_DOCUMENTS/nrcs141p2_018319.pdf)
Figure 5.3-6 shows the locations of levees in the four counties study, as determined from a 2002
aerial photograph and field verification.
Figure 5.3-4 Levee Locations in South Jersey
Source: USDA 2010
5.3 - 115.3.3 EXTENT
Dam Failure
The extent or magnitude of a dam failure event can be measured in terms of the classification of
the dam. FEMA has three classification levels of dams: low, significant, and high. The classification
levels build on each other. The hazard potential classification system should be utilized with the
understanding that the failure of any dam or water-retaining structure could represent a danger to
downstream life and property (FEMA, 2004).
Low hazard potential dams are those where failure or mis-operation results is no probable
loss of human life and low economic and/or environmental losses. Losses are principally limited
to the owner’s property.
Significant hazard potential dams are those where failure or mis-operation results in no probable
loss of human life but can cause economic loss, environmental damage, disruption of lifeline
facilities, or can impact other concerns. Significant hazard potential classification dams are often
located in predominately rural or agricultural areas.
High hazard potential dams are those where failure or mis-operation will probably cause loss of
human life.
USACE developed the classification system shown in Table 5.3-2 for the hazard potential of dam
failures. USACE hazard rating systems is based only on the potential consequences of a dam failure; it
does not take into account the probability of such failures.
Table 5.3-2 United States Army Corps of Engineers Hazard Potential Classification
HAZARD DIRECT LOSS OF LIFELINE PROPERTY ENVIRONMENTAL
CATEGORYa LIFEb LOSSESc LOSSESd LOSSES
None (rural location, No disruption of
Private agricultural
no permanent services (cosmetic Minimal incremental
Low lands, equipment, and
structures for human or rapidly damage
isolated buildings
habitation) repairable damage)
Rural location, only Disruption of
Major public and
Significant transient or day-use essential facilities Major mitigation required
private facilities
facilities and access
Certain (one or more)
extensive residential, Disruption of
Extensive public and Extensive mitigation cost
High commercial, or essential facilities
private facilities or impossible to mitigate
industrial and access
development
a. Categories are assigned to overall projects, not individual structures at a project.
b. Loss-of-life potential is based on inundation mapping of area downstream of the project. Analyses of loss-of-life potential should
take into account the population at risk, time of flood wave travel, and warning time.
c. Lifeline losses include indirect threats to life caused by the interruption of lifeline services from project failure or operational
disruption; for example, loss of critical medical facilities or access to them.
d. Property losses include damage to project facilities and downstream property and indirect impact from loss of project services,
such as impact from loss of a dam and navigation pool, or impact from loss of water or power supply.
e. Environmental impact downstream caused by the incremental flood wave produced by the project failure, beyond what would
normally be expected for the magnitude flood event under which the failure occurs.
Source: United States Army Corps of Engineers 1995
According to the NJDEP, there are four hazard classifications of dams in New Jersey. The classifications
relate to the potential for property damage and/or loss of life in the event of a dam failure:
Class I (High-Hazard Potential) - Failure of the dam may result in probable loss of life
and/or extensive property damage.
5.3 - 12 Class II (Significant-Hazard Potential) - Failure of the dam may result in significant property
damage; however, loss of life is not envisioned.
Class III (Low-Hazard Potential) - Failure of the dam is not expected to result in loss of life
and/or significant property damage.
Class IV (Small-Dam Low-Hazard Potential) - Failure of the dam is not expected to result in loss
of life or significant property damage.
Table 5.3-3 summarizes the number of dams and their hazard classifications, by County.
Table 5.3-3 Number of Dams by County in New Jersey
HIGH
SIGNIFICANT LOW OTHER
COUNTY HAZAR TOTAL
HAZARD HAZARD STRUCTURES*
D
Atlantic 1 7 31 39 12
Bergen 7 9 55 71 8
Burlington 11 39 95 145 28
Camden 1 19 56 76 7
Cape May 0 7 4 11 4
Cumberland 4 11 12 27 11
Essex 8 4 14 26 8
Gloucester 3 26 29 58 12
Hudson 1 0 0 1 2
Hunterdon 10 10 70 90 17
Mercer 8 8 72 88 9
Middlesex 4 11 24 39 12
Monmouth 11 16 85 112 16
Morris 37 46 137 220 31
Ocean 8 15 75 98 7
Passaic 49 23 61 133 22
Salem 1 20 21 42 9
Somerset 4 13 67 84 18
Sussex 40 40 156 236 32
Union 4 7 13 24 8
Warren 15 6 65 86 19
Totals 227 337 1,142 1,706 292
Source: NJDEP 2018
*NJDEP Dams database classifies structures that are not technically dams within their database. These include dams that are
less than 5 feet, have been removed, never built, failed, etc.
LEVEE FAILURE
In the event of a levee failure, floodwaters may ultimately inundate the protected area landward of the
levee. The extent of inundation is dependent on the flooding intensity. Failure of a levee during a one-
percent annual chance flood will inundate the approximate 100-year flood plain previously protected by
the levee. Residential and commercial buildings located nearest the levee overtopping or breach
location will suffer the most damage from the initial embankment failure flood wave. Landward
buildings will be damaged by inundation (FEMA, 2004).
5.3 - 13Levees require maintenance to continue to provide the level of protection they were designed and built
to offer. Maintenance responsibility belongs to a variety of entities including local, state, and federal
government and private landowners. Well-maintained levees may obtain certification through
independent inspections. Levees may not be certified for maintaining flood protection when the levee
owner does not maintain the levee or pay for an independent inspection. The impacts of an un-
certified levee include higher risk of levee failure. In addition, insurance rates may increase because
FEMA identifies on Flood Insurance Rate Maps that the structures are not certified to protect from a
one-percent annual chance flood event (FEMA, 2004).
5 . 3 . 4 PRE VI O U S O CC U RRE NC E S AND L OS SE S
Dam Failure
Dam failures can occur suddenly, without warning, and may occur during normal operating conditions.
This is referred to as a “sunny-day” failure. Dam failures may also occur during a large storm event.
Significant rainfall can quickly inundate an area and cause floodwaters to overwhelm a reservoir. If
the spillway of the dam cannot safely pass the resulting flows, water will begin flowing in areas not
designed for such flows, and a failure may occur. Over the years, New Jersey has seen significant
property damage including damage or loss of dams, bridges, roads, and buildings as a result of such
storm events and dam failures. New Jersey has also been impacted by levee failures.
The following section provides details about several dam failure events that occurred in the State
of New Jersey. Several sources provided historical information regarding previous occurrences and
losses associated with dam failure events throughout the State. Loss and impact information for these
events could vary depending on the source; therefore, the accuracy of monetary figures and event
details is based only on the available information identified during research for this HMP.
Sarubbi Dam Failure 1927
In 1927, the Sarubbi Dam located in Morris County failed during non-storm conditions. Referred to
as a “sunny-day failure,” the sudden loss of concrete sections caused this dam to fail in November 1927.
Based on anecdotal research, this is the only dam failure that was not a direct result of another hazard.
September 1940 Storm
On September 1, 1940, Southern New Jersey experienced an unusually large storm event associated
with a tropical system. The system inundated portions of Camden, Gloucester, Salem, Cumberland, and
Atlantic Counties.
Damage throughout South-Jersey was widespread, from Millville to Clementon. Dozens of roads,
bridges, and dams were damaged or destroyed as a result of the ensuing floods. Portions of the area
experienced over 24 inches of rain in less than 12 hours. This extraordinary rainfall intensity was
experienced over a localized area near Parvin State Park, located northwest of the City of Vineland.
Hurricane Floyd 1999
On September 16, 1999, Hurricane Floyd, a tropical storm by the time it hit New Jersey, combined
with a weather system from the west to drop significant rainfall in portions of the State.
Hardest hit was the Raritan River Basin. Although the State’s dams were spared the worst and no loss of
life or significant property damage was attributed to the failure of a dam, the storm left behind a trail of
damage to the State’s dams.
In the weeks following the storm, the NJDEP Dam Safety Section inspected over 50 dams to assess the
impact of the storm. They documented complete failure of three dams and notable damage to 24
dams (NJDEP, 2012b). Table 5.3-4 lists dams affected by the incident.
5.3 - 14Table 5.3-4 Dams Affected by Hurricane Floyd in 1999
DAM NAME TOWNSHIP COUNTY
COMPLETE FAILURE
Kirbys Mill Dam Medford Township Burlington
Bostwick Lake Dam Upper Deerfield Twp. Cumberland
Spencer Detention Basin Dam Morris Twp. Morris
NOTABLE DAMAGE
Whites Pond Dam Borough of Waldwick Bergen
Diamond Mill Dam Millburn Twp. Essex
Orange Reservoir Dam West Orange Twp. Essex
Singley Dam Borough of Runnemede Gloucester
Amwell Dam No. 2 West Amwell Twp. Hunterdon
Lambertville Dam No. 1 West Amwell Twp. Hunterdon
Lamberville Dam No. 2 West Amwell Twp. Hunterdon
Amwell Dam No. 1 West Amwell Twp. Hunterdon
Amwell Dam No. 3 West Amwell Twp. Hunterdon
Lake Winona Dam Jefferson Twp. Morris
Shongum Lake Dam Randolph Twp. Morris
Hudsonia Dam Rockaway Twp. Morris
Laurel Lake Dam West Milford Twp. Passaic
West Milford Lake Dam West Milford Twp. Passaic
Stowaway Lake Dam West Milford Twp. Passaic
Pinecliff Lake Dam West Milford Twp. Passaic
Gordon Lake Dam West Milford Twp. Passaic
Watchung Lake Dam Borough of Watchung Somerset
Sunset Lake Dam Bridgewater Twp. Somerset
Skillman Dam Montgomery Twp. Somerset
Mountain Creek Pond Dam Vernon Twp. Sussex
Bloodgoods Dam Clark Twp. Union
Shackamaxon Dam Scotch Plains Twp. Union
Seeley's Pond Dam Scotch Plains Twp. Union
Source: NJDEP, 2012
Sparta Storm August 2000
Another dam failure incident occurred in August 2000 that affected northern counties in New Jersey.
Unusually large amounts of rain produced by a series of thunderstorms deluged parts of
northwestern New Jersey during the period August 11-14, 2000 (USGS 2001a). Rainfall was greatest
in parts of southeastern Sussex County and northwestern Morris County where rainfall totals exceeded
14 inches. A total of four dams completely failed as a result of the ensuing floods. The dams were on
Seneca Lake, Tomahawk Lake, Furnace Pond, and Edison Pond in Sussex County. An additional 26
dams in Sussex and Morris Counties were damaged (National Weather Service 2000). Total damage
was an estimated $179 million (USGS 2001b).
Table 5.3-5 lists dams affected by the incident. Additionally, Figure 5.3-7 shows a photograph of the
Tomahawk Lake Dam failure that occurred during this storm.
5.3 - 15Table 5.3-5 Dams Affected by the 2000 Sparta Storm
DAM NAME MUNICIPALITY COUNTY
Complete Failure
Seneca Lake Dam Sparta Sussex
Tomahawk Lake Dam Byram Sussex
Furnace Pond Dam Stanhope Sussex
Edison Pond Dam Sparta Sussex
Less Than Complete Failure
Lake Tamarack Dam Hardyston Sussex
NJ No Name No. 51 Jefferson Morris
Shawnee Lake Dam Jefferson Morris
Hawthorne Lake Dam Sparta Sussex
Glen Lake Dam Sparta Sussex
Washington Forge Pond Wharton Morris
Arapaho Lake Dam Sparta Sussex
NJ No Name No. 43 Sparta Sussex
Rock Island Dam Sparta Sussex
Oak Ridge Lake Dam Jefferson Morris
Acquackanock Dam Sparta Sussex
Sparta Lake Dam Sparta Sussex
Cozy Lake Dam Jefferson. Morris
Saginaw Lake Dam Sparta Sussex
Summit Lake Dam Hardyston Sussex
Lower Waterloo Dam Byram & Mt. Sussex and Morris
Upper Waterloo Dam Mt. Olive Morris
Franklin Pond Dam Franklin Sussex
Heaters Pond Dam Ogdensburg Sussex
Morris Lake Dam Sparta Sussex
Camp Ryker Lake Dam Sparta Sussex
Swannanoa South Dam Jefferson Morris
Winona Lake Dam Jefferson Morris
Saffin Pond Dam Jefferson Morris
Lake Hartung Dam Jefferson Morris
Elwood Headley Pond Jefferson Morris
Source: USGS, 2011
5.3 - 16F i g u r e 5 . 3 - 5 T o ma haw k L a k e Da m Fa i lur e A ug u s t 20 0 0
Source: NJDEP, 2012
Burlington County Dam Failures 2004
A significant dam failure incident occurred in 2004 as a result of heavy rains. Unusually large amounts of
rain deluged parts of Burlington, Camden, and Ocean Counties in southern New Jersey from the
morning of July 12 through the early morning hours of July 13, 2004. Doppler radar estimates of total
rainfall for the 24-hour period ending 7:00am on July 13 were from eight to 12 inches over central
Burlington, western Ocean, and eastern Camden Counties. More than 11 inches of rain was recorded by
rain gages in Pemberton and Tabernacle Townships in Burlington County (USGS, 2013).
The NJDEP reported that 17 dams failed and 28 dams were damaged in Burlington County. All 17
dam failures occurred in the Rancocas Creek Basin. Two of the dams were in the North Branch Rancocas
Creek Basin, and the remaining 15 were in the upper reaches of the South Branch Rancocas Creek Basin.
Of the 28 dams that were damaged, 27 were in the Rancocas Creek Basin, three in the North Branch
Rancocas Creek Basin, and 24 were in the South Branch Rancocas Creek Basin. The remaining damaged
dam was in the Batsto River Basin (Protz and Reed 2006). Table 5.3-6 lists the dams affected by the
storm. Additionally, Figure 5.3-8 shows the locations of damaged and destroyed dams in Burlington
County as a result of the incident.
Table 5.3-6 Dams Affected by the 2004 Burlington County Storm
DAM NAME MUNICIPALITY COUNTY
Complete Failure
Kenilworth #2 Dam Evesham Burlington
Strokes-Lower Dam Medford Burlington
Lake Stockwell Dam Medford Burlington
Birchwood Lake Dam Medford Burlington
Papoose Lake Dam Medford Lakes Burlington
Upper Aetna Dam Medford Lakes Burlington
Lower Aetna Dam Medford Lakes Burlington
Camp Inawendiwin Lower Dam Tabernacle Burlington
Reeves Dam B Woodland Burlington
Lower Reeves Bog Dam Woodland Burlington
Crane Lake Dam Evesham Burlington
Lost Lake Dam Evesham Burlington
5.3 - 17DAM NAME MUNICIPALITY COUNTY
Hinchman Dam Medford Burlington
Third Street Dam Southampton Burlington
Blue Lake Dam Medford Burlington
Squaw Lake Dam Medford Burlington
Less Than Complete Failure
Saipe Lake Dam Medford Burlington
Fostertown Road Dam Medford Burlington
Upper Stokes Dam Medford Burlington
Golf Course Dam Evesham Burlington
Mill Dam Mount Holly Burlington
Cranberry Lakes Dam #6 Medford Burlington
Kirby’s Mill Road Medford Burlington
Burnt Bod Dam Medford Burlington
Oliphants Mill Lake Dam Medford Burlington
Old Forge Lake Dam Southampton Burlington
Bayberry Street Dam Pemberton Burlington
Upper Mimosa Dam Medford Burlington
Kenilworth #3 Dam Evesham Burlington
Mimosa Lake Dam Medford Burlington
Fisher Pond Dam Southampton Burlington
Quoque Dam Medford Lakes Burlington
JCC Dam Medford Burlington
Kenilworth Lake Dam Evesham Burlington
Kettle Run Road Dam Evesham Burlington
Lebanon Forrest #1 Dam Pemberton Burlington
Marlton Lakes Upper Dam Evesham Burlington
Batsto Lake Dam Washington Burlington
Union Mill Lake Dam Evesham Burlington
Van Dal Lake Dam Evesham Burlington
Sooy Dam Woodland Burlington
New Jersey No Name #8 Southampton Burlington
Timer Lake Dam Medford Burlington
Vincentown Mill Dam Southampton Burlington
Source: NJDEP 2004
5.3 - 18Figure 5.3-6 Locations of Damaged and Destroyed Dams 2004
Source: Protz and Reed, 2006
Gloucester County Levee Breach 2005
Heavy rain associated with the remnants of Tropical Storm Cindy fell across New Jersey on July 8,
2005. Storm totals ranged from 1.5 to five inches. The heavy rain caused poor drainage and roadway
flooding. In Logan Township (Gloucester County), emergency repairs were made to a 30-foot breach in a
levee off of Floodgate Road to keep the Delaware River at bay (NOAA NCDC, 2013).
Monmouth County Dam Failure 2005
Heavy rain associated with a low-pressure system southeast of New Jersey moved into Monmouth
County between October 13 and 14, 2005. The three-day storm totals in the County averaged
between four and 11 inches, with the highest amounts near the coast. Dams failed on both Spring
Lake and Mill Pond, and Deal Lake overflowed. Nearly 1,200 people were evacuated and a state of
emergency was declared. Approximately 100 people were evacuated near the Shark River when a
5.3 - 19levee along the River broke. In Wall Township, a dam breach on Mill Pond in Allaire State Park caused
significant water damage and a roadway collapse in the village within the Park (NOAA NCDC, 2013).
Hunterdon County 2006
Several days of heavy rain throughout the Delaware River Basin culminated with major flooding
along the Delaware River between June 28 and 30, 2006. It was the fourth highest crest on record
for the Delaware River along Hunterdon County. Rainfall totals in the County averaged from four to
eight inches, with storm totals exceeding 10 inches in parts of the Upper Delaware River Basin in New
York State. The County was declared a state of emergency. Approximately 1,250 homes and businesses
were damaged and four were destroyed. In the Borough of Stockton, a levee breach compounded the
flooding. Evacuations occurred from the Delaware River east to New Jersey State Route 29. Most of
the flooding was confined to basements. Overall damages from the storm were estimated at $7.5
million.
Rainbow Lake Dam 2007
A Nor’Easter struck New Jersey between April 15 and 16, 2007, bringing up to 10 inches of rain in parts
of the State. Salem County was particularly hit hard, with high flood flows that overflowed and failed
the Rainbow Lake Dam on State Route 56 in Pittsgrove Township. The 20-foot high earth embankment
dam impounded an 80-acre lake. The road washed out and a gas main broke (Dam Safety, 2010).
Southwestern New Jersey Dam Breaks 2011
A series of thunderstorms brought three to seven inches of rain across New Jersey on August 14,
2011. In southern Gloucester, eastern Salem, and western Cumberland Counties, rainfall totals ranged
from seven to 11 inches. This event, combined with scattered thunderstorms on August 15, 2011,
caused severe flash flooding with dam breaks in southwestern New Jersey (NOAA NCDC, 2013). The
NJDEP Bureau of Dam Safety reported the failure of five dams as a result of this storm. The Seeley’s Mill
Pond Dam, located upstream from the Cohansey River at Seeley gaging station completely failed (USGS,
2013). Other sources indicated that four dams failed and as a result, approximately 24 dams had to
lower reservoirs in order for inspections and analyses to be completed. Damage totals were
estimated at $25 million, most of which occurred in Salem and Cumberland Counties (NOAA NCDC,
2013).
Hurricane Irene August 2011
The NJDEP Bureau of Dam Safety reported the failure of six dams as a result of Hurricane Irene. Three
of these dams are located upstream from USGS gaging stations. Saffrin Pond Dam, failed
completely. It is located on Weldon Brook, a tributary to Lake Hopatcong, upstream from the USGS
stage-only gage on Lake Hopatcong and the continuous-record streamflow-gaging station on
Musconetcong River at the outlet of Lake Hopatcong. The New Jersey No Name # 89 Dam, located on a
tributary to Crosswicks Creek in North Hanover Township in Burlington County upstream from the gage
on Crosswicks Creek at Extonville, failed completely. The Bureau of Dam Safety also reported damage to
the spillway at Cassville Dam, located on a small tributary to the Toms River, upstream from the gage on
Toms River near Toms River. Water stored in these impoundments contributed to the flow past these
gages during the flood. The portion of the hydrograph contributed by the dam breaches is not
distinguishable from the runoff contributed by the rainfall (USGS, 2013).
FEMA Disaster Declarations
Based on all sources researched, the State of New Jersey was not included in any FEMA disaster
declarations directly related to dam or levee failure events.
5.3 - 205 . 3 . 5 P R O B A B I L I T Y O F F U TU R E O CC U R R E NC E S
Dam Failure
Dam failure events are infrequent and usually coincide with events that cause them, such as
earthquakes, landslides, and excessive rainfall and snowmelt. As noted in the Previous Occurrences and
Losses section, dam failures typically occur in New Jersey as a result of heavy rains or other precipitation.
There is a “residual risk”, or risk that remains after safeguards have been implemented, associated with
dams. The residual risk for dams is associated with events beyond those that the facility was designed
to withstand. However, the probability of any type of dam failure is low in today’s dam safety regulatory
and oversight environment.
Levee Failure
A complete levee failure, like dam failures, is rather infrequent and typically coincides with events that
cause them such as heavy rainfall, storm surge, or hurricanes. As previously stated, there have been no
major documented levee failures in New Jersey to date; however, the potential does exist given the
varied construction and maintenance procedures in place for systems in New Jersey. Aside from
unregulated levee systems, some levees that the USACE inspects regularly have not scored well in terms
of structural standing. Table 5.3-7 shows the current inspection ratings for levees in New Jersey under
the USACE program.
Table 5.3-7 Inspection Status of New Jersey Levees Monitored by the United States Army Corps of Engineers
SYSTEM NAME LAST INSPECTION INSPECTION RATING*
S. Orange, Rahway East Branch, LB North 40,374 Minimally Acceptable
S. Orange, Rahway East Branch, RB South 40,367 Minimally Acceptable
Gibbstown - -
Raritan Bay and Sandy Hook Bay, Keansburg 40,318 UNACCEPTABLE
Rahway, Rahway River South Branch RB 40,332 Minimally Acceptable
Hillside, Elizabeth River Left Bank 40,065 Minimally Acceptable
Elizabeth, Elizabeth River Right Bank South 40,317 UNACCEPTABLE
Elizabeth, Elizabeth River Right Bank North 40,317 UNACCEPTABLE
Elizabeth, Elizabeth River Left Bank South 40,315 UNACCEPTABLE
Elizabeth, Elizabeth River Left Bank North 40,317 Minimally Acceptable
*Three National Levee Database Inspection Ratings can be given: Acceptable, Minimally Acceptable, and Unacceptable.
Source: USACE 2013
Additionally, many levees assessed as part of the South Jersey Levee Inventory did not fare well
either. The study found that 24% had erosion issues, 35% had significant settlement, 29% had
significant depressions, 25% showed signs of cracking, and nearly 30% showed signs of burrowing
animals (shown on Figure 5.3-9 through Figure 5.3-11).
Figure 5.3-7 Erosion Cracking Burrowing
5.3 - 21Source: USDA 2010
5.3.5.2 POTENTIAL EFFECTS OF CLIMATE CHANGE
Dam Failure
Dams are designed partly based on assumptions about a river’s flow behavior, expressed as
hydrographs. Changes in weather patterns can have significant effects on the hydrograph used for the
design of a dam. If the hygrograph changes, it is conceivable that the dam can lose some or its entire
designed margin of safety, also known as freeboard. Loss of designed margin of safety may cause
floodwaters more readily to overtop the dam or create unintended loads. Such situations could lead to a
dam failure.
The New Jersey Climate Adaptation Alliance is a network of policymakers, public and private-sector
practitioners, academics, non-governmental organizations (NGO), and business leaders aligned to build
climate change preparedness in the state of New Jersey. The Alliance is facilitated by Rutgers
University, which provides science and technical support, facilitates the Alliance’s operations and
advances its recommendations. A document titled Change in New Jersey: Trends and Projections was
developed to identify recommendations for State and local public policy that will be designed to
enhance climate change preparedness and resilience in New Jersey (Rutgers 2013).
Temperatures in the Northeast United States have increased 1.5 degrees Fahrenheit (°F) on average
since 1900. Most of this warming has occurred since 1970. The State of New Jersey, for example, has
observed an increase in average annual temperatures of 1.2°F between the period of 1971-2000 and
the most recent decade of 2001-2010 (ONJSC, 2011). Winter temperatures across the Northeast have
seen an increase in average temperature of 4°F since 1970 (Northeast Climate Impacts Assessment
[NECIA] 2007). By the 2020s, the average annual temperature in New Jersey is projected to increase
by 1.5°F to 3°F above the statewide baseline (1971 to 2000), which was 52.7°F. By 2050, the
temperature is projected to increase 3°F to 5°F (Sustainable Jersey Climate Change Adaptation Task
Force 2013).
Both northern and southern New Jersey have become wetter over the past century. Northern New
Jersey’s 1971-2000 precipitation average was over 5” (12%) greater than the average from 1895-1970.
Southern New Jersey became 2” (5%) wetter late in the 20th century (Office of New Jersey State
Climatologist). Changes in climate may lead to higher intensity rainfall events. As a result, the failure
probability of low, significant, and under-designed high hazard dams may increase.
Levee Failure
Levees in New Jersey may be affected by the impacts of climate change. Of particular concern may
be the stress that a rising sea level could have on levee systems. As the seas rise there may be additional
hydrostatic pressure placed on coastal and tidal river levee systems, thus increasing the potential for
failure. Additionally, climatologists predict an increase in the intensity and frequency of coastal
storms such as hurricanes and tropical storms. The increase of coastal storms could also place
additional burdens on levee systems, thus testing their structural integrity. As mentioned, many of the
State's levees are structurally deficient, and may be affected by increased intensity of storms. A shift in
the amount of precipitation is also predicted as climates shift; therefore, levee systems may have to
retain more water from storms themselves.
5.3.6 IMPACT ANAYSIS
5.3 - 225.3.6.1 SEVERITY AND WARNING TIME
Dam Failure
USACE developed the classification system shown in Table 5.3-2 for the hazard potential of dam
failures. USACE’s hazard rating system is based only on the potential consequences of a dam failure; it
does not take into account the probability of such failures. The worst-case scenario would be a failure of
one of New Jersey’s 218 high-hazard dams noted in Table 5.3-3. The result could be severe damage to
downstream communities and the potential for loss of life.
Dams can fail with little warning. Intense storms may produce a flood in a few hours or even
minutes for upstream locations. Flash floods can occur within six hours of the beginning of heavy
rainfall, and dam failure may occur within hours of the first signs of breaching. Other failures and
breaches can take much longer to occur, from days to weeks, as a result of debris jams, the
accumulation of melting snow, buildup of water pressure on a dam with deficiencies after days of
heavy rain, etc. Flooding can occur when a dam operator releases excess water downstream to relieve
pressure from the dam (FEMA, 2013d).
Warning time for dam failure varies depending on the cause of the failure. In events of extreme
precipitation or massive snowmelt, evacuations can be planned with sufficient time. In the event of a
structural failure because of earthquake, there may be no warning time. A dam’s structural type also
affects warning time. Earthen dams do not tend to fail completely or instantaneously. Once a breach
is initiated, discharging water erodes the breach until either the reservoir water is depleted or the
breach resists further erosion. Concrete gravity dams also tend to have a partial breach as one or
more monolith sections are forced apart by escaping water. The time of breach formation ranges from
a few minutes to a few hours (USACE, 1997).
High and significant hazard dam owners are required to prepare and maintain Emergency Action Plans
(EAP). The EAP is to be used in the event of a potential dam failure or uncontrolled release of stored
water. Owners are also required to have established protocols for flood warning and response to
imminent dam failure in the flood warning portion of its adopted emergency operations plan. These
protocols are tied to the emergency action plans also created by the dam owners. These documents
are customarily maintained as confidential information, although copies are required to be provided to
the NJDEP for response purposes. State and local Offices of Emergency Management also have copies of
the approved EAPs.
Levee Failure
A failure of one of the major levee systems could be devastating to the communities that are protected
by the system. As noted in Table 5.3-7, several of these systems are in disrepair, thus increasing the
probability of a failure. The worst-case scenario would involve a failure of a levee in a highly populated
area such as the levees that protect Elizabeth City or the levees in Monmouth County located along
the Raritan Bay. A flood in a populated area, such as was witnessed during Hurricane Katrina in 2005,
could strand hundreds and flood the highly populated areas in northern New Jersey.
Like dam failures, warning time depends on the cause of the failure. A levee failure caused by structural
failure can be sudden and perhaps with little to no warning. This is despite warnings regarding the
structural integrity of the system. If heavy rains are impacting a levee system, communities located in
the immediate danger zone can be evacuated before a failure occurs. If the levee failure is caused by
overtopping, the community may or may not be able to recognize the impending failure and evacuate. If
a levee failure occurs suddenly, evacuation may not be possible.
5.3.6.2 SECONDARY HAZARDS
Dam Failure
Dam failure can cause severe downstream flooding, depending on the magnitude of the failure. Other
potential secondary hazards of dam failure are landslides around the reservoir perimeter, bank erosion
5.3 - 23on the rivers, and destruction of downstream habitat. Dam failures can occur as a result of structural
failures, such as progressive erosion of an embankment or overtopping and breaching by a severe flood.
Earthquakes may weaken dams. Floods caused by dam failures have caused loss of life and property
damage (FEMA, 1996).
Levee Failure
Levee failures can cause severe downstream flooding similar to that of dam failure. Also similar to
dam failure, levee failure can cause landslides, bank erosion, and destruction of habitat. Levee
failures can also cause environmental incidents due to hazardous materials releases when
floodwaters infiltrate facilities that store these types of materials.
5.3.6.3 ENVIRONMENTAL IMPACTS
Dam and levee failure can cause severe downstream flooding and may transport large volumes of
sediment and debris, depending on the magnitude of the event. Potential secondary hazards include
landslides, bank erosion on the rivers, and destruction of downstream habitat. Dam and levee failures
may also cause the release of hazardous materials into the environment when floodwaters infiltrate
development and infrastructure. This may lead to widespread contamination resulting in costly
remediation (FEMA, 1996).
5 . 3 . 7 VU LNE R A B IL I T Y AS S E S SM E NT
Dam and levee failure inundation maps and downstream hazard areas are considered sensitive
information and are not made available to within this plan. The following discusses New Jersey’s
vulnerability to the hazard in a qualitative nature. A consequence analysis for this hazard was also
conducted and presented in Section 9 (Consequence Analysis). Impacts on the public, responders,
continuity of operations, and delivery of services; property, facilities, and infrastructure; the
environment and economic condition of the State; and the public confidence in the State’s governance
are discussed in Section 9 in accordance with Emergency Management Accreditation Program (EMAP)
standards. This section addresses assessing vulnerability and estimating potential losses by jurisdiction
and to State facilities.
5.3.7.1 ASSESSING VULNERABILITY BY JURISDICTION
Of the 21 New Jersey counties with hazard mitigation plans, 15 counties included dam/levee
failure as a hazard of concern in their hazard mitigation plans (whether as a stand-alone hazard, or
combined with the flood hazard). The decision to include and profile this hazard in their mitigation
plans indicates county awareness of the presence of risk from dam/levee failure in their county. Of
these 17, the three counties that categorized hazards into high/medium/low rankings indicated the
following: Essex (medium/high); Monmouth (low); and Somerset (high). If dam and levee failure were
not ranked by a local HMP, the jurisdictions identified their most significant hazards using other
methods.
All assets located in a dam failure inundation zone could be exposed to the risk of a dam failure. The
potential for loss of life is affected by the capacity and number of evacuation routes available to
populations living in areas of potential inundation. Vulnerable populations are all populations
downstream from dam failures that are incapable of escaping the area within the needed timeframe.
This population includes the elderly and young who may be unable to get themselves out of the
inundation area. Economically disadvantaged populations are more vulnerable because they are likely to
evaluate their risk and make decisions to evacuate based on the net economic impact to their family.
The population over the age of 65 is also highly vulnerable because they are more likely to seek or need
medical attention, which may not be available because of isolation during a flood event and difficulties
in evacuating.
5.3 - 24You can also read