De novo assembly and characterization of the first draft genome of quince (Cydonia oblonga Mill.) - Nature
←
→
Page content transcription
If your browser does not render page correctly, please read the page content below
www.nature.com/scientificreports
OPEN De novo assembly
and characterization of the first
draft genome of quince (Cydonia
oblonga Mill.)
Aysenur Soyturk1, Fatima Sen2, Ali Tevfik Uncu1, Ibrahim Celik3 & Ayse Ozgur Uncu 2*
Quince (Cydonia oblonga Mill.) is the sole member of the genus Cydonia in the Rosacea family and
closely related to the major pome fruits, apple (Malus domestica Borkh.) and pear (Pyrus communis
L.). In the present work, whole genome shotgun paired-end sequencing was employed in order to
assemble the first draft genome of quince. A genome assembly that spans 488.4 Mb of sequence
corresponding to 71.2% of the estimated genome size (686 Mb) was produced in the study. Gene
predictions via ab initio and homology-based sequence annotation strategies resulted in the
identification of 25,428 and 30,684 unique putative protein coding genes, respectively. 97.4 and 95.6%
of putative homologs of Arabidopsis and rice transcription factors were identified in the ab initio
predicted genic sequences. Different machine learning algorithms were tested for classifying pre-
miRNA (precursor microRNA) coding sequences, identifying Support Vector Machine (SVM) as the
best performing classifier. SVM classification predicted 600 putative pre-miRNA coding loci. Repetitive
DNA content of the assembly was also characterized. The first draft assembly of the quince genome
produced in this work would constitute a foundation for functional genomic research in quince toward
dissecting the genetic basis of important traits and performing genomics-assisted breeding.
Cydonia is a monospecific genus in the Rosaceae family with quince (Cydonia oblonga Mill.) (2n = 2x = 34) identi-
fied as the sole species within the g enus1,2. Quince is a deciduous small tree, usually growing to a height of less
than 5 m3. Cydonia genus was named after the Kydonia region at the northwestern coast of Crete, Greece, where
quince has long been c ultivated4. Caucasus region is the probable center of origin for quince and domestication
of the plant dates back to 5000 BC. Quince was introduced to Greece and the Roman Empire around 600 and
200 BC, respectively. The tree arrived at the Americas from Europe in seventeenth century A D2. C. oblonga is
classified in the apple tribe (Maleae), which includes several widely cultivated members such as apples (Malus
Mill.), pears (Pyrus L.), serviceberries (Amelanchier Medik.), chokeberries (Aronia Medik.) and loquats (Eriobot-
rya Lindl.)5,6. Maleae members share the common basic chromosome number of x = 17 except the Vauquelinia
genus (x = 15)6.
Most of the quince fruit production is for the food industry as the fruits are used for producing marmalades,
jams, sweets, liqueurs and aromatic d istillates7. Quince is also recognized as a cheap and rich source of health-
beneficial secondary metabolites. Leaf infusions/decoctions have long been used as a herbal remedy and the
fruit is a proposed source for extracting health-promoting phytochemicals for pharmaceutical and nutraceutical
applications7. Besides cultivation for fruit production, the primary importance of quince tree is its utilization
as a dwarfing rootstock for pear cultivation3. Quince rootstocks limit tree size for easy harvest, and improve
productivity and fruit quality2,4,8. For example, ‘Quince A’ is a well-known, commercially propagated rootstock
for pear p roduction3,8.
There is a limited number of molecular genetic studies conducted on quince. Accordingly, a search that covers
all NCBI databases returns only 272 and 129 entries labeled as ‘Cydonia oblonga’ in ‘Nucleotide’ and ‘Gene’ data-
bases, respectively (https: //www.ncbi.nlm.nih.gov/search /all/?term=cydoni a%20oblo
nga; Access date: December
2020). In contrast, genome sequences are available for apple and pear, the two related pome fruit s pecies9–11.
Due to the lack of quince genomic resources, molecular genetic studies on quince are mostly dedicated on
1
Department of Molecular Biology and Genetics, Necmettin Erbakan University, Meram, Konya 42090,
Turkey. 2Department of Biotechnology, Necmettin Erbakan University, Meram, Konya 42090, Turkey. 3Department
of Agricultural and Livestock Production, Pamukkale University, Denizli 20700, Turkey. *email: auncu@
erbakan.edu.tr
Scientific Reports | (2021) 11:3818 | https://doi.org/10.1038/s41598-021-83113-3 1
Vol.:(0123456789)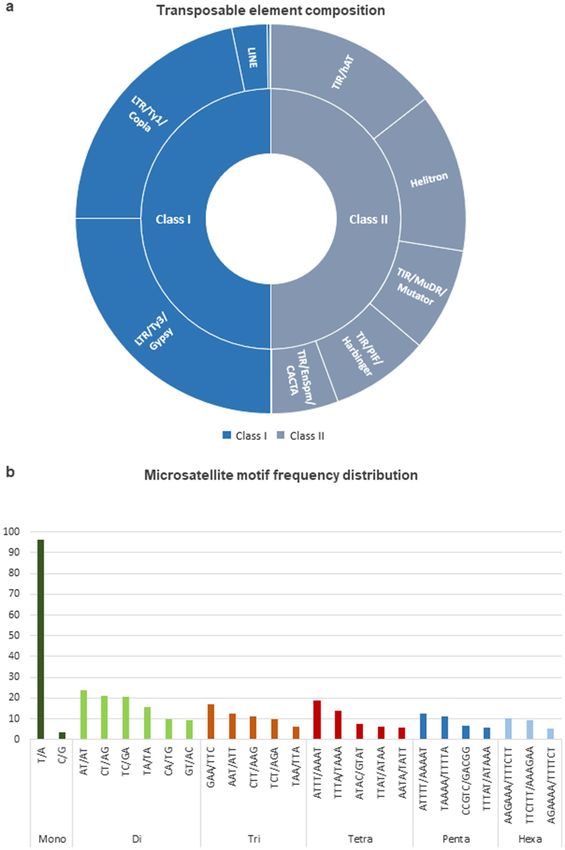
www.nature.com/scientificreports/
germplasm characterization with transferable molecular genetic tools, namely SSR (simple sequence repeat)
markers developed for apple and/or pear genomes8,12–14. In other work, generic, random marker systems includ-
ing ISSR (inter simple sequence repeat)4, RAPD (random amplified polymorphic DNA)15 and AFLP (amplified
fragment length polymorphism)16 were utilized for the molecular genetic characterization of quince collections.
Genome assemblies provide the foundation for further extensive molecular genetic research in agriculturally
relevant species. In the present work, a draft genome assembly of quince was produced for the first time using
whole genome shotgun paired-end sequencing. Assembly characterization was performed by ab initio and
homology-based gene predictions, as well as microRNA coding loci identification employing machine-learned
classification. Repetitive portion of the assembly was characterized by the analyses of transposable element
content and microsatellite composition.
Materials and methods
DNA isolation, sequencing and sequence pre‑processing. DNA was extracted from leaf tissue of C.
oblonga rootstock clone ‘Quince A’ using a modified CTAB protocol17 as follows: 200 mg liquid nitrogen frozen,
ground leaf tissue was mixed with 800 μL of CTAB extraction buffer [100 mM Tris–HCl (pH 8.0), 20 mM EDTA
(pH 8.0), 1.4 M NaCl, 2% (w/v) CTAB, 1% PVP] and 5 μL of RNase A (0.01 mg/μL), and incubated at 65 °C for
1 h. Lysed sample was mixed with 600 μL of chloroform:isoamyl alcohol (24:1) and centrifuged at 20,900×g for
10 min. The supernatant phase was incubated with 200 μL of isopropanol at 4 °C for 1 h for DNA precipitation.
DNA pellet was collected by centrifugation at 4 °C for 10 min at 20,900×g, washed with 100 μL of 70% ethanol
and re-suspended in 100 μL of Tris–EDTA buffer (pH 8.0).
Paired-end sequencing was provided by Macrogen NGS Service (Macrogen Inc., Korea) using an Illumina
NovaSeq 6000 platform. A paired-end sequencing library of median insert size of 450 bp was prepared using a
TruSeq DNA PCR-Free kit according to TruSeq DNA PCR-Free Sample Preparation Guide prior to sequencing.
Reads of 151 bp length were obtained as a result of paired-end sequencing. Data were filtered for reads that pass
the Q30 score (92.77% of the total reads) and barcode adapters were trimmed using FASTX-Toolkit version
0.0.13 (http://hannonlab.cshl.edu/fastx_toolkit/index.html).
Sequence assembly and quality evaluation. Short reads were assembled using SOAPdenovo2 ver-
sion 2.0418 with a k-mer length of 127 and filtered for a minimum read length of 500 bp. Assembly complete-
ness based on gene content was assessed using the BUSCO (Benchmarking Universal Single-Copy Orthologs)
pipeline19. The lineage dataset used was eudicots_odb10 (Creation date: 2019-11-20, number of species: 31,
number of BUSCOs: 2326). Contigs that represent the plastid genome were aligned to the C. oblonga plastid
genome assembly (GenBank Accession: NC_045415.1).
Gene prediction and functional annotation. Gene prediction was performed using both ab initio and
homology-based strategies. Ab initio gene prediction was performed using the AUGUSTUS gene prediction
server20 via the OmicsBox version 1.3 platform (https://www.biobam.com/omicsbox/). Assembled C. oblonga
genome sequences were used as the input for ab initio annotation process. Repeat Masking application via
RepeatMasker Open-4.021 under the Genome Analysis module of OmicsBox was run prior to gene prediction.
Functional annotation was performed using the output file of the ab initio gene prediction process. Accordingly,
the UniProt collection of apple (Malus domestica Borkh.) protein sequences (45,359 sequences) (https://www.
uniprot.org/uniprot/?query=malus+domestica&sort=score; Access date: September 2020) and plant transcrip-
tion factor database (PlnTFDB version 3.0)22 were used to create local databases for running blastp searches. The
E-value threshold used was 1E−10. GO mapping was performed on the output data and GO terms were assigned
to the predicted genes with the subsequent GO annotation process. Homology-based gene prediction was also
performed with an E-value threshold of 1E−10 based on M. domestica proteins using the genome assembly file
as the input and the UniProt collection of M. domestica protein sequences as the local database.
miRNA coding loci identification. Ab initio pre-miRNA (precursor microRNA) detection employing
a machine learning algorithm and homology-based pre-miRNA search were used in combination to predict
pre-miRNA coding loci in C. oblonga genome assembly. Toward this aim, 7579 plant pre-miRNA sequences
available on miRbase (Release 22.1)23 were downloaded and used for training and testing classifiers. Alongside
the positive pre-miRNA dataset, a negative training and testing sample set was used that consisted of plant
protein coding sequences. Pre-miRNAs and the negative sequence dataset were parameterized using k-mer
(k = 4) method24. Frequency of each k-mer in the input sequence was detected and used to create a matrix as
the parameterized version of the biological sequences. k-mers with unambiguous base calls (N, R, Y, S, W, etc.)
were filtered out from the data. Datasets were split into training (70%) and testing data (30%) for training clas-
sifiers and evaluating their performance. Random forest (RF), Support Vector Machine (SVM), Naïve Bayes
(NB), XGBoost, K-Nearest Neighbors (KNN) classifiers were trained and tested for their performance using the
metrics of precision, accuracy, recall (sensitivity) and F-measure according to the following Eqs. (1–4) (TP, true
positive; FP, false positive; TN, true negative; FN, false negative)25:
TP
Precision = (1)
TP + FP
TP + TN
Accuracy = (2)
TP + TN + FN + FP
Scientific Reports | (2021) 11:3818 | https://doi.org/10.1038/s41598-021-83113-3 2
Vol:.(1234567890)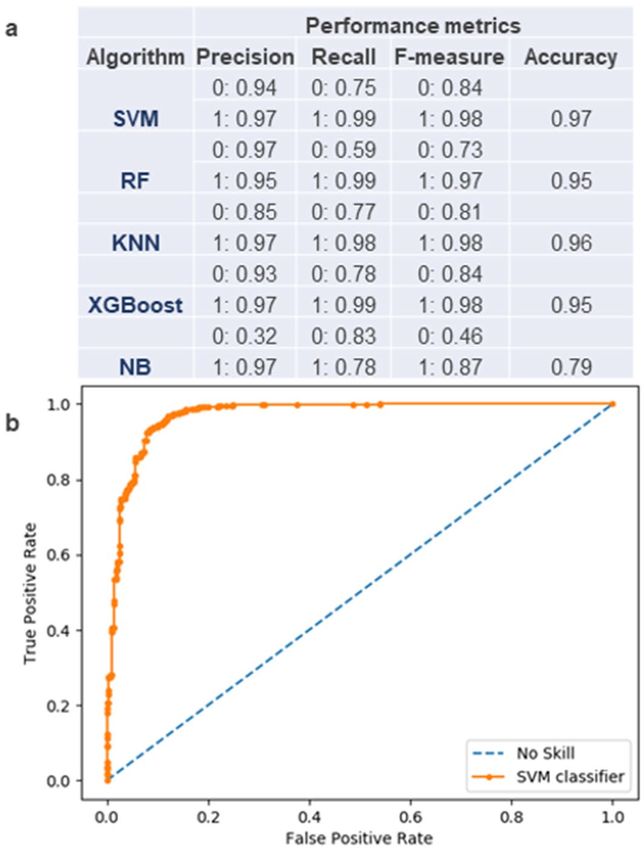
www.nature.com/scientificreports/
Raw data and assembly statistics
Number of reads 494,494,378
Number of read bases (bp) 74,668,651,078
GC content (%) 38.66
AT content (%) 61.34
Q20 (%) 97.14
Q30 (%) 92.77
Read coverage 108x
Number of contigs 303,932
Min. contig length (bp) 500
Max. contig length (bp) 53,821
N50 value (bp) 2435
Total assembly length (bp) 488,422,409
Total number of BUSCOs 1312
Complete BUSCOs 1024
Fragmented BUSCOs 288
Table 1. Sequencing and assembly statistics.
TP
Recall = (3)
TP + FN
precision ∗ recall
F measure = 2 ∗ (4)
precision + recall
SVM was the best performing machine-learned model for pre-miRNA prediction and used for the de novo
identification of putative miRNA coding loci in the assembly. The trained SVM classifier was run on Scikit-learn
0.23.2 library26 in order to scan the assembly with a predefined sliding window of 70 nucleotides. The output of
SVM classification was used for the homology search with plant pre-miRNA sequences deposited in miRBase
(7579 sequences). The E-value threshold used for the homology search was 1E−10 with a word size of 7.
Characterization of transposable elements (TEs) and microsatellite composition. Domain
Based Annotation of Transposable Elements (DANTE) was performed via the RepeatExplorer server27 (Access
date: September 2020) for the identification and characterization of the transposable element content by domain
search and subsequent phylogenetic annotation and classification. Microsatellite composition was analyzed
using GMATA version 2.01 (Genome-wide Microsatellite Analyzing Tool Package)28. Mononucleotide repeat
loci of minimum 10 bases and 2–6 nucleotide microsatellite motifs of min. 5 repeats were mined in the assembly.
Results and discussion
Genome assembly and quality evaluation. Paired-end sequencing produced 494.5 million reads of
151 bp length. The total size of the raw sequence reads was 74.7 Gb. Sequence Read Archive (SRA) files are
deposited at GenBank under the BioProject PRJNA675337. Relative GC and AT content of the sequence reads
was 38.7 and 61.3%, respectively. Ratio of bases with phred quality score over 20 (Q20) was 97.1% and the ratio
with quality score over 30 (Q30) was 92.8% (Table 1). Assembly of the barcode-trimmed reads that pass the Q30
filter produced 303,932 contigs larger than 500 bp. The total size of the assembly was 488.4 Mb, corresponding
to 71.2% of the C. oblonga genome size (686 Mb) estimated by flow cytometry29. N50 value of the assembly was
calculated as 2.4 kb and the maximum contig size was 53.8 kb (Table 1). Assembly files are deposited at GenBank
under the accession JADOBS000000000.
Searching BUSCO sets enables the quantitative assessment of genome completeness using an evolutionary
measure, informed expectation of orthologous gene c ontent19. Assessing the assembly completeness via BUSCO
identified 1312 BUSCOs (81.2%) out of 1614 BUSCO groups of the Embryophyta database. 1024 of the identified
BUSCOs were complete BUSCOs, 869 of which were complete single-copy and 155 were complete duplicated
orthologs. 288 out of 1312 BUSCOs were fragmented. The number of missing BUSCOs in the genome assembly
was 302 (18.8%). Complete list of BUSCO IDs, identification status of each ID, gene locations in the assembly
and gene descriptions are provided as Supplementary Table S1.
Functional annotation of protein coding gene content. Ab initio gene prediction based on a gener-
alized hidden Markov model combining signal and content sensors20 produced gene sequence predictions. Gene
features file describing genes and gene features in assembly contigs can be accessed at https://doi.org/10.6084/
m9.figshare.13538942. Predicted genic sequences were further matched with annotated M. domestica proteins,
corresponding to 25,428 unique UniProt IDs (Supplementary Table S2). Direct homology-based annotation was
also performed in addition to ab initio gene prediction, and identified 30,684 putative genes based on homol-
ogy with M. domestica proteins (Supplementary Table S3). As a result of GO (gene ontology) mapping and
Scientific Reports | (2021) 11:3818 | https://doi.org/10.1038/s41598-021-83113-3 3
Vol.:(0123456789)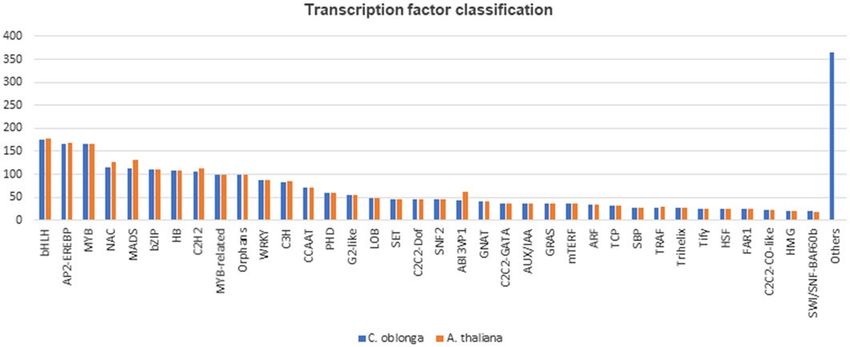
www.nature.com/scientificreports/
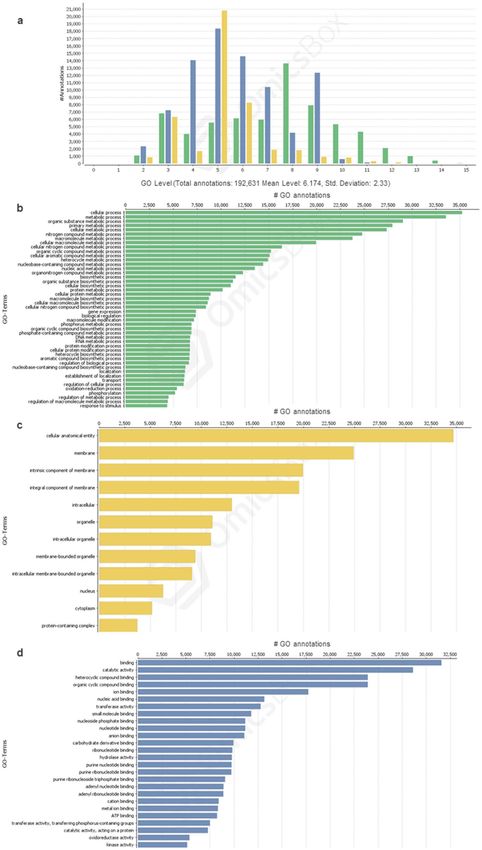
Figure 1. Distribution of GO annotation levels and sequence GO term assignments. (a) GO level distribution
of the annotations assigned to the three categories, biological process (BP), cellular component (CC) and
molecular function (MF). Green, yellow and blue represent BP, CC and MF categories, respectively. (b)
Distribution of annotations according to GO terms assigned to the BP category. (c) Distribution of annotations
according to GO terms assigned to the CC category. (d) Distribution of annotations according to GO terms
assigned to the MF category.
Scientific Reports | (2021) 11:3818 | https://doi.org/10.1038/s41598-021-83113-3 4
Vol:.(1234567890)www.nature.com/scientificreports/
Figure 2. Distribution of C. oblonga transcription factors (TFs) based on plant TF families. C. oblonga TF
distribution is displayed with respect to the distribution of Arabidopsis homologs. x-axis displays TF families
and y-axis displays number of TF assignments to families. TF families with less than 20 representations in the
set of identified C. oblonga TFs are included in the ‘Others’ class.
Figure 3. Performance evaluation of machine-learning algorithms for pre-miRNA identification. (a)
Performance metrics are provided for the five tested algorithms: SVM, Support Vector Machine; RF, Random
forest; KNN, K-Nearest Neighbors; XGBoost and NB, Naïve Bayes. Precision, Recall and F-measure values are
calculated for classifying negative (0) and positive (1) test data to expected classes. (b) ROC (receiver operating
characteristic) curve for the trained SVM classifier.
annotation of ab initio predicted genic sequences, a total of 192,631 GO annotations were obtained for the three
categories, biological process (BP), cellular component (CC) and molecular function (MF) at a mean level of
6.2 (Fig. 1a). The highest number of GO term assignments was obtained for ‘cellular process’ in the BP category
(Fig. 1b). ‘cellular and anatomical entity’ was the top GO term for the CC category and ‘binding’ was the top
molecular function according to the number of identified GO terms in the MF category (Fig. 1c,d). Sub catego-
rization of the top GO terms at level 3 is provided as Supplementary Fig. S1.
Scientific Reports | (2021) 11:3818 | https://doi.org/10.1038/s41598-021-83113-3 5
Vol.:(0123456789)www.nature.com/scientificreports/
Homologous miRNAa Probabilityb E-valuec
mdm-MIR10978a 0.9954324 1.00E−20
mdm-MIR10979 0.99519524 6.00E−29
mdm-MIR10981a 0.99531038 1.00E−11
mdm-MIR10981b 0.99699497 9.00E−13
mdm-MIR10981c 0.99998466 1.00E−11
mdm-MIR10981d 0.9952244 4.00E−11
mdm-MIR10982c 0.99562967 1.00E−21
mdm-MIR10985 0.99575234 2.00E−23
mdm-MIR10990 0.99624388 2.00E−14
mdm-MIR10991e 0.99572793 9.00E−13
mdm-MIR10993a 0.99548501 2.00E−13
mdm-MIR10993b 0.99591172 1.00E−11
mdm-MIR10993f. 0.99683035 2.00E−13
mdm-MIR10995 0.99678045 2.00E−14
mdm-MIR11000 0.99545193 2.00E−13
mdm-MIR11002a 0.99541374 2.00E−19
mdm-MIR11006 0.99526081 1.00E−11
mdm-MIR11007 0.99557012 4.00E−11
mdm-MIR11008 0.99528467 4.00E−16
mdm-MIR11009 0.99734578 1.00E−15
mdm-MIR11014 0.99552524 1.00E−11
mdm-MIR11015 0.99547712 4.00E−11
mdm-MIR159d 0.9961144 1.00E−25
mdm-MIR164d 0.99998259 4.00E−11
mdm-MIR3627c 0.99623606 9.00E−13
mdm-MIR3627d 0.99520933 4.00E−16
mdm-MIR396f. 0.9951471 2.00E−13
mdm-MIR399b 0.99565726 1.00E−15
pla-MIR11602 0.99565912 4.00E−26
vvi-MIR171a 0.99652471 4.00E−11
vvi-MIR171g 0.99608369 5.00E−15
gma-MIR5032 0.99616243 4.00E−16
gma-MIR5368 0.99628882 5.00E−15
Table 2. Results of miRNA prediction with the combined approach of SVM classification and homology-
based identification. a pre-miRNA records from miRBase. mdm: Malus domestica; pla: Paeonia lactiflora; vvi:
Vitis vinifera; gma: Glycine max. b Trained SVM classifier probability value. c E-value threshold applied for the
BLAST analysis.
Transcription factors (TFs) have pivotal functions in almost all plant biological processes from seed germina-
tion to stress responses, therefore, play important roles in plant evolution and domestication30. A specific search
for transcription factors in the ab initio predicted genic sequences was performed using the plant transcription
factor database (PlnTFDB)22. The results were filtered for two species, Arabidopsis thaliana L. and Oryza sativa
L. ssp. japonica. Arabidopsis and rice were specifically selected for defining the transcription factor composition
in the assembly since they are the basic model species for eudicot and monocot genomics with well-annotated
genomes and parallel expansion of TF orthologous groups in the two species has already been demonstrated31.
PlnTFDB search identified 2686 of the 2757 annotated Arabidopsis TFs and 2981 out of 3119 annotated rice TFs
in the assembly. Thus, 97.4 and 95.6% of the putative homologs of Arabidopsis and rice TFs were found to be
present in the assembly. Putative homologs of the three largest TF families, bHLH (basic helix-loop-helix), MYB
and AP2-EREBP (APETALA2-ethylene responsive element binding protein) were almost completely identified
in the assembly with 175/177 bHLH, 166/166 MYB and 166/168 AP2-EREBP homologies (Fig. 2). The complete
list of identified putative TF homologs is provided as Supplementary Table S4.
Prediction of miRNA coding loci. MicroRNAs regulate gene expression post-transcriptionally, play-
ing crucial roles in plant development and stress responses. Therefore, during the last two decades, much
effort has been devoted to miRNA identification32. The conventional miRNA identification route that relies
on RNA sequencing can be biased toward abundant transcripts in addition to the dependence on tissue and
developmental stage33,34. Thus, it is challenging to detect miRNAs that are constitutively expressed at low lev-
els or expressed at specific tissues at very narrow time intervals33. Ab initio/de novo miRNA detection using
Scientific Reports | (2021) 11:3818 | https://doi.org/10.1038/s41598-021-83113-3 6
Vol:.(1234567890)www.nature.com/scientificreports/
Abundance in the assembly Frequency in total TEs Frequency in defined class
Class I
LTR/Ty3/Gypsy 48,178 46.01 50.11
LTR/Ty1/Copia 41,781 39.9 43.45
LINE 5594 5.34 5.82
Pararetrovirus 453 0.43 0.47
Unclassified 147 0.14 0.15
Class II
Helitron 2224 2.12 26.34
TIR/hAT 2446 2.34 28.97
TIR/MuDR/Mutator 1452 1.39 17.2
TIR/PIF/Harbinger 1377 1.32 16.3
TIR/EnSpm/CACTA 931 0.89 11.03
TIR/Novosib 8 0.01 0.09
TIR/unclassified 6 0.01 0.07
Ambiguous 113 0.1
Table 3. TE composition in C. oblonga genome assembly.
genome scale sequences circumvents these problems and has proved successful in identifying pre-miRNAs in
plant genomes24,33,35,36. As a result of related work, Support Vector Machine (SVM) has been reported as an
effective machine-learned classifier to locate pre-miRNA coding loci in genome scale sequences33,35,37. In the
present work, five different machine-learning algorithms (SVM, RF, KNN, XGBoost and NB) were trained and
tested for their performance in predicting pre-miRNA coding genomic sequences. SVM was the best perform-
ing algorithm according to the applied performance metrics of accuracy, and F-measure (includes precision and
recall measures) (Fig. 3a). The ROC (receiver operating characteristic) curve for the trained SVM classifier is
provided as Fig. 3b. According to the results of the classifier performance test, the C. oblonga genome assembly
was scanned with the trained SVM classifier, resulting in the identification of 600 putative pre-miRNA coding
loci (Supplementary Table S5). The subsequent homology search using the SVM predicted loci as the query and
the miRBase record of plant pre-miRNAs as the database, identified 33 matches including 28 pre-miRNAs from
M. domestica, two from Glycine max, two from Vitis vinifera and 1 pre-miRNA from Paeonia lactiflora (Table 2).
Transposable element and microsatellite composition of the C. oblonga genome. TEs actively
contribute to eukaryotic genome evolution38 and often modify peripheral gene expression via altered epigenetic
marks. Such transposon induced gene expression patterns may directly be involved in the natural and/or artifi-
cial selection of certain advantageous genotypes in plant species. For example, red skin color in apple is subject
to both natural and artificial selection and, a recent study associates the trait with a LTR (long terminal repeat)
retrotransposon insertion upstream of the MdMYB1 gene, which is a core transcriptional regulator of the antho-
cyanin biosynthesis pathway11. In the present work, the TE composition of the C. oblonga genome assembly
was characterized using a domain-based approach which includes domain search followed by phylogenetic TE
annotation and classification. As a result, 104,710 TEs were identified including 96,153 Class I and 8444 Class II
elements (Table 3). Thus, the vast majority of TEs were retrotransposons, constituting 91.8% of the total number
of TEs identified in the C. oblonga genome assembly. Most of the Class I elements were classified either as LTR/
Ty3/Gypsy or LTR/Ty1/Copia elements (Fig. 4a) and constituted 93.6% of the total retrotransposon content.
LTR superfamily transposons are the predominant TE type in many plant genomes9–11,39–44 and according to
our TE composition analysis, quince genome is no exception with 85.9% of the total TE content identified as
LTRs (Table 3). Class II elements constituted 8.1% of the total number of identified TEs. Helitrons and hAT
superfamily transposons were the two most abundant DNA transposons, representing 26.3 and 29% of the Class
II transposable elements. Out of the 104,710 TEs identified in the assembly, 113 loci (0.1%) were classified as
‘ambiguous’ since their phylogenetic assignment could not be inferred (Table 3). Detailed information on the
identified TEs including the subfamily assignments is provided as Supplementary Table S6.
Quince genome assembly was also characterized for microsatellite composition. Search parameters were
applied to identify mononucleotide repeats and tandem repeats of 2-to-6 nucleotides. As a result, a total of
308,171 microsatellite loci were identified in the assembly, corresponding to an overall density of 1.6 kb/micro-
satellite interval. Microsatellite motifs and positions in the assembly are provided as Supplementary Table S7.
171,414 of the identified loci were mononucleotide repeats and 136,757 loci were repeats of 2-to-6 nucleotide
motifs (Table 4). Similar to the results of the microsatellite search in the quince genome, mononucleotide repeats
appear as the most abundant repeat type in several plant genomes in case they are included in repeat mining
analyses45,46. Stretches of A/T repeats predominated in the mononucleotide repeats, constituting 96.4% of the
total number of identified mononucleotide microsatellites (Fig. 4b). Dinucleotide repeats (117,091 loci) were the
most abundant microsatellite type in the pool of 2-to-6 nucleotide microsatellites (Table 4). The most frequent
dinucleotide motif was AT (27,583 loci), representing 23.6% of the total number of dinucleotide microsatellites
(Fig. 4b). Overall, AT-rich repeats predominated in C. oblonga genomic microsatellites (Fig. 4b). These results
Scientific Reports | (2021) 11:3818 | https://doi.org/10.1038/s41598-021-83113-3 7
Vol.:(0123456789)www.nature.com/scientificreports/
Figure 4. Repetitive DNA composition in the C. oblonga genome assembly. (a) Transposable element (TE)
families are displayed in the doughnut chart according to their relative abundances in the assigned classes (Class
I/II). Class I and Class II are not scaled to their relative occurrences in the C. oblonga genome, the abundances of
TE families adding up to 100% for each class (Class I/II). TE families constituting less than 1% of either class is
not displayed in the chart. (b) Microsatellite motif distribution is presented with respect to motif length. x-axis
displays motifs that constitute more than 5% of the relevant motif type. y-axis displays percentage abundance of
each motif.
Scientific Reports | (2021) 11:3818 | https://doi.org/10.1038/s41598-021-83113-3 8
Vol:.(1234567890)www.nature.com/scientificreports/
Motif length Number of occurences Frequency (%)
Mononucleotide 171,414 55.62
Dinucleotide 117,091 38
Trinucleotide 15,268 4.95
Tetranucleotide 3081 1
Pentanucleotide 833 0.27
Hexanucleotide 484 0.16
Total 308,171 100
Table 4. Microsatellite abundance in C. oblonga genome assembly.
were consistent with work where overall microsatellite composition of the closely related apple genome was
characterized47.
Conclusion
Quince is a neglected member of the Rosaceae family in terms of genomic studies. The species is closely related
to the major pome fruits, apple (M. domestica) and pear (P. communis). Quince fruits are processed to different
food products, liqueurs and aromatic distillates and, quince tree is a common rootstock for pear production. Yet,
genomic research in quince has lagged far behind other pome fruit species. As a result of the present study, the
first draft genome of quince was assembled from whole genome shotgun paired-end reads. Gene content was
characterized by ab initio and homology-based gene predictions. Machine-learned classification methods were
tested and applied for pre-miRNA coding loci predictions. Our results identified SVM as an appropriate machine-
learning algorithm for de novo genomic pre-miRNA coding loci prediction. Transposable element content was
characterized with a domain-based search and phylogenetic classification approach, identifying a very similar
transposon composition with the closely related and well-characterized apple genome. Microsatellite content of
the genome assembly was also analyzed and reported. Data produced in the present work provide insights into
the quince genome for the first time and constitute a basis for further functional genomic research in quince.
Data availability
This Whole Genome Shotgun project has been deposited at DDBJ/ENA/GenBank under the accession
JADOBS000000000, BioProject PRJNA675337. Sequence Read Archive (SRA) files have been deposited under
the same BioProject (PRJNA675337). Gene features file describing the de novo predicted genes in gff format can
be accessed at https://doi.org/10.6084/m9.figshare.13538942. Assembly characterization data generated during
this study are included in this published article as Supplementary Information files.
Received: 7 December 2020; Accepted: 28 January 2021
References
1. Löve, A. IOBP chromosome number reports LIII. Taxon 25(4), 483–500 (1976).
2. Abdollahi, H. A review on history, domestication and germplasm collections of quince (Cydonia oblonga Mill.) in the World. Genet.
Resour. Crop Evol. 66, 1041–1058 (2019).
3. Duron, M., Decourtye, L. & Druart, P. Quince (Cydonia oblonga Mill.). In Trees II Biotechnology in Agriculture and Forestry Vol.
5 (ed. Bajaj, Y. P. S.) 42–58 (Springer, Berlin, 1989).
4. Ganopoulos, I., Merkouropoulos, G., Pantazis, S., Tsipouridis, C. & Tsaftaris, A. Assessing molecular and morpho-agronomical
diversity and identification of ISSR markers associated with fruit traits in quince (Cydonia oblonga). Genet. Mol. Res. 10(4),
2729–2746 (2011).
5. Lo, E. Y. Y. & Donoghue, M. J. Expanded phylogenetic and dating analyses of the apples and their relatives (Pyreae, Rosaceae).
Mol. Phylogenet. Evol. 63, 230–243 (2012).
6. Liu, B. B., Campbell, C. S., Hong, D. Y. & Wen, J. Phylogenetic relationships and chloroplast capture in the Amelanchier-Malacome-
les-Peraphyllum clade (Maleae, Rosaceae): Evidence from chloroplast genome and nuclear ribosomal DNA data using genome
skimming. Mol. Phylogenet. Evol. 147, 106784 (2020).
7. Sut, S., Dall’Acqua, S., Poloniato, G., Maggi, F. & Malagoli, M. Preliminary evaluation of quince (Cydonia oblonga Mill.) fruit
as extraction source of antioxidant phytoconstituents for nutraceutical and functional food applications. J. Sci. Food Agric. 99,
1046–1054 (2018).
8. Dumanoglu, H. et al. Analysis of clonal variations in cultivated quince (Cydonia oblonga ‘Kalecik’) based on fruit characteristics
and SSR markers. N. Z. J. Crop Hortic. Sci. 37(2), 113–120 (2009).
9. Chagné, D. et al. The draft genome sequence of European pear (Pyrus communis L. ‘Bartlett’). PLoS ONE 9(4), e92644 (2014).
10. Daccord, N. et al. High quality de novo genome assembly of the apple genome and methylome dynamics of early fruit development.
Nat. Genet. 49, 1099–1106 (2017).
11. Zhang, L. et al. A high-quality apple genome assembly reveals the association of a retrotransposon and red fruit colour. Nat. Com-
mun. 10, 1–13 (2019).
12. Yamamoto, T. et al. Identification of quince varieties using SSR markers developed from pear and apple. Breed. Sci. 54(3), 239–244
(2004).
13. Halász, J. et al. Characterization of quince (Cydonia oblonga Mill.) cultivars using SSR markers developed for apple. Int. J. Hortic.
Sci. 15(4), 7–10 (2009).
14. Güney, M. et al. Characterization of quince (Cydonia oblonga Mill.) accessions by simple sequence repeat markers. Turk. J. Agric.
For. 43, 69–79 (2019).
Scientific Reports | (2021) 11:3818 | https://doi.org/10.1038/s41598-021-83113-3 9
Vol.:(0123456789)www.nature.com/scientificreports/
15. Orhan, E., Nardemir, G., Agar, G. & Ercisli, S. Genetic variation among quince (Cydonia oblonga Mill.) genotypes sampled from
the Coruh valley in Turkey. Genet. Mol. Res. 13(1), 445–449 (2014).
16. Topcu, H., Kafkas, S., Dogan, A., Akcay, M. E. & Ercisli, S. Genetic relatedness among quince (Cydonia oblonga Miller) accessions
from Turkey using amplified fragment length polymorphisms. J. Appl. Bot. Food Qual. 88, 197–201 (2015).
17. Doyle, J. J. & Doyle, J. L. Isolation of plant DNA from fresh tissue. Focus 12, 13–15 (1990).
18. Luo, R. et al. SOAPdenovo2: An empirically improved memory-efficient short-read de novo assembler. Gigascience 1(1), 2047–2217
(2012).
19. Simão, F. A., Waterhouse, R. M., Ioannidis, P., Kriventseva, E. V. & Zdobnov, E. M. BUSCO: Assessing genome assembly and
annotation completeness with single-copy orthologs. Bioinformatics 31(19), 3210–3212 (2015).
20. Stanke, M. & Morgenstern, B. AUGUSTUS: A web server for gene prediction in eukaryotes that allows user-defined constraints.
Nucleic Acids Res. 33, 465–467 (2005).
21. Smit, A. F. A., Hubley, R. & Green, P. RepeatMasker Open-4.0. http://repeatmasker.org/ (2018).
22. Perez-Rodriguez, P. et al. PlnTFDB: Updated content and new features of the plant transcription factor database. Nucleic Acids
Res. 38(suppl_1), D8222–D8827 (2010).
23. Kozomara, A. & Griffiths-Jones, S. miRBase: Integrating microRNA annotation and deep-sequencing data. Nucleic Acids Res. 39,
D152-157 (2011).
24. Yousef, M., Khalifa, W., Acar, İH. & Allmer, J. MicroRNA categorization using sequence motifs and k-mers. BMC Bioinform. 18,
170 (2017).
25. Matthews, B. W. Comparison of the predicted and observed secondary structure of T4 phage lysozyme. Biochim. Biophys. Acta
Protein Struct. 405(2), 442–451 (1975).
26. Pedregosa, F. et al. Scikit-learn: Machine learning in Python. J. Mach. Learn. Res. 12, 2825–2830 (2011).
27. Novák, P., Neumann, P., Pech, J., Steinhaisl, J. & Macas, J. RepeatExplorer: A galaxy-based web server for genome-wide charac-
terization of eukaryotic repetitive elements from next-generation sequence reads. Bioinformatics 29, 792–793 (2013).
28. Wang, X. & Wang, L. GMATA: An integrated software package for genome-scale SSR mining, marker development and viewing.
Front. Plant Sci. 7, 1350 (2016).
29. Dickson, E. E., Arumuganathan, K., Kresovich, S. & Doyle, J. J. Nuclear DNA content variation within the Rosaceae. Am. J. Bot.
79(9), 1081–1086 (1992).
30. Riaño-Pachón, D. M., Ruzicic, S., Dreyer, I. & Mueller-Roeber, B. PlnTFDB: An integrative plant transcription factor database.
BMC Bioinform. 8, 42 (2007).
31. Shiu, S. H., Shih, M. C. & Li, W. H. Transcription factor families have much higher expansion rates in plants than in animals. Plant
Physiol. 139, 18–26 (2005).
32. Guo, Z. et al. PmiREN: A comprehensive encyclopedia of plant miRNAs. Nucleic Acids Res. 48, D1114–D1121 (2020).
33. Ng, K. L. S. & De Mishra, S. K. novo SVM classification of precursor microRNAs from genomic pseudo hairpins using global and
intrinsic folding measures. Bioinformatics 23(11), 1321–1330 (2007).
34. Kaur, P. & Gaikwad, K. From genomes to GENE-omes: Exome sequencing concept and applications in crop improvement. Front.
Plant Sci. 8, 2164 (2017).
35. Meng, J., Liu, D., Sun, C. & Luan, Y. Prediction of plant pre-microRNAs and their microRNAs in genome-scale sequences using
structure-sequence features and support vector machine. BMC Bioinform. 15, 423 (2014).
36. Fu, X. et al. Improved pre-miRNAs identification through mutual information of pre-miRNA sequences and structures. Front.
Genet. 10, 119 (2019).
37. Wu, Y., Wei, B., Liu, H., Li, T. & Rayner, S. MiRPara: A SVM-based software tool for prediction of most probable microRNA coding
regions in genome scale sequences. BMC Bioinform. 12, 107 (2011).
38. Lisch, D. How important are transposons for plant evolution?. Nat. Rev. Genet. 14, 49–61 (2012).
39. Varshney, R. K. et al. Draft genome sequence of pigeonpea (Cajanus cajan), an orphan legume crop of resource-poor farmers. Nat.
Biotechnol. 30(1), 83–89 (2012).
40. Kim, S. et al. Genome sequence of the hot pepper provides insights into the evolution of pungency in Capsicum species. Nat. Genet.
46, 270–278 (2014).
41. Kim, S. et al. New reference genome sequence of hot pepper reveal the massive evolution of plant disease-resistance genes by
retroduplication. Genome Biol. 18, 210 (2017).
42. Chen, X. et al. Sequencing of a wild apple (Malus baccata) genome unravels the differences between cultivated and wild apple
species regarding disease resistance and cold tolerance. G3 9(7), 2051–2060 (2019).
43. Jiang, S., An, H., Xu, F. & Zhang, X. Chromosome-level gneome assembly and annotation of the loquat (Eriobotrya japonica)
genome. GigaScience 9, 1–9 (2020).
44. Dong, X. et al. De novo assembly of a wild pear (Pyrus betuleafolia) genome. Plant Biotechnol. J. 18(2), 581–595 (2020).
45. Sonah, H. et al. Genome-wide distribution and organization of microsatellites in plants: An insight into marker development in
Brachypodium. PLoS ONE 6(6), e21298 (2011).
46. Cheng, J. et al. A comprehensive characterization of simple sequence repeats in pepper genomes provides valuable resources for
marker development in Capsicum. Sci. Rep. 6, 18919 (2016).
47. Zhang, Q. et al. Identification, characterization, and utilization of genome-wide simple sequence repeats to identify a QTL for
acidity in apple. BMC Genomics 13, 537 (2012).
Author contributions
A.S. performed data analysis, A.T.U. and A.O.U. conceived and designed the study, and performed data analy-
sis, A.O.U. prepared the manuscript, F.S. handled and prepared plant and DNA material for sequencing, I.C.
performed data analysis.
Competing interests
The authors declare no competing interests.
Additional information
Supplementary Information The online version contains supplementary material available at https://doi.
org/10.1038/s41598-021-83113-3.
Correspondence and requests for materials should be addressed to A.O.U.
Reprints and permissions information is available at www.nature.com/reprints.
Publisher’s note Springer Nature remains neutral with regard to jurisdictional claims in published maps and
institutional affiliations.
Scientific Reports | (2021) 11:3818 | https://doi.org/10.1038/s41598-021-83113-3 10
Vol:.(1234567890)www.nature.com/scientificreports/
Open Access This article is licensed under a Creative Commons Attribution 4.0 International
License, which permits use, sharing, adaptation, distribution and reproduction in any medium or
format, as long as you give appropriate credit to the original author(s) and the source, provide a link to the
Creative Commons licence, and indicate if changes were made. The images or other third party material in this
article are included in the article’s Creative Commons licence, unless indicated otherwise in a credit line to the
material. If material is not included in the article’s Creative Commons licence and your intended use is not
permitted by statutory regulation or exceeds the permitted use, you will need to obtain permission directly from
the copyright holder. To view a copy of this licence, visit http://creativecommons.org/licenses/by/4.0/.
© The Author(s) 2021
Scientific Reports | (2021) 11:3818 | https://doi.org/10.1038/s41598-021-83113-3 11
Vol.:(0123456789)You can also read