Deep-learning-based post-process correction of the aerosol parameters in the high-resolution Sentinel-3 Level-2 Synergy product
←
→
Page content transcription
If your browser does not render page correctly, please read the page content below
Atmos. Meas. Tech., 15, 895–914, 2022
https://doi.org/10.5194/amt-15-895-2022
© Author(s) 2022. This work is distributed under
the Creative Commons Attribution 4.0 License.

Deep-learning-based post-process correction of the aerosol
parameters in the high-resolution Sentinel-3 Level-2
Synergy product
Antti Lipponen1 , Jaakko Reinvall2 , Arttu Väisänen2 , Henri Taskinen2 , Timo Lähivaara2 , Larisa Sogacheva1 ,
Pekka Kolmonen1 , Kari Lehtinen1,2 , Antti Arola1 , and Ville Kolehmainen2
1 Finnish   Meteorological Institute, Atmospheric Research Centre of Eastern Finland, Kuopio, Finland
2 Department   of Applied Physics, University of Eastern Finland, Kuopio, Finland

Correspondence: Antti Lipponen (antti.lipponen@fmi.fi)

Received: 27 August 2021 – Discussion started: 27 September 2021
Revised: 10 January 2022 – Accepted: 18 January 2022 – Published: 21 February 2022

Abstract. Satellite-based aerosol retrievals provide global       ally fast machine-learning-based post-processing step of the
spatially distributed estimates of atmospheric aerosol pa-        existing retrieval product. Our approach is based on neural
rameters that are commonly needed in applications such as         networks trained based on collocated satellite data and ac-
estimation of atmospherically corrected satellite data prod-      curate ground-based Aerosol Robotic Network (AERONET)
ucts, climate modelling and air quality monitoring. However,      aerosol data. Based on our post-processing approach, we
a common feature of the conventional satellite aerosol re-        propose a post-process-corrected high-resolution Sentinel-3
trievals is that they have reasonably low spatial resolution      Synergy aerosol product, which gives a spectral estimate of
and poor accuracy caused by uncertainty in auxiliary model        the aerosol optical depth at five different wavelengths with a
parameters, such as fixed aerosol model parameters, and           high spatial resolution equivalent to the native resolution of
the approximate forward radiative transfer models utilized        the Sentinel-3 Level-1 data (300 m at nadir). With aerosol
to keep the computational complexity feasible. As a result,       data from Sentinel-3A and 3B satellites, we demonstrate
the improvement and reprocessing of the operational satellite     that our approach produces high-resolution aerosol data with
data retrieval algorithms would become a tedious and compu-       clearly better accuracy than the operational Sentinel-3 Level-
tationally excessive problem. To overcome these problems,         2 Synergy aerosol product, and it also results in slightly
we have developed a machine-learning-based post-process           better accuracy than the conventional fully learned machine
correction approach to correct the existing operational satel-    learning approach. We also demonstrate better generalization
lite aerosol data products. Our approach combines the exist-      capabilities of the post-process correction approach over the
ing satellite retrieval data and a post-processing step where     fully learned approach.
a machine learning algorithm is utilized to predict the ap-
proximation error in the conventional retrieval. With approx-
imation error, we refer to the discrepancy between the true
aerosol parameters and the ones retrieved using the satellite     1   Introduction
data. Our hypothesis is that the prediction of the approxima-
tion error with a finite training dataset is a less complex and   Climate change is one of the biggest challenges our society
easier task than the direct, fully learned machine-learning-      is facing today (IPCC, 2022). Despite the rapidly progress-
based prediction in which the aerosol parameters are directly     ing climate research, projections of the future climate still
predicted given the satellite observations and measurement        contain large uncertainties, with anthropogenic aerosol forc-
geometry. Our approach does not require reprocessing of the       ing being among the largest sources of these uncertainties
satellite retrieval products; it requires only a computation-     (Pachauri et al., 2014). If more accurate global information
                                                                  about the atmospheric aerosol parameters such as the aerosol

Published by Copernicus Publications on behalf of the European Geosciences Union.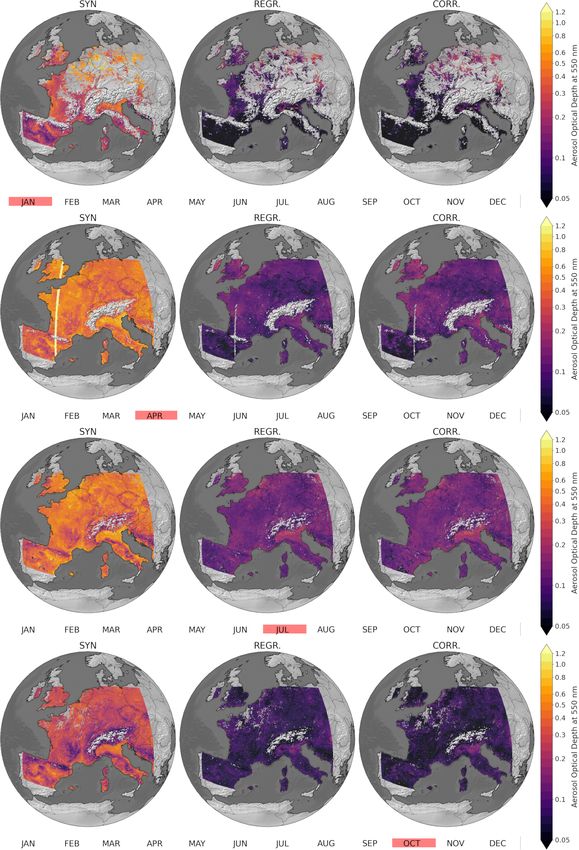
896                               A. Lipponen et al.: Deep-learning-based correction of the Sentinel-3 aerosol parameters

optical depth (AOD) and Ångström exponent (AE), and con-          imations and reductions, the aerosol retrievals have limited
sequently of their product aerosol index (AI), was available,     accuracy and suboptimal spatial resolution.
it would enable more accurate modelling of anthropogenic             Machine-learning-based solutions have been recently pro-
aerosol forcing and could lead to a significant reduction of      posed for satellite aerosol retrievals in many studies.
the uncertainties in future climate projections. Another major    Compared to conventional inverse problems approaches,
challenge for our societies is air quality. In 2017, 2 %–25 %     machine-learning-based solutions lead to much faster com-
of all deaths worldwide were attributable to ambient particu-     putation time (once the model has been trained) and they
late matter pollution (GBD 2017 Risk Factor Collaborators,        also offer a flexible framework for utilization of learning-
2018). To monitor air quality and pollution sources more ac-      data-based prior information in the retrieval. Most of the
curately, near-real-time spatially high-resolution estimates of   machine learning approaches to aerosol retrieval employ a
aerosols are needed (van Donkelaar et al., 2015).                 fully learned approach where the machine learning model
   Ground-based aerosol observations can be obtained from         is trained to emulate the retrieval directly, that is, to pre-
the Aerosol Robotic Network (AERONET) which utilizes              dict the values of the unknown aerosol parameters given the
ground-based direct Sun photometers (Giles et al., 2019;          satellite observation data (top-of-atmosphere radiances or re-
Holben et al., 1998). AERONET stations produce accurate           flectances) and observation geometry as the inputs. In Ran-
information on aerosols because they directly observe the at-     dles et al. (2017), neural-network-based fully learned aerosol
tenuation of solar radiation without interference from land       retrievals are assimilated into NASA’s Modern-Era Retro-
surface reflections. However, AERONET has the limitation          spective analysis for Research and Applications, version 2
that the network consists of a few hundred irregularly spaced     (MERRA-2) reanalysis model. In Di Noia et al. (2017), a
measurement stations, leading to a very limited and sparse        fully learned neural network model is used to retrieve the
spatial coverage of aerosol information. The only way to get      initial AOD for an iterative retrieval algorithm. In Lary et al.
wide spatial coverage information on aerosols is to use satel-    (2009), a fully learned approach with MODIS-retrieved AOD
lite retrievals.                                                  and the surface type as additional inputs was used for the
   Aerosol satellite retrieval algorithms produce estimates of    AOD retrieval from MODIS data. The results of Lary et al.
the aerosol optical properties such as AOD given the satel-       (2009) were validated using the AERONET data (Holben
lite observation data such as the top-of-atmosphere (TOA)         et al., 1998; Giles et al., 2019). The authors were able to re-
reflectances or radiances and the information on the obser-       duce the bias of the MODIS AOD data from 0.03 to 0.01
vation geometry. Satellite retrieval algorithms have been de-     with neural networks, while with support vector machines
veloped for multiple satellite instruments and the available      even better improvement was reported – AOD bias was less
satellite aerosol data records already span time series that      than 0.001 and the correlation coefficient with AERONET
are over 40 years long (Sogacheva et al., 2020). Examples         was larger than 0.99. However, they performed validation
of satellite aerosol data products include the Moderate Imag-     using all the available AERONET network stations both for
ing Spectroradiometer (MODIS) aerosol products (Salomon-          training and validation. The split between the training and
son et al., 1989; Levy et al., 2013) and Sentinel-3 Synergy       validation datasets was carried out using random sets of the
aerosol products.                                                 MODIS pixel values. With the random split of all pixels, the
   A satellite aerosol retrieval requires solution of a non-      data samples from the same AERONET station were present
linear inverse problem, where the task is to find aerosol pa-     both in training and evaluation datasets, leading potentially
rameters that minimize a misfit (such as the least squares        to overfitting as the model learns, for example, the surface
residual) between the satellite observation data and a forward    properties at the locations of the AERONET stations and can
model, which models the causal relationship from the un-          thus predict the aerosol properties very accurately at these
known aerosol parameters to the satellite observation data.       locations but may not generalize well to data from other
Atmospheric monitoring satellites cover the globe almost          regions. In Albayrak et al. (2013), a neural-network-based
daily with spatial high-resolution observation data, resulting    fully learned model was trained and evaluated for MODIS
in a huge amount of daily data to be processed by the retrieval   AOD retrieval. In their model, MODIS reflectances, mea-
algorithms. Due to the excessive amount of data, the oper-        surement geometry information, MODIS AOD and its qual-
ational aerosol retrieval algorithms employ physically and        ity flag were used as the input to predict the AOD. They
computationally reduced approximations of radiative trans-        found their model to produce more accurate AOD retrievals
fer models as the forward models (e.g. lookup tables) and         than the operational MODIS Dark Target (DT) algorithm. In
relatively simple inverse problem approaches, which often         Lanzaco et al. (2017), a slightly different type of machine-
ignore some of the observation data to reach fast computa-        learning-based approach was used to improve satellite AOD
tion times (Dubovik et al., 2011). Further, the retrieval al-     retrievals. The authors used MODIS AOD retrievals and lo-
gorithms typically produce spatially averaged aerosol prod-       cal meteorology information as inputs to predict the AOD
ucts that have lower spatial resolution compared to the native    in South America. This approach, which combines the con-
satellite Level-1 observation data. Because of these approx-      ventional AOD retrievals and local meteorology information,
                                                                  was found to improve the AOD accuracy over the operational

Atmos. Meas. Tech., 15, 895–914, 2022                                               https://doi.org/10.5194/amt-15-895-2022
A. Lipponen et al.: Deep-learning-based correction of the Sentinel-3 aerosol parameters                                          897

MODIS AOD. A problem in fully learned approaches is that            2    Post-process correction model of satellite aerosol
they rely only on the training data and do not employ physics-           retrievals
based models in the retrievals. This may cause problems for
the model to generalize to cases in which the inputs are out-       Let y ∈ Rm denote an accurate satellite aerosol retrieval:
side the input space spanned by the training dataset.
                                                                    y = f (x),                                                   (1)
   In Lipponen et al. (2021), we proposed a model-enforced
machine learning model for post-process correction of satel-        where vector y contains the output of the satellite retrieval
lite aerosol retrievals. The key idea in the model-enforced         algorithm, f : Rn 7 −→ Rm is an accurate retrieval algorithm,
approach is to exploit also the model and information of the        and x ∈ Rn contains all the algorithm inputs including the
conventional retrieval algorithm and train a machine learn-         observation geometry and Level-1 satellite observation data
ing algorithm for correction of the approximation error in          such as the top-of-atmosphere reflectances. Typically, the re-
the result of the conventional satellite retrieval algorithm.       trieval is carried out one image pixel at a time, and the aerosol
Previously, the post-process correction approach has been           retrieval y can consist, for example, of AOD and AE for a
found to produce more stable and accurate results than a            single image pixel, or as in the present study, AOD in a sin-
fully learned approach in generation of surrogate simulation        gle image pixel at five wavelengths.
models (Lipponen et al., 2013, 2018) and in medical imag-              In practice, due to uncertainties in the auxiliary parame-
ing; see, for example, Hamilton et al. (2019). The advantages       ters, such as land surface reflectance, of the underlying for-
of the model-enforced post-process correction approach are          ward model utilized in the retrieval, extensive computational
improved accuracy over the existing data products and the           dimension of the problem and processing time limitations, it
possibility to correct the existing products by a simple post-      is not possible to construct an accurate retrieval algorithm f
processing step without need for any reprocessing of the ex-        but an approximate retrieval algorithm,
isting retrieval algorithms, which are usually managed and
operated by the algorithm development teams. In Lipponen            y ≈ fe(x),
                                                                    e                                                            (2)
et al. (2021), the model-enforced approach was combined             has to be employed instead. The approximate retrieval fe is
with a random forest regression algorithm for post-process          typically based on physically simplified and computationally
correction of MODIS AOD and AE products using collo-                reduced approximate forward models that are used due to
cated MODIS and AERONET aerosol data for training the               the huge amount of data and the need for computational effi-
correction model for the approximation error in AOD and AE          ciency. The utilization of the approximate retrieval algorithm
in the MODIS DT over land product. The post-process cor-            leads to an approximation error,
rection was found to yield significantly improved accuracy
over the MODIS AOD and AE retrievals, and the correction            e(x) = f (x) − fe(x),                                        (3)
approach resulted in better accuracy retrievals than the fully      in the retrieval parameters.
learned machine learning approach.                                     The core idea in the model-enforced post-process correc-
   In this paper, we propose a post-process-corrected high-         tion model is to improve the accuracy of the approximate
resolution Sentinel-3 Synergy aerosol product. The product          retrieval (Eq. 2) by machine learning techniques (Lipponen
is based on the high-resolution Sentinel-3 Level-2 Synergy          et al., 2021). With Eqs. (1)–(3), the accurate retrieval can be
land product aerosol parameters with 300 m spatial reso-            written as
lution and the model-enforced machine learning approach,
where a feed-forward neural network is trained for post-            y = f (x)
process correction of the approximation error in the Sentinel-

                                                                        = fe(x) + f (x) − fe(x)
3 Level-2 Synergy aerosol product. The training of the neu-
ral network is based on collocated Sentinel-3 Synergy and               = fe(x) + e(x).                                          (4)
AERONET data from five selected regions of interest. Given          To obtain the corrected retrieval, Eq. (4) is used to combine
the Sentinel-3 observation data and high-resolution aerosol         the conventional (physics-based) retrieval algorithm fe(x)
products as input, our model produces an estimate of the            and a machine-learning-based model ê(x) to predict the real-
AOD at five wavelengths utilizing the native 300 m resolu-          ization of the approximation error e(x) to obtain a corrected
tion of the Sentinel-3 observation data.                            retrieval:
   The rest of this paper is organized as follows. In Sect. 2,
we describe the approximation error model for post-process          y ≈ fe(x) + ê(x).                                           (5)
correction of the satellite aerosol retrieval. Section 3 explains   Note that this approach is different from a conventional fully
the preprocessing of the Sentinel-3 and AERONET data for            learned machine learning model in which the aim is to em-
machine learning and the neural network model used for the          ulate the accurate retrieval algorithm f (x) with a machine
regression task. Section 4 gives the results, and Sect. 5 gives     learning model,
the conclusions.
                                                                    y ≈ fˆ(x),                                                   (6)

https://doi.org/10.5194/amt-15-895-2022                                                  Atmos. Meas. Tech., 15, 895–914, 2022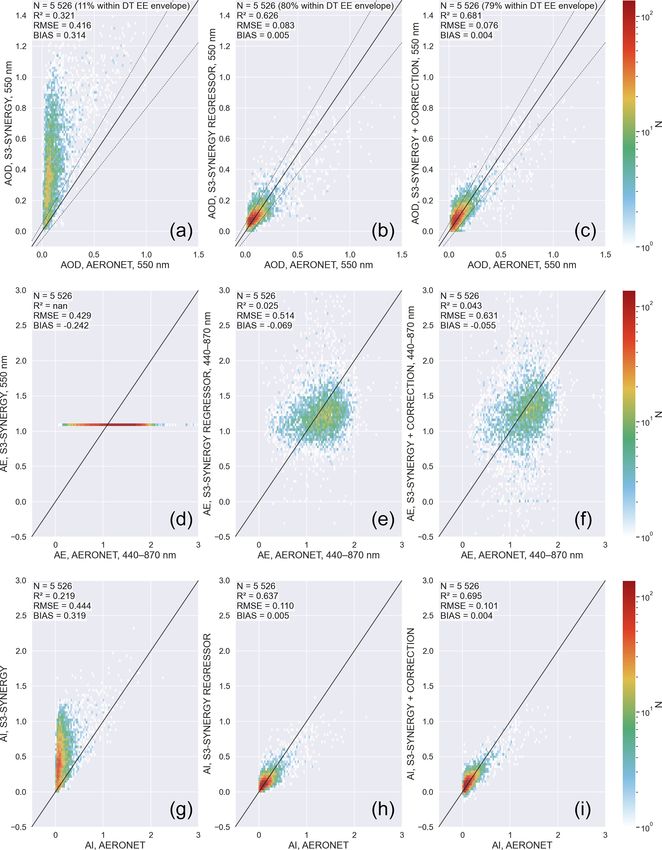
898                               A. Lipponen et al.: Deep-learning-based correction of the Sentinel-3 aerosol parameters

that is trained to predict the retrieval y directly from the          We use both Level-1b and Level-2 data of the Sentinel-
satellite observation and geometry data x; see Fig. 1 for          3 satellite mission data products from both Sentinel-3A and
a flowchart of fully learned and model-enforced regression         Sentinel-3B satellites. The Level-1b data include the infor-
models.                                                            mation about the measurement geometry and the satellite ob-
   The reason why the model-enforced approach (Eq. 5) can          served reflectances. The Level-2 data include the Synergy re-
be expected to perform better than the fully learned model         trieval data and the corresponding quality information. We
(Eq. 6) is that the approximation error e(x) is a simpler func-    use the SLSTR Level-1b data from the product SL_1_RBT,
tion for machine learning regression than the full physics-        OLCI Level-1b data from the OL_1_ERR data product and
based retrieval f (x), thus resulting in more accurate re-         Sentinel-3 Level-2 data from the SY_2_SYN data product.
sults than with a fully learned approach (Lipponen et al.,         We use year 2019 data in our study. For more information on
2013, 2018). Also, while the fully learned approach utilizes       the Sentinel-3 mission datasets, see https://sentinel.esa.int/
an ensemble of satellite observation data as learning data,        web/sentinel/missions/sentinel-3/data-products (last access:
the model-enforced approach utilizes also the additional in-       27 August 2021). The Sentinel-3 data used in the models are
formation in the approximate retrievals. Also, as the train-       listed in Appendix A.
ing of the post-process correction is based on existing satel-
lite data and retrievals, the implementation can be done in        3.2   AERONET
a straightforward manner, for example, using black-box ma-
chine learning code packages and used for correction of past       AERONET is a global network of Sun photometers (Holben
satellite retrievals without recomputing the approximate re-       et al., 1998). AERONET has a direct Sun data product that
trieval products fe(x). In addition, the post-process correc-      has both the AOD and AE data that we will use for train-
tion model is also flexible with respect the choice of the sta-    ing and testing of the machine learning models. AERONET
tistical regression model, and the choice of the regression        is commonly used as an independent data source, and all
model can be tailored to different retrieval problems sepa-        the data are publicly available at the AERONET website
rately.                                                            (https://aeronet.gsfc.nasa.gov/, last access: 27 August 2021).
                                                                   An extensive description of the AERONET sites, procedures
                                                                   and data provided is available from this website. Ground-
3     Methods                                                      based Sun photometers provide accurate measurements of
                                                                   AOD, because they directly observe the attenuation of so-
This section describes the construction of the learning and        lar radiation without interference from land surface reflec-
test data for the machine learning retrieval of Sentinel-          tions. The AOD-estimated uncertainty varies spectrally from
3 aerosol product with the post-process correction model           ±0.01 to ±0.02, with the highest error in the ultraviolet
(Eq. 5) and the fully learned model (Eq. 6). The selection         wavelengths (Giles et al., 2019; Eck et al., 1999). In this
of the neural network models and training of the networks is       study, we use AERONET, version 3, Level-2, direct Sun al-
also described. For training and validation of the post-process    gorithm data. The AERONET variables used in our studies
correction, we use the high-resolution Sentinel-3 Level-2          are listed in Appendix C.
Synergy and AERONET aerosol data.
                                                                   3.3   Regions of interest
3.1    Sentinel-3 satellite datasets
                                                                   The training and testing of the post-process correction model
Sentinel-3 is a European ocean and land mission. Currently,        is based on Sentinel-3 and AERONET data for the year 2019
two satellites related to this mission (Sentinel-3A and 3B) are    from five regions of interest shown in Fig. 2. The regions of
flying and collecting data. In this study, we use the Sentinel-3   interest were selected so that different types of aerosol re-
Ocean and Land Color Instrument (OLCI) and Sea and Land            gions based on aerosol source and type, AOD values and dif-
Surface Temperature Radiometer (SLSTR) data. OLCI is a             ferent types of surface reflectances are included and also that
medium-resolution imaging spectroradiometer (spatial reso-         the areas have good enough coverage of AERONET stations.
lution about 300 m at nadir) with 21 spectral bands from 400          The data for the machine learning procedures consist of
to 1020 nm. SLSTR is an imaging radiometer with dual-view          collocations of Sentinel-3 pixels with aerosol information
capabilities. The pixel size of SLSTR is from 500 m to 1 km        and AERONET data. We use the same ±30 min temporal
and spectral coverage is from visible to thermal infrared in       thresholds for the collocation procedure as in Petrenko et al.
nine standard bands (S1–S9). The swaths of these two instru-       (2012) and a spatial collocation radius of 5 km. We also re-
ments overlap, allowing combined products to exploit data          quire that the aerosol data in the pixels we use are not flagged
from both instruments. The high-resolution Sentinel-3 Level-       as filled, climatology data, too-low values, high error, partly
2 Synergy land aerosol product (North and Heckel, 2010) is         cloudy or ambiguous clouds. Furthermore, we require that
this type of combined product, which we will post-process          the pixels we use do not contain any cosmetic Level-1 data.
correct by the model (Eq. 5).                                      Our selections lead to a total number of 5526 collocated

Atmos. Meas. Tech., 15, 895–914, 2022                                                https://doi.org/10.5194/amt-15-895-2022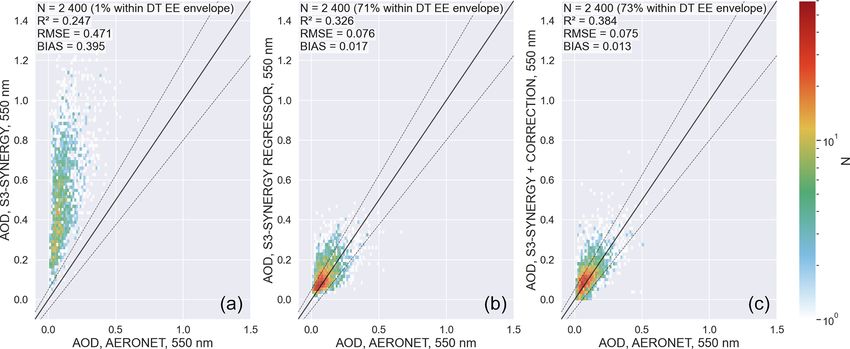
A. Lipponen et al.: Deep-learning-based correction of the Sentinel-3 aerosol parameters                                              899

Figure 1. Top: conventional satellite retrieval. Middle: fully learned machine-learning-based satellite retrieval approach. Bottom: model-
enforced post-process correction of satellite retrieval approach.

Figure 2. Regions of interest. Black dots indicate locations of AERONET stations.

Sentinel-3–AERONET overpasses for the machine learning                 as possible in both sets, we carried out the random split sep-
procedures.                                                            arately for each region of interest. To study the effect of ran-
  The AERONET stations were divided to separate train-                 domness on the splits of AERONET stations, we tested our
ing, validation and testing sets for good generalization of the        approach with multiple random splits. We did not observe
machine learning procedures. More specifically, the stations           significant differences in the results between different ran-
were randomly split into two sets for 2-fold cross validation.         dom splits of the AERONET stations.
To ensure as equal spatial distribution of AERONET stations

https://doi.org/10.5194/amt-15-895-2022                                                      Atmos. Meas. Tech., 15, 895–914, 2022
900                                A. Lipponen et al.: Deep-learning-based correction of the Sentinel-3 aerosol parameters

3.4   Input and output data for the machine learning
      models

The aerosol retrieval y ∈ R5 in both the post-process correc-
tion approach (Eq. 5) and the fully learned approach (Eq. 6)
consist of AODs for a single 300 × 300 m2 (at nadir) image
pixel at wavelengths of 440, 500, 550, 675 and 870 nm. These
wavelengths are native wavelengths in the AERONET and
Sentinel-3 Level-2 Synergy aerosol products in the sense that
the AERONET produces AOD at 440, 500, 675 and 870 nm
and the Synergy product at 550 nm.
   In the fully learned model (Eq. 6), the regression target
y ∈ R5 consist of the AERONET AODs at the selected five
wavelengths. The AERONET AOD at the Synergy 550 nm
channel was estimated as the mean of AOD 550 nm obtained
from Ångström law based on AERONET AOD at 500nm and
AE 440–870 nm. The input data for the fully learned model
contain Sentinel-3 satellite geometry and observation vari-
ables for a single image pixel. All the input and output vari-
ables were standardized by subtracting the training dataset
mean and dividing by the standard deviation. To retain the
spectral dependency of the AOD values at different wave-
lengths, all the AOD variables were standardized together us-
ing the mean and standard deviation of all AOD wavelengths.
In case some of the inputs contain a missing value, it is filled
with the average value of the training dataset. We also add
a binary (0/1) inputs for each input variable to indicate if        Figure 3. Schematic figure of neural network architectures used.
the data were filled. These selections and processing leads         (a) Correction network ê(x). (b) Regression network fˆ(x).
to an input vector x ∈ R90 . On average, the input data of the
fully learned and post-process correction models contained
about 8 % and 6 % of missing values, respectively. See the          tion of the mean squared error (MSE) loss functional with
Appendix B for the Sentinel-3 data file variable names of the       the ADAM optimizer. In the network training, batch size was
inputs and outputs.                                                 512, initial learning rate 5 × 10⁻⁵ , and the termination crite-
   In the post-process correction approach, the regression          rion for the learning was set to maximum 10 000 epochs or
target e ∈ R5 consist of the approximation error between            until validation loss started to increase with patience toler-
AERONET and Synergy spectral AOD. The Synergy aerosol               ance set to 10 epochs. For further information on deep learn-
product contains AOD and AE at 550 nm, which are trans-             ing and neural networks, see, e.g. Goodfellow et al. (2016).
formed by the Ångström law to obtain the Synergy AOD                   The architecture of the feed-forward neural networks was
product at the wavelengths of 440, 500, 675 and 870 nm. The         optimized by utilizing the asynchronous successive halving
input data of the post-correction model contain the same ge-        algorithm (ASHA) (Li et al., 2020). In the ASHA optimiza-
ometry and Level-1 data variables that are used in the fully        tion, the maximum number of trial network architectures was
learned model plus the Sentinel-3 Level-2 Synergy aerosol           set to 2500 and the algorithm was allowed to use up to 500
data. Furthermore, the inputs and outputs are standardized          epochs in a single trial. The space of feasible states for the
and the missing values filled similarly to those for the fully      number of hidden layers in the ASHA optimization was set
learned model. These selections lead to an input x ∈ R156 .         to (2, 3, 4) and the number of nodes in the hidden layers was
                                                                    allowed to be up to the number of elements in the input vector
3.5   Deep-learning-based regression models                         x. The optimization of the network architectures by ASHA
                                                                    led to the network structures shown in Fig. 3 for the fully
A fully connected feed-forward neural network was selected          learned approach fˆ(x) and the post-process correction ap-
as the model for the supervised learning tasks of estimating        proach ê(x). These network architectures were utilized in the
the regressors fˆ(x) in Eq. (6) and ê(x) in Eq. (5). In the neu-   final training of the models.
ral network, the rectified linear unit (ReLu) was used as the
activation function for all the hidden layers and no activa-
tion function was employed for the output layer. The weight
coefficients of the neural net were estimated by minimiza-

Atmos. Meas. Tech., 15, 895–914, 2022                                                 https://doi.org/10.5194/amt-15-895-2022
A. Lipponen et al.: Deep-learning-based correction of the Sentinel-3 aerosol parameters 901
3.6 Implementation Ångström law. In AERONET, the AE estimation is carried
out using an ordinary least squares type of method that re-
The neural network computations were implemented in jects clear outliers from the data to improve the outlier tol-
Python utilizing Pytorch and the ASHA optimization utiliz- erance of the AE estimation. The difference to AERONET
ing the Ray-tune package. The codes for the fully learned AE obtained using ordinary least squares fitting with no out-
model and post-process correction model will be made avail- lier treatment, however, is small. The AI is computed then
able. See the code and data availability section for informa- as product of the AOD and AE. AI has been considered as
tion on how to obtain the code to run the post-process cor- a better proxy for cloud condensation nuclei (CCN) than
rection and load a sample dataset. AOD (Gryspeerdt et al., 2017), since AI is more sensitive
than AOD to the accumulation mode aerosol concentration.
Figure 5 shows that the machine learning approaches lead
4 Results to clearly improved estimates of AOD 550 nm, AE and AI
compared to the Sentinel-3 Level-2 Synergy product. The
The accuracy of the post-process correction is tested using post-process correction approach produces the best RMSE,
AERONET data as the ground truth for the aerosol retrievals R 2 and EE metrics for the AOD estimates. From the AE esti-
and the results are compared to the high-resolution Sentinel- mates, we observe that the high-resolution Sentinel-3 Level-
3 Level-2 Synergy aerosol product and to the fully learned 2 Synergy AE product is uninformative as it produces the
retrieval model (Eq. 6). same constant value (approximately 1.1) for all of the test
Figure 4 shows scatter plots of the AOD retrievals with data points with a wide range of AERONET AEs. For the
the Sentinel-3 Level-2 Synergy product (left column), fully AE, the post-process correction approach has a smaller bias
learned machine learning (middle column) and post-process and visibly better correlation (with a nearly 2 times larger R 2
correction model (right column) against the AERONET data metric) but worse RMSE than the fully learned model. For
at all the test data stations at the four visible-to-near-infrared the AI, the post-process correction has better RMSE, bias
wavelengths of 440, 500, 675 and 870 nm measured by the and R 2 metrics compared to the fully learned model.
AERONET. Each figure shows the coefficient of determi- Figure 6 shows AERONET and Sentinel-3-based time
nation based correlation coefficient R 2 , root mean squared series of AOD at 550 nm over three AERONET stations,
error (RMSE) and median bias as the metrics to compare Madrid, Paris and Rome_Tor_Vergata, for the year 2019. In
the retrievals. The figures show also the ratio of samples all stations, the overestimation of AOD by the Sentinel-3
that are inside the Dark Target over land expected error Level-2 Synergy product is evident. The Sentinel-3 Level-
(EE) envelope of ±(0.05 % + 15 %). As can be seen, the ma- 2 Synergy AOD has also a clear seasonal cycle with higher
chine learning approaches clearly improve the accuracy of AODs occurring in summer and lower AOD in winter.
the AODs compared to the high-resolution Sentinel-3 Level- Both the fully learned model and post-process-corrected
2 Synergy product. Between the two machine learning ap- Sentinel-3 Synergy AOD are in very good agreement with
proaches, the post-process correction model has otherwise the AERONET AOD. Furthermore, the regressor and post-
better R 2 , RMSE and median bias error metrics than the process correction model AOD capture very well the events
fully learned model with the exceptions of the bias being of elevated AOD with a duration of several days.
the same as with the fully learned model at 500 and 675 nm. In Fig. 7, monthly averages of AOD at 550 nm in western
The ratio of samples inside the Dark Target EE envelope is Europe for January, April, July and October 2019 are shown
very similar to that of the post-process correction and fully for the Sentinel-3 Level-2 Synergy, fully learned model and
learned models. A notable feature in the figures is that there post-process correction-model-based data. Again, the sig-
are significantly less samples and relatively more “outliers” nificantly higher AOD of Sentinel-3 Level-2 Synergy com-
for large AOD values than for small AOD values. The accu- pared to the other two models is evident. The figure also
racy of the machine learning estimates also improves for the clearly shows that the amount of data varies quite signifi-
higher wavelengths, which do contain fewer high AOD val- cantly throughout the year mainly due to clouds and snow,
ues. These findings can be attributed to the fact that the learn- and more data are available for April and July than for Jan-
ing data contain relatively few samples for large AOD (the uary and October. All datasets show some spatial variations
number of samples with AOD > 0.5 is less than 5 %). This of AOD over Europe, and some cities and regions, such as
indicates that more high-AOD-value learning data would be Paris, France and the Po Valley, Italy, clearly show up in
needed to improve the prediction of the high AOD values. AOD maps.
Figure 5 shows a comparison of AOD at the native Figure 8 shows monthly averages of AOD at 550 nm for
Sentinel-3 Level-2 Synergy wavelength of 550 nm, AE and Madrid, Paris and Rome in July 2019. The filled circles in
AI. Given the estimated AODs at the five wavelengths, the the images indicate the monthly averages of the AERONET
AE was estimated as a separate post-processing step by uti- stations present in the regions. The Sentinel-3 Level-2 Syn-
lizing the standard approach (e.g. in AERONET) where AE ergy data product clearly produces a much higher AOD val-
is estimated by a least squares fit to the linearization of the ues then the fully learned and post-process correction mod-
https://doi.org/10.5194/amt-15-895-2022 Atmos. Meas. Tech., 15, 895–914, 2022902 A. Lipponen et al.: Deep-learning-based correction of the Sentinel-3 aerosol parameters Figure 4. Estimated AODs at the wavelengths employed in the AERONET. Top to bottom: 440, 500, 675 and 870 nm. Left: Sentinel-3 Level-2 Synergy AOD product. Middle: fully learned regressor model. Right: post-process correction. Atmos. Meas. Tech., 15, 895–914, 2022 https://doi.org/10.5194/amt-15-895-2022
A. Lipponen et al.: Deep-learning-based correction of the Sentinel-3 aerosol parameters                                       903

Figure 5. Rows from top to bottom: AOD (550 nm), AE, and AI. (a, d, g) Sentinel-3 Level-2 Synergy product. (b, e, h) Fully learned
regressor model. (c, f, i) Post-process correction model.

els, and the overestimation with respect to AERONET is also        to the AERONET AODs at the AERONET sites, and some
evident. The Sentinel-3 Level-2 Synergy AOD is also, due           high-resolution features are also clearly visible in the data.
to spatial median filtering of the data, much smoother than        For all three cities, both the fully learned and post-process
that of the two other models. For the fully learned and post-      correction model show some neighbourhoods with elevated
process correction models, the AOD values are very close           AOD. The correction model AOD shows even more details

https://doi.org/10.5194/amt-15-895-2022                                                Atmos. Meas. Tech., 15, 895–914, 2022
904                                  A. Lipponen et al.: Deep-learning-based correction of the Sentinel-3 aerosol parameters

Figure 6. AOD at 550 nm time series for three AERONET stations. The black lines and dots indicate AERONET measurements, red diamonds
indicate Sentinel-3 Level-2 Synergy, green circles indicate the fully learned regression model, and blue crosses indicate the corrected Sentinel-
3 Synergy retrievals.

Atmos. Meas. Tech., 15, 895–914, 2022                                                          https://doi.org/10.5194/amt-15-895-2022
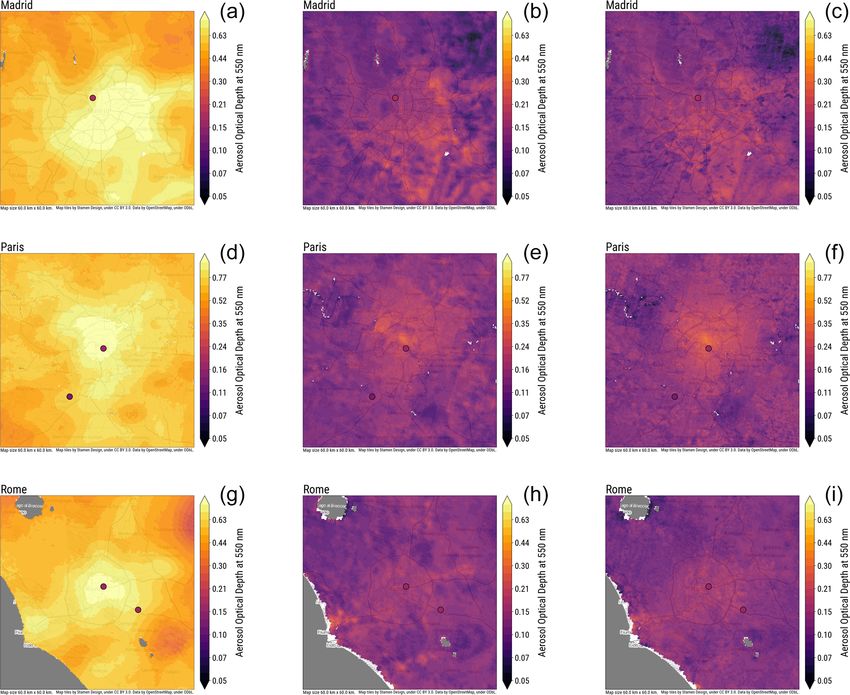
A. Lipponen et al.: Deep-learning-based correction of the Sentinel-3 aerosol parameters                                            905

Figure 7. Monthly averages of AOD at 550 nm for January (first row), April (second row), July (third row) and October (fourth row) 2019.
Left column: Sentinel-3 Level-2 Synergy. Middle column: fully learned regressor model. Right column: corrected Sentinel-3 Synergy.

https://doi.org/10.5194/amt-15-895-2022                                                    Atmos. Meas. Tech., 15, 895–914, 2022
906                                 A. Lipponen et al.: Deep-learning-based correction of the Sentinel-3 aerosol parameters

Figure 8. July 2019 monthly averages of AOD at 550 nm for Madrid (a, b, c), Paris (d, e, f) and Rome (g, h, i). (a, d, g) Sentinel-3 Level-2
Synergy. (b, e, h) fully learned regressor model. (c, f, i) Corrected Sentinel-3 Synergy. Circles represent the monthly averages of AERONET
stations.

and less artefacts than the fully learned model AOD. For ex-            the results for this test for the AOD at 550 nm in the cen-
ample, in Rome, the road from the city centre to the airport            tral European region. The post-process correction results in
is clearly visible from the AOD data, while the regression              clearly more accurate AOD estimates than the fully learned
model does not show this road. The fully learned model also             model. The result indicates that using the training data from
has some more box-shaped spatial anomalies than the other               nearby regions improves the model performance, and the
models.                                                                 post-process correction model performs better than the fully
   To study the generalization capabilities of the models, we           learned model also in regions far from the training data re-
carried out a test in which we evaluated the fully learned and          gions.
post-process correction models’ accuracy in the central Eu-                To evaluate the models’ performance in low and high
ropean region. The machine learning models were trained                 AOD conditions, we evaluated the results corresponding to
using data from regions of interest outside central Europe              AERONET AOD at 550 nm smaller than 0.2 and larger than
(eastern US, western US, southern Africa, India). The test              0.5. The results are shown in Table 1. The post-process-
aimed to evaluate how the models generalize to data far                 corrected model results in the best bias metric in both low and
from the training data regions, possibly with different dom-            high AOD conditions. In addition, the post-process-corrected
inant aerosol types and surface reflectances. Figure 9 shows            model results in the best R 2 in low AOD and the best RMSE

Atmos. Meas. Tech., 15, 895–914, 2022                                                       https://doi.org/10.5194/amt-15-895-2022
A. Lipponen et al.: Deep-learning-based correction of the Sentinel-3 aerosol parameters                                            907

Figure 9. AOD (550 nm) for central Europe and the year 2019. Machine learning models are trained using data outside the central European
region. (a) Sentinel-3 Level-2 Synergy product. (b) Fully learned regressor model. (c) Post-process correction.

Table 1. Error metrics for the satellite data product AOD at 550 nm   the Synergy land product aerosol parameters is their rela-
corresponding to small (< 0.2) and large (> 0.5) AERONET AOD.         tively poor accuracy. The aim of the post-process correc-
The bold font indicates the best performing model.                    tion is to significantly improve the accuracy of the Sentinel-3
                                                                      Level-2 Synergy land product aerosol parameters. The cor-
    AOD 550 nm < 0.2 (N = 4708)                                       rection is carried out as a computationally lightweight post-
    Metric   Synergy    Fully learned    Post-process corrected       processing step, and therefore there is no need for rerunning
                                                                      the actual Synergy retrieval algorithm to obtain the corrected
    R2        0.113             0.270                     0.310       aerosol data. This is a major benefit of the post-process cor-
    RMSE      0.412             0.050                     0.052       rection approach as rerunning of the original retrieval algo-
    Bias      0.303             0.010                     0.009
                                                                      rithm is a time-consuming process and often cannot even be
    AOD 550 nm > 0.5 (N = 163)                                        carried out by the individual researchers. As a reference for
    Metric   Synergy    Fully learned    Post-process corrected
                                                                      the machine-learning-based post-process correction of the
                                                                      Sentinel-3 Level-2 Synergy data product, we also trained a
    R2        0.497            0.273                     0.377        fully learned machine-learning-based regression model that
    RMSE      0.433            0.313                     0.279        carries out the full aerosol retrieval using Sentinel-3 Level-1
    Bias      0.379           −0.243                    −0.222        data.
                                                                         The results show that the fully learned and post-process
                                                                      correction machine learning approaches produces a clear im-
in high AOD conditions. The fully learned model results               provement in the aerosol parameter accuracy over the offi-
in about 4 % lower RMSE than the post-process-corrected               cial Synergy data product. The post-process correction ap-
model in low AOD. The Synergy R 2 is the best for the high            proach leads generally to a more accurate aerosol param-
AOD cases but there are only 163 samples in the high AOD              eters than the fully learned approach. While the improve-
cases so more data would be needed for a more reliable eval-          ment of the post-process correction over the fully learned
uation of the models in high AOD conditions.                          approach is not very large in the absolute scale, relatively
                                                                      the post-process-corrected product provides the best statis-
                                                                      tical comparison. For example, in AOD at 550 nm, R 2 im-
5   Conclusions                                                       proves by about 9 %, RMSE is 8 % smaller, and bias de-
                                                                      creases by 20 % in the post-process-corrected model when
We have developed a deep-learning-based post-process cor-             compared to the fully learned model. In some applications,
rection of the aerosol parameters in the high-resolution              such as data assimilation, these relative improvements may
Sentinel-3 Level-2 Synergy land product. Sentinel-3 Syn-              be relevant for the accuracy of the data assimilation model.
ergy also has an aerosol data product specifically designed           The post-process correction approach combines information
to retrieve the aerosol parameters. The aerosol data prod-            both from the physics-based conventional retrieval algorithm
uct, however, has a spatial resolution of 4.5 km, whereas the         and machine learning correction, whereas the fully learned
land product provides data with the Sentinel-3 instrument’s           model does not include any physics-based model informa-
full spatial imaging resolution of 300 m. The drawback in

https://doi.org/10.5194/amt-15-895-2022                                                    Atmos. Meas. Tech., 15, 895–914, 2022
908 A. Lipponen et al.: Deep-learning-based correction of the Sentinel-3 aerosol parameters
tion. The inclusion of the physics-based model information Appendix A: Sentinel-3 data used
may make the post-process correction approach more toler-
ant against samples outside the range of the training dataset This section describes the Sentinel-3 data used in the study.
when compared to the fully learned approach. The results We use both Level-1b and Level-2 data of the Sentinel-3
show that the fully learned model results more often in high satellite mission data products, and we use data from both
errors than the post-process correction. Sentinel-3A and Sentinel-3B satellites. For more information
We also studied the generalization capabilities of the ma- on the Sentinel-3 mission datasets, please see https://sentinel.
chine learning models. The results show that the post-process esa.int/web/sentinel/missions/sentinel-3 (last access: 27 Au-
correction model performs better than the fully learned gust 2021).
model also when trained using data from distant regions.
Ideally, in an operational setting, the machine learning mod- A1 Level-1b
els would be trained using global data, but, for example, in
A1.1 SLSTR
AOD retrievals, regardless of the high number of AERONET
stations, there are always some regions with relatively poor We use SLSTR Level-1b data from the SL_1_RBT data
AERONET coverage. Therefore, based on our results, we product. The variable names and the corresponding file
expect the post-process correction method to perform better names in the data products are listed in Table A1.
than the fully learned models in these regions.
The high spatial resolution, about 300 m at nadir, and the A1.2 OLCI
high accuracy of the post-process-corrected Sentinel-3 Syn-
ergy aerosol parameters over the official Sentinel-3 Level- We use OLCI Level-1b data from the OL_1_ERR data prod-
2 Synergy data product may possibly enable usage of the uct. The variable names and the corresponding file names in
data for new applications. For example, for air quality ap- the data products are listed in Table A2.
plications, the high-resolution accurate aerosol data could be
a step towards street-level monitoring instead of the typi- A2 Level-2
cal city or neighbourhood levels in conventional aerosol data
products. Improved accuracy high-spatial-resolution aerosol Synergy
parameter information may also significantly benefit atmo-
We use Sentinel-3 Level-2 data from the SY_2_SYN data
spheric correction in many land surface satellite applications.
product. The variable names and the corresponding file
The most impacted land surface applications are especially
names in the data products are listed in Table A3.
those that retrieve information from very low signal-to-noise
ratio data such as the retrieval of vegetation solar-induced
fluorescence.
We acknowledge the difficulty in validating the high-
spatial-resolution satellite aerosol data products as accurate
high-resolution spatial coverage aerosol validation data do
not exist. There are, however, some ground-based and air-
craft measurement campaigns, such as the Distributed Re-
gional Aerosol Gridded Observations Network (DRAGON)
(e.g. Garay et al., 2017; Virtanen et al., 2018), KORea–
United States Air Quality (KORUS-AQ) (e.g. Choi et al.,
2021), the Atmospheric Radiation Measurement (ARM)
programme (e.g. Javadnia et al., 2017) and ObseRvations
of Aerosols above CLouds and their intEractionS (ORA-
CLES) (e.g. Redemann et al., 2021), that could provide help-
ful insight on high-resolution aerosol features. Using the
campaign data from these campaigns to validate the high-
resolution satellite aerosol retrievals is a potential topic for
future studies. Also, evaluation of the relative differences
between the post-process-corrected Synergy data and 1 km
MODIS Multi-Angle Implementation of Atmospheric Cor-
rection (MAIAC) (Lyapustin et al., 2018) data could reveal
useful insight on the spatially varying AOD features.
Atmos. Meas. Tech., 15, 895–914, 2022 https://doi.org/10.5194/amt-15-895-2022A. Lipponen et al.: Deep-learning-based correction of the Sentinel-3 aerosol parameters 909
Table A1. Sentinel-3 SL_1_RBT files and variables used. Here, [X] denotes SLSTR band numbers 1–6.
Variable name Variable
File: geodetic_an.nc
latitude_an Latitude of detector field of view (FOV) centre on the Earth’s surface, nadir view
longitude_an Longitude of detector FOV centre on the Earth’s surface, nadir view
File: geodetic_ao.nc
latitude_ao Latitude of detector FOV centre on the Earth’s surface, oblique view
longitude_ao Longitude of detector FOV centre on the Earth’s surface, oblique view
File: geodetic_tx.nc
latitude_tx Latitude of detector FOV centre on the Earth’s surface
longitude_tx Longitude of detector FOV centre on the Earth’s surface
File: geometry_tn.nc
solar_zenith_tn Solar zenith angle, nadir view
File: geometry_to.nc
solar_zenith_to Solar zenith angle, oblique view
File: SXX_radiance_an.nc
S[X]_radiance_an TOA radiance for channel S[X] (A stripe grid, nadir view)
File: S[X]_quality_an.nc
S[X]_solar_irradiance_an Solar irradiance at top of atmosphere, channel S[X], nadir view
File: S[X]_radiance_ao.nc
S[X]_radiance_ao TOA radiance for channel S[X] (A stripe grid, oblique view)
File: S[X]_quality_ao.nc
S[X]_solar_irradiance_ao Solar irradiance at top of atmosphere, channel S[X], oblique view
Table A2. Sentinel-3 OL_1_ERR files and variables used. Here, [YY] denotes OLCI band numbers 1–21.
Variable name Variable
File: geo_coordinates.nc
latitude DEM-corrected latitude
longitude DEM-corrected longitude
File: qualityFlags.nc
quality_flags Classification and quality flags
File: instrument_data.nc
detector_index Detector index
solar_flux In-band solar irradiance, seasonally corrected
File: tie_geometries.nc
SZA Solar zenith angle
File: Oa[YY]_radiance.nc
Oa[YY]_radiance TOA radiance for OLCI acquisition band Oa[YY]
https://doi.org/10.5194/amt-15-895-2022 Atmos. Meas. Tech., 15, 895–914, 2022910 A. Lipponen et al.: Deep-learning-based correction of the Sentinel-3 aerosol parameters
Table A3. Sentinel-3 SY_2_SYN files and variables used.
Variable name Variable
File: time.nc
start_time Time of start measurement
stop_time Time of stop measurement
File: geolocation.nc
altitude DEM-corrected altitude
lat DEM-corrected latitude
lon DEM-corrected longitude
File: Syn_AMIN.nc
AMIN Aerosol model index number
File: Syn_Angstrom_exp550.nc
A550 Aerosol Ångström exponent at 550 nm
File: Syn_AOT550.nc
T550 Aerosol optical thickness
T550_err Aerosol optical thickness standard error
File: flags.nc
SYN_flags Synergy classification and aerosol retrieval flags
CLOUD_flags Synergy cloud flags
OLC_flags Selected quality and classification flags for OLCI SYN channels
SLN_flags Exception summary and confidence flags for SLSTR nadir-view SYN channels
SLO_flags Exception summary and confidence flags for SLSTR oblique-view SYN channels
File: Syn_Oa[XX]_reflectance.nc
SDR_Oa[YY] Surface directional reflectance associated with OLCI channel [XX]
SDR_Oa[YY]_ERR Surface directional reflectance error estimate associated with OLCI channel [XX]
File: Syn_S[YY]N_reflectance.nc
SDR_S[YY]N Surface directional reflectance associated with SLSTR channel [YY] acquired
in nadir view
SDR_S[YY]N_ERR Surface directional reflectance error estimate associated with SLSTR
channel [YY] acquired in nadir view
File: Syn_S[YY]O_reflectance.nc
SDR_S[YY]O Surface directional reflectance associated with SLSTR channel [YY] acquired
in oblique view
SDR_S[YY]O_ERR Surface directional reflectance error estimate associated with SLSTR
channel [YY] acquired in oblique view
File: tiepoints_olci.nc
OLC_TP_lat Latitude (WGS84)
OLC_TP_lon Longitude (WGS84)
OLC_VAA OLCI view azimuth angle
OLC_VZA OLCI view zenith angle
SAA Sun azimuth angle
SZA Sun zenith angle
Atmos. Meas. Tech., 15, 895–914, 2022 https://doi.org/10.5194/amt-15-895-2022A. Lipponen et al.: Deep-learning-based correction of the Sentinel-3 aerosol parameters 911
Table A3. Continued. – SL1_S3_reflectance_nadir
– SL1_S3_reflectance_oblique
Variable name Variable
– SL1_S4_reflectance_nadir
File: tiepoints_slstr_n.nc
– SL1_S4_reflectance_oblique
SLN_TP_lat Latitude (WGS84)
SLN_TP_lon Longitude (WGS84) – SL1_S5_reflectance_nadir
SLN_VAA SLSTR nadir-view azimuth angle – SL1_S5_reflectance_oblique
SLN_VZA SLSTR nadir-view zenith angle
– SL1_S6_reflectance_nadir
File: tiepoints_slstr_o.nc
– SL1_S6_reflectance_oblique
SLO_TP_lat Latitude (WGS84)
– OL1_Oa01_reflectance
SLO_TP_lon Longitude (WGS84)
SLO_VAA SLSTR oblique-view zenith angle – OL1_Oa02_reflectance
SLO_VZA SLSTR oblique-view zenith angle – OL1_Oa03_reflectance
File: tiepoints_meteo.nc – OL1_Oa04_reflectance
air_pressure Mean air pressure at sea level – OL1_Oa05_reflectance
ozone Total columnar ozone
water_vapour Total column water vapour – OL1_Oa06_reflectance
– OL1_Oa07_reflectance
– OL1_Oa08_reflectance
Appendix B: Input and output variables of the models – OL1_Oa09_reflectance
We divide the input and output variables into following five – OL1_Oa10_reflectance
groups. – OL1_Oa11_reflectance
– Geometry variables – OL1_Oa12_reflectance
– OL1_Oa13_reflectance
– SYN_altitude
– OL1_Oa14_reflectance
– SYN_O_VAA
– OL1_Oa15_reflectance
– SYN_O_VZA
– OL1_Oa16_reflectance
– SYN_O_SAA
– OL1_Oa17_reflectance
– SYN_O_SZA
– OL1_Oa18_reflectance
– SYN_SN_VAA
– OL1_Oa19_reflectance
– SYN_SN_VZA
– OL1_Oa20_reflectance
– SYN_SO_VAA
– OL1_Oa21_reflectance
– SYN_SO_VZA
– SYN_O_scattering_angle – SYN L2 variables
– SYN_SO_scattering_angle – SYN_AOD550
– SYN_SN_scattering_angle – SYN_AOD550err
Here, all variables are based on the Sentinel-3 Synergy – SYN_AE550
data product. SYN_O, SYN_SN and SYN_SO corre- – SYN_AMIN
spond to OLCI, SLSTR nadir view and SLSTR oblique – SYN_SYN_no_slo
view, respectively.
– SYN_SYN_no_sln
– Satellite observation variables – SYN_SYN_no_olc
– SL1_S1_reflectance_nadir – SYN_SDR_Oa01
– SL1_S1_reflectance_oblique – SYN_SDR_Oa02
– SL1_S2_reflectance_nadir – SYN_SDR_Oa03
– SL1_S2_reflectance_oblique – SYN_SDR_Oa04
https://doi.org/10.5194/amt-15-895-2022 Atmos. Meas. Tech., 15, 895–914, 2022912 A. Lipponen et al.: Deep-learning-based correction of the Sentinel-3 aerosol parameters
– SYN_SDR_Oa05 Inputs and outputs
– SYN_SDR_Oa06 As the inputs for the regression model, we use the variables
– SYN_SDR_Oa07 from the following variable sets:
– SYN_SDR_Oa08 – geometry variables;
– SYN_SDR_Oa09
– satellite observation variables.
– SYN_SDR_Oa10
As the outputs for the regression model we use the variables
– SYN_SDR_Oa11 from the following variable sets:
– SYN_SDR_Oa12
– regression output variables.
– SYN_SDR_Oa16
As the inputs for the correction model we use the variables
– SYN_SDR_Oa17
from the following variable sets:
– SYN_SDR_Oa18
– geometry variables;
– SYN_SDR_Oa21
– SYN_SDR_S1N – satellite observation variables;
– SYN_SDR_S1O – SYN L2 variables.
– SYN_SDR_S2N As the outputs for the correction model we use the variables
– SYN_SDR_S2O from the following variable sets:
– SYN_SDR_S3N – correction output variables.
– SYN_SDR_S3O
– SYN_SDR_S5N Appendix C: AERONET data used
– SYN_SDR_S5O
The following variables of the AERONET data were used:
– SYN_SDR_S6N
– AOD_440nm;
– SYN_SDR_S6O
– AOD_500nm;
– Regression output variables
– AOD_675nm;
– AERONET_AOD_550 nm_mean
– AOD_870nm;
– AERONET_AOD_440nm_mean
– AERONET_AOD_500nm_mean – 440-870_Angstrom_Exponent.
– AERONET_AOD_675nm_mean
– AERONET_AOD_870nm_mean Code and data availability. Python code and trained models to
run the post-process correction are available at https://github.
– Correction output variables com/TUT-ISI/S3POPCORN (last access: 11 February 2022;
Lipponen et al., 2021b, https://doi.org/10.5281/zenodo.6042568).
Post-process-corrected Sentinel-3 data of the regions of in-
– AOD550_approximationerror
terest for the year 2019 are available for download at https:
– AOD440_approximationerror //a3s.fi/swift/v1/AUTH_ca5072b7b22e463b85a2739fd6cd5732/
POPCORNdata/readme.html (last access:11 February 2022;
– AOD500_approximationerror Lipponen et al., 2021a, https://doi.org/10.23728/FMI-
– AOD675_approximationerror B2SHARE.C81ADE576E1C49E4AEF9CA1CA8A7621A).
– AOD870_approximationerror
Video supplement. A video corresponding to Fig. 7 can be
Approximation error variables () are computed using found online at https://doi.org/10.5281/zenodo.5287243 (Lipponen,
Eq. (3). 2021).
Atmos. Meas. Tech., 15, 895–914, 2022 https://doi.org/10.5194/amt-15-895-2022A. Lipponen et al.: Deep-learning-based correction of the Sentinel-3 aerosol parameters 913
Author contributions. AL, JR, AV, HT, TL and VK developed the optical depth of biomass burning, urban, and desert dust aerosols,
deep learning methodology presented. AL collected and processed J. Geophys. Res.-Atmos., 104, 31333–31349, 1999.
the data. All authors participated in the data analysis of the results. Garay, M. J., Kalashnikova, O. V., and Bull, M. A.: Develop-
VK wrote the original manuscript. All authors reviewed and edited ment and assessment of a higher-spatial-resolution (4.4 km)
the manuscript. MISR aerosol optical depth product using AERONET-
DRAGON data, Atmos. Chem. Phys., 17, 5095–5106,
https://doi.org/10.5194/acp-17-5095-2017, 2017.
Competing interests. The contact author has declared that neither GBD 2017 Risk Factor Collaborators: Global, regional, and na-
they nor their co-authors have any competing interests. tional comparative risk assessment of 84 behavioural, environ-
mental and occupational, and metabolic risks or clusters of risks
for 195 countries and territories, 1990–2017: a systematic anal-
Disclaimer. Publisher’s note: Copernicus Publications remains ysis for the Global Burden of Disease Study 2017, Lancet, 392,
neutral with regard to jurisdictional claims in published maps and 1923–1994, 2018.
institutional affiliations. Giles, D. M., Sinyuk, A., Sorokin, M. G., Schafer, J. S., Smirnov,
A., Slutsker, I., Eck, T. F., Holben, B. N., Lewis, J. R., Campbell,
J. R., Welton, E. J., Korkin, S. V., and Lyapustin, A. I.: Advance-
ments in the Aerosol Robotic Network (AERONET) Version 3
Acknowledgements. This study was funded by the European Space
database – automated near-real-time quality control algorithm
Agency EO Science for Society programme via the POPCORN
with improved cloud screening for Sun photometer aerosol op-
project. The research was also supported by the Academy of Fin-
tical depth (AOD) measurements, Atmos. Meas. Tech., 12, 169–
land, the Finnish Centre of Excellence of Inverse Modelling and
209, https://doi.org/10.5194/amt-12-169-2019, 2019.
Imaging (project no. 336791) and the Academy of Finland (project
Goodfellow, I., Bengio, Y., and Courville, A.: Deep Learning, MIT
no. 321761).
Press, http://www.deeplearningbook.org (last access: 27 August
2021), 2016.
Gryspeerdt, E., Quaas, J., Ferrachat, S., Gettelman, A., Ghan, S.,
Financial support. This research has been supported by the Lohmann, U., Morrison, H., Neubauer, D., Partridge, D. G., Stier,
Academy of Finland (grant nos. 336791 and 321761) and the Euro- P., Takemura, T., Wang, H., Wang, M., and Zhang, K.: Constrain-
pean Space Agency (grant no. 4000131074/20/I-DT). ing the instantaneous aerosol influence on cloud albedo, P. Natl.
Acad. Sci. USA, 114, 4899–4904, 2017.
Hamilton, S. J., Hänninen, A., Hauptmann, A., and Kolehmainen,
Review statement. This paper was edited by Hiren Jethva and re- V.: Beltrami-net: domain-independent deep D-bar learning for
viewed by two anonymous referees. absolute imaging with electrical impedance tomography (a-
EIT), Physiol. Meas., 40, 074002, https://doi.org/10.1088/1361-
6579/ab21b2, 2019.
Holben, B. N., Eck, T., Slutsker, I., Tanre, D., Buis, J., Setzer, A.,
References Vermote, E., Reagan, J. A., Kaufman, Y., Nakajima, T., Lavenu,
F., Jankowiak, I., and Smirnov, A.: AERONET–A federated in-
Albayrak, A., Wei, J., Petrenko, M., Lynnes, C. S., and Levy, strument network and data archive for aerosol characterization,
R. C.: Global bias adjustment for MODIS aerosol optical thick- Remote Sens. Environ., 66, 1–16, 1998.
ness using neural network, J. Appl. Remote Sens., 7, 073514, IPCC: Summary for Policymakers. In: Climate Change 2021, The
https://doi.org/10.1117/1.JRS.7.073514, 2013. Physical Science Basis. Contribution of Working Group I to the
Choi, Y., Ghim, Y. S., Rozenhaimer, M. S., Redemann, J., LeBlanc, Sixth Assessment Report of the Intergovernmental Panel on Cli-
S. E., Flynn, C. J., Johnson, R. J., Lee, Y., Lee, T., Park, T., mate Change, edited by: Masson-Delmotte, V., Zhai, P., Pirani,
Schwarz, J. P., Lamb, K. D., and Perring, A. E.: Temporal and A., Connors, S. L., Péan, C., Berger, S., Caud, N., Chen, Y.,
spatial variations of aerosol optical properties over the Korean Goldfarb, L. Gomis, M.I. Huang, M., Leitzell, K., Lonnoy, E.,
peninsula during KORUS-AQ, Atmos. Environ., 254, 118301, Matthews, J. B. R., Maycock, T. K., Waterfield, T., Yelekçi, O.,
https://doi.org/10.1016/j.atmosenv.2021.118301, 2021. Yu, R., and Zhou, B., Cambridge University Press, in press, 2022.
Di Noia, A., Hasekamp, O. P., Wu, L., van Diedenhoven, B., Javadnia, E., Abkar, A. A., and Schubert, P.: Estimation of High-
Cairns, B., and Yorks, J. E.: Combined neural network/Phillips– Resolution Surface Shortwave Radiative Fluxes Using SARA
Tikhonov approach to aerosol retrievals over land from the AOD over the Southern Great Plains, Remote Sensing, 9, 1146,
NASA Research Scanning Polarimeter, Atmos. Meas. Tech., 10, https://doi.org/10.3390/rs9111146, 2017.
4235–4252, https://doi.org/10.5194/amt-10-4235-2017, 2017. Lanzaco, B. L., Olcese, L. E., Palancar, G. G., and Toselli, B. M.:
Dubovik, O., Herman, M., Holdak, A., Lapyonok, T., Tanré, An Improved Aerosol Optical Depth Map Based on Machine-
D., Deuzé, J. L., Ducos, F., Sinyuk, A., and Lopatin, A.: Learning and MODIS Data: Development and Application in
Statistically optimized inversion algorithm for enhanced re- South America, Aerosol Air Qual. Res., 17, 1523–1536, 2017.
trieval of aerosol properties from spectral multi-angle polari- Lary, D. J., Remer, L., MacNeill, D., Roscoe, B., and Paradise, S.:
metric satellite observations, Atmos. Meas. Tech., 4, 975–1018, Machine learning and bias correction of MODIS aerosol optical
https://doi.org/10.5194/amt-4-975-2011, 2011. depth, IEEE Geosci. Remote S., 6, 694–698, 2009.
Eck, T. F., Holben, B., Reid, J., Dubovik, O., Smirnov, A., O’neill,
N., Slutsker, I., and Kinne, S.: Wavelength dependence of the
https://doi.org/10.5194/amt-15-895-2022 Atmos. Meas. Tech., 15, 895–914, 2022You can also read