National College of Ireland
←
→
Page content transcription
If your browser does not render page correctly, please read the page content below

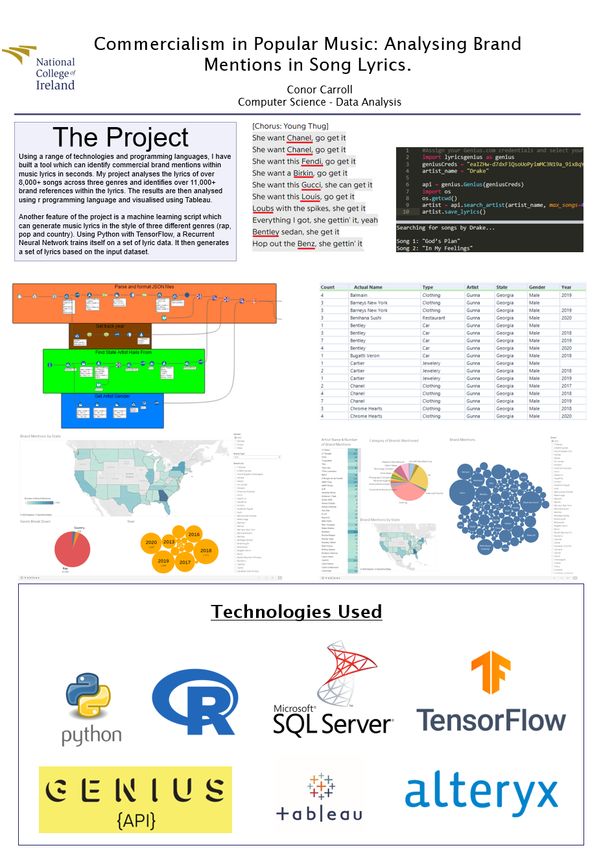
National College of Ireland
 BSc Computing
 Data Analytics
 2020/2021
 Conor Carroll
 X14535037
 X14535037@student.ncirl.ie

Commercialism in Popular Music: Analysing brand
mentions in song lyrics. Using Machine Learning to
 create lyrics in the style of different genres.
 Technical Report
Contents
Executive Summary ................................................................................................................................. 2
1.0 Introduction ................................................................................................................................ 3
 1.1. Background ............................................................................................................................. 3
 1.2. Motivation............................................................................................................................... 5
 1.3. Aims......................................................................................................................................... 5
 1.4. Technology .............................................................................................................................. 6
 1.5. Structure ................................................................................................................................. 6
2.0 Data ............................................................................................................................................. 7
3.0 Methodology ............................................................................................................................... 8
4.0 Implementation .......................................................................................................................... 9
 4.1. ETL ........................................................................................................................................... 9
 4.2. Visualisation .......................................................................................................................... 21
 4.3. Neural Network ..................................................................................................................... 23
5.0 Analysis ..................................................................................................................................... 28
6.0 Results ....................................................................................................................................... 34
7.0 Conclusions ............................................................................................................................... 41
7.1. Problem Addressed ................................................................................................................... 41
7.2. Testing ....................................................................................................................................... 41
7.3. End Products ............................................................................................................................. 42
7.4. Strengths and Limitations ......................................................................................................... 42
7.5. Key Findings .............................................................................................................................. 43
8.0 Further Development or Research ........................................................................................... 44
 8.1. More artists/genres ............................................................................................................... 44
 8.2. Bigger Brand List .................................................................................................................... 44
 8.3. Accept user input .................................................................................................................. 44
 8.4. Animated tableau dashboard ................................................................................................ 45
9.0 References ................................................................................................................................ 45
10.0 Appendices ................................................................................................................................ 46
 10.1. Project Plan ....................................................................................................................... 46
 10.2. Reflective Journals ............................................................................................................ 46
 10.3. Other materials used ........................................................................................................ 55

 1
Executive Summary
In my report I will document my process of building a tool from scratch which is capable of
identifying brand mentions within song lyrics. I will show how I get my raw data from the
API provided by Genius.com, parse the data and create a data warehouse with all the brand
mentions among other items of data.

I will also document how I created my list of brands to check for, using R programming
language to web scrape lists from various sources on the net. The process I have built is
usable for future artists going forward and could be modified to be used to check for other
pieces of information within the music lyrics. I will be showing how I go about visualising the
end dataset using Tableau.

Some analysis will be performed on the finished dataset and findings reporting. Some of the
findings include, the rap genre has significantly more brand mentions than pop and country
music and female and male rap artists tend to mention brands a similar number of times. I
will also be looking at the correlation between Google Trends data and the number of times
a brand is mentioned in that location.

As well as this, I will be documenting the creation of a Recurrent Neural Network in Python
which is able to generate lyrics in the style of the three different genres looked at in this
project. The Neural Network trains itself on the lyrics of genres and produces its own, based
on the input data.

 2
1.0 Introduction

 1.1. Background
 Commercial Brands have tapped into hip-hop artists for more than 25 years to promote
 their products. An example of a ground-breaking marketing campaign launched in the
 90’s revolving around hip-hop and urban culture was Sprite’s “Obey Your Thirst”
 campaign. It revolved around hip-hop artists, basketball players and other urban
 themes. The campaign helped Sprite cultivate an image of the drink of hip, sometimes
 cynical young people everywhere. In terms of sales impact, the campaign was very
 successful, increasing their sales volume by 13% and increasing their soft drink market
 share (Sunset, 2008).
 Other brands have not been so quick to embrace the image of a brand related to hip-
 hop/urban culture. The champagne brand “Cristal” was a favourite among rappers in
 the early and late 2000s, with rappers like Jay-Z claiming in his lyrics to be drinking
 “Cristal by the bottle”. However, Louis Roederer, the makers of Cristal, did not welcome
 their association with rap music. In an interview with the economist, Frederic Rouzaud,
 the managing director of Louis Roederer, when asked about their association with rap
 music and if it could be detrimental said:
 “That's a good question, but what can we do? We can't forbid people from buying it. I'm
 sure Dom Perignon or Krug would be delighted to have their business.”

 This led to many big names in the industry boycotting the brand. It also directly led to
 Jay-Z starting his own brand of champagne and competitor to Cristal, “Ace of Spades”.
 He also refused to sell it anymore at his range of bars in Manhattan (Roberts, 2009).
 Although it seems that as of more recent times, brands who would have had a similar
 viewpoint as Cristal, in a sense that they wanted to distance themselves from rap music
 are starting to make a U-turn. For example, the Atlanta based rap artist Radrick Davis
 who goes by the stage name "Gucci Mane", claimed he received over 100 cease and
 desist letters in the early stage of his career (2006-2011) from the famed Italian fashion
 designer Gucci. The fashion brand Gucci’s upmarket image did not want to be associated
 with the rap artist, whose lyrics referenced the harsh realities and violence associated
 with growing up in the low-income eastern suburbs of Atlanta. However, the culture has
 changed and evolved. In a complete turnaround in the relationship, Radrick Davis went
 on to become the face of Gucci’s 2020 "Cruise Collection" (Hore-Thorburn, 2020).

 3
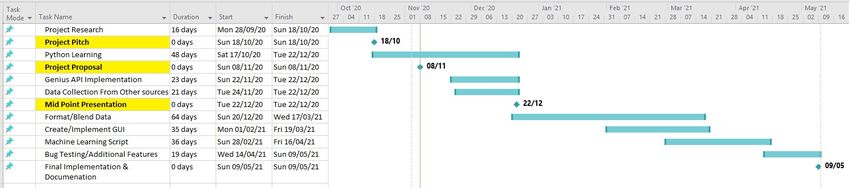
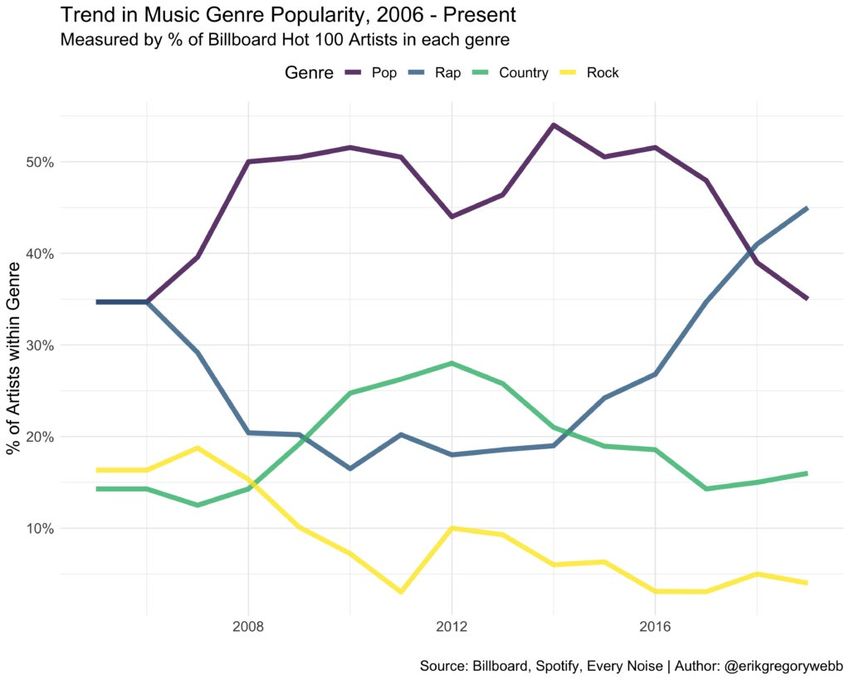
Fig.1 Gucci Mane models for Gucci’s “Cruise Collection”

As of late, these hip-hop brand partnerships have really ramped up, Post-Malone is the
poster boy for Bud Light, Snoop Dogg has partnered up with Just-Eat to promote their
services, Cardi B went from reality show participant to platinum selling artist and the
face of campaigns for Reebok and Pepsi. That is just to name a few, there are countless
examples. This may be due to the fact that rap music has become more mainstream. In
my lifetime, rap music has gone from a somewhat niche genre and subculture to the
cultural zeitgeist it is today. In 2017, rap music became the most popular music in the
world.

Fig. 2 Trend chart showing Rap music overtaking Pop

 4
This trend of brands partnering up is not expected to stop anytime soon (Kelly, 2020).
Kelly Bayett, co-founder of Barking Owl music group said that these partnerships have
slowed due to the coronavirus pandemic but:
“Once things calm down, I anticipate the hip-hop-based marketing and brand
collaborations will skyrocket. People will be ready to let loose and have a good time”

1.2. Motivation
For the project, I decided to do some research on what brands are most frequently
mentioned by artists within their lyrics. I found a number newspaper articles and
research papers which analysed this (This Is the Most Name-Dropped Brand in Music,
2017). The greatest number of songs analysed in one study that I found was 560 songs
(Craig, Flynn and Holody, 2017). I felt that this was a rather small amount and that I
could do this on a bigger scale. I wanted to create a data warehouse which held data on
artists, and which brands they mentioned and the frequency of mentions. I wanted also
to create the tool so it could be used to analyse any lyrics going forward and could be
done with only a few clicks of a button.
I also felt that this could have commercial usage. Marketing departments for brands can
check and see with which artists/genres/locations they are popular in and make
decisions based on this. In order to achieve this, I decided to build a tableau dashboard,
which will visualise the data from the data warehouse.
I will explore the difference between genres when it comes to brand mentions, their
frequency and type of brands mentioned. I wanted to see if there is a difference
between genders when it comes to the brand mentions. I will also be exploring if the
amount of brand mentions within music correlates with Google trends data for the same
region/time.
As well as analysing the content of the lyrics, I want to use AI in order to generate music
lyrics from our dataset. The generated lyrics will be done on a genre-by-genre basis,
using a Neural Network.
I have chosen to undertake this project as it integrates multiple aspects of my learning
from my time in college. I feel it encapsulates and showcases multiple disciplines such as
data pre-processing, data warehousing, machine learning, data visualisation and
business data analysis.

1.3. Aims
Aim 1: Create a data warehouse which stores information on artists, and which brands
they are mentioning in their lyrics/how frequently they are being mentioned.
Aim 2: Provide a comparison between Genres to see what brands/types of brands are
mentioned and how frequently they are mentioned.
Aim 3: Allow users to search for brands/artists to see where they are popular and with
which artists/genres they are popular with.

 5
Aim 4: Generate lyrics based on a style of genre, using a machine learning algorithm.
Perform the lyrics using a text to speech tool over a backing track.
Aim 5: Find out if there is a statistically significant difference between the genres when
it comes to frequency of brand mentions.
Aim 6: Find out if there is a statistically significant difference between the genders
when it comes to frequency of brand mentions.
Aim 7: Determine if there is a correlation between frequency of brand mentions and
Google trends data.

1.4. Technology
Python 3.8 – Python is a high-level, general-purpose programming language. Python is
used to connect to the API to download datasets. The Neural Network will be created in
a Python Notebook.
TensorFlow – TensorFlow is an open-source software library for machine learning. I will
be using it to build the neural network for the lyric generation aspect of the project.
R – R is a statistical computing programming language often used in the world of data
science. R will be used to web scrape data to create our list of brands dataset. It will also
be used to perform statistical analysis on our finished data set.
Alteryx – Alteryx is a data manipulation tool which allows for data transformation, data
mining and visualization. Alteryx is used to parse the JSON files downloaded from the
API and mine through the data for mentions of brands. It will also upload the data to our
SQL server.
Tableau – Tableau is a data visualisation tool focused on business intelligence. It is used
in this project to visualize our data after we have processed it and stored it in our data
warehouse.
Microsoft SQL Server – Microsoft SQL Server is a relational database management
system. Once the data is processed, it will be stored here for use for Tableau and R.
Genius API – This is an open API from Genius.com, it allows connection to their database
so users can request data on any artist.
CRISP-DM – Stands for Cross-industry standard process for data mining. It is an
approach for data mining. It is the most widely used analytics model.

1.5. Structure
I will first address the data used in the project, where it is drawn from and the schema of
it. I will then focus on my methodology and how I went about formatting and analysing
my data. Then I will explore the findings within the data, share the results and state my
conclusions based on my tests.

 6
2.0 Data
Genius API

Initially when I had the initial idea for the project, I assumed I would need to web scrape the lyrics
using R. I was familiar with the website Genius.com, from looking up music lyrics. Genius.com hosts
music lyrics from nearly every music artist. When researching the project, I did a google search to
see if others had tried web scraping from Genius.com, this is when I became aware of the Genius
API. It is an open API which allows users to connect to it through a Python script and can be used to
download data from any artist hosted in its database.

Once the script is finished running, it will drop a JSON file in the directory of the Python script. The
JSON file contains a vast amount of data, including the lyrics. The JSON files tend to be around
15000/20000 lines. It will need a lot of pre-processing in order to mine the lyrics for brand mentions,
this will be done within Alteryx.

My entire dataset was 209 individual JSON files, one per artist. Each file contained the lyrics to 40
songs per artist, which works out as 8,360 songs. The breakdown per genre is 103 Rap artists, 55 Pop
artists and 51 Country Artists.

Brand List

The other dataset used in my project I have compiled from scratch. To get a dataset of some of the
most popular brands, I web scraped lists from multiple sources online using R programming
language with the rvest and dplyr packages. The different sources were:

 - Various Luxury Brands: https://en.wikipedia.org/wiki/Category:Luxury_brands
 - Beer: https://eu.usatoday.com/story/money/2019/06/19/beer-brands-americas-31-most-
 popular-beers/39490347/
 - Tobacco: https://brandirectory.com/rankings/tobacco/2017/table
 - Whiskey: https://vinepair.com/articles/20-most-popular-whiskey-brands-america-2018/
 - Clothing: https://www.endclothing.com/eu/brands
 - Soft Drinks: https://en.wikipedia.org/wiki/List_of_brand_name_soft_drink_products
 - Miscellaneous Brands: https://ig.ft.com/top-100-global-brands/2018/

Once the data was scraped in R, I added them all to a singular csv file. The final dataset had three
columns, one for the actual name of the brand, one for the word it is looking for in the lyrics and the
last column categorised the brand (car, clothing etc.). The list required some manual intervention
regarding adding nicknames for some brands. It is not uncommon for brands to be referred to by
names other than their proper name. To name a few, “Lambo” for Lamborghini, “Rollie” for Rolex
etc. I had to go add these in manually to the best of my knowledge. The final dataset looked for 175
different mentions of brands within the lyrics. The dataset was stored within the Alteryx workflow
which checks for the mentions.

Google Trends
For my analysis section I will be checking if there is a correlation between frequency of
mentions in lyrics and popularity with google searches. To check this, I will be downloading
trend data from google trends. This comes in a CSV format, with a breakdown of popularity
on google from all 50 states in the USA. It ranks the popularity of a score out of 100.

 7
3.0 Methodology
For the project I will be using CRISP-DM. It is a six-phase model which has business needs at the
heart of it. As my project could have real world value for businesses, I felt it was appropriate to
choose this model. My project consists of two separate components, the lyrics analysis and the lyrics
generation, I will do CRISP-DM for each separately.

Business Understanding
Lyrical Analysis – The end goal from a business standpoint is to create a tool which allows lyrics from
an artist to be analysed and checked for brand mentions within seconds. We want to create a
relational database from the JSON files which we have downloaded from the Genius API. We want to
then visualise the final dataset on an interactive Tableau dashboard which will give insights into
which artists/genres the brand is popular with and where geographically the brand is getting the
most mentions.

Lyrical Generation – The end goal from a business standpoint is to create a Python script which is
capable of mimicking the style of a certain genre’s lyrics and output them with the click of a button.

Data Understanding
Lyrical Analysis – We will collect all our data related to artist’s (lyrics, gender, genre etc.) by
connecting to the Genius API using a Python script. The dataset is 209 different JSON files, each
containing the data for a single artist. The data will require a lot of preparation in order to be
analysed for brand mentions. We will need to create a dataset which contains all the brand names
which are being looked for. I will do this by web scraping multiple sources which have lists of popular
brands and combining them all into one cell.

Lyrical Generation – For our lyric generation, the only input dataset that is required is a .txt file
which contains the lyrics for it to train on. We will create this dataset by taking the lyrics out of the
JSON files for the artist and outputting it as a .txt file.

Data Preparation
Lyrical Analysis – In each JSON file there is a huge amount of redundant data which is not relevant to
the project, we will need to select the data which pertains to the lyrics, artist name, song year and
description of the artist as that will contain all the data we require for our project. We will then need
to take the lyrics from the JSON file, tokenize and clean the data, which will be done in Alteryx.

Lyrical Generation – We will take out the lyrics from the JSON files and output them as .txt format.
We will host the dataset online for our neural network to connect to.

Modelling
Lyrical Analysis – For the brand analysis we will build a model which checks the words in the lyrics
and searches for patterns which contain the brand mentions.

Lyrical Generation – We will use a Long Short-Term Memory Recurrent Neural Network for this. We
have chosen this as it has a proven track record in generating speech, as it has an onus on the
sequence in which words are generated.

Evaluation

 8

Lyrical Analysis – We will evaluate our lyrical analysis by seeing how much data we have in our final
dataset. I will manually check the accuracy of a few artists to check for false positives and adjusts the
model accordingly.

Lyrical Generation – We will assess this by checking our loss figure. The lower the loss, the more
accurate the predicted text is to the input dataset. We will reduce the loss by adjusting the number
of epochs the model trains.

4.0 Implementation

 4.1. ETL
To create our data warehouse with the brand mentions and information for each artist
using ETL, we must extract our data from multiple sources.

Extraction
Connecting to Genius API with Python
The first step of the project is to gather our dataset of our JSON files by connecting to the
Genius API. The Genius API has a lot of documentation and plenty of resources online to
help you with using it which was ideal for the project as I had no prior knowledge of it. The
only thing that was required before using the API was to generate an access Token to
connect to it. This was free and all it required me to do was create an account on their
website. Once I had my key to connect to the API, I was free to write my Python script which
looked like this:

Fig.3 Python script connecting to the Genius API

 9
First, we import the LyricsGenius Python client for the API and use add in our access token
which we received by creating an account on the Genius website. The next step is to select
our artists and assign them to “artist_name”. Then we connect to the API again using our
credentials and import the working directory. We then search for the artist’s name in the
API and set the max number of songs it will download the lyrics for to 40. The script will
start search for the artist and start listing the songs until it reaches its 40-song limit.

Fig.4 Python script connected to the Genius API listing artist’s songs

It will take a couple of minutes for each artist to complete. Once the script is finished
running, it will drop a JSON file into the working directory. One issue I ran into while
completing this step is that the connection to the API can time out and stop working. This
had a few ramifications that I had to work around. Originally, I had the script set up that it
collects all the artists songs then saves the lyrics.

Fig.5 Original Python script structure

However, when a timeout occurred while searching for artist’s songs, none of the previous
artist’s it had searched for would be saved. I worked around this by saving the JSON file
immediately after searching like in figure 3.

 10
Fig.6 An example of the connection to the API timing out

Another ramification this had was that I could not make one Python script which contained
every artist I wanted to analyse for my project. This meant I had to create many scripts with
10 or so artists and re-run it from the artist that the timeout occurred if one did occur. This
meant that the collection of JSON files was rather time consuming, the script took up to
20/30 minutes to run for 10 artists, I would also have to supervise it as opposed to letting it
run without interruption. This meant that the collection of JSON files was a couple days
work. Once we had ran all the Python scripts, we had 209 JSON files from different artist’s.

Fig.7 Folder hosting the downloaded JSON files

 11
Once we had our artist related data downloaded from the Genius API, we needed to create
our list of brands to search for within the lyrics.

Web Scraping Brand List
This was another rather time-consuming part of the project. I tried to find suitable datasets
online which contained brand names that I could use for the project on websites like Kaggle.
There were several CSV files which contained millions of brand names, most of which I had
not heard of before and were not relevant to the project. After failing to find a premade file
which I could use, I decided that I needed to create the dataset myself. I had originally
planned on web scraping the music lyrics, so I had researched prior on how to do this. I
performed the web scraping in R-Studio.

Fig.8 R script web scraping the list of tobacco brands

This was achieved using the ‘rvest’ package which allows web scraping to be done. We then
use the ‘dplyr’ package in order to organise the data into a data frame. The web scraping
itself was a quick process but getting suitable lists to web scrape from different part of the
web was a challenge. Once the web scraping had taken place, we would be left with a
dataset like this:

 12
Fig.9 List of fashion brands after being web scraped in R

This is only step one for our brand list dataset. As our data mining model can only check one
word at a time, we have to choose one word which the model will look for. This was done by
me manually. For example, a brand that was frequently mentioned was the fashion brand
“Maison Margiela”. I had to have a cell with only “Margiela” in it for the model to check for
in the lyrics. As well as that, I added another cell of what category the brand is in.

Fig.10 Sample of our brand dataset

 13
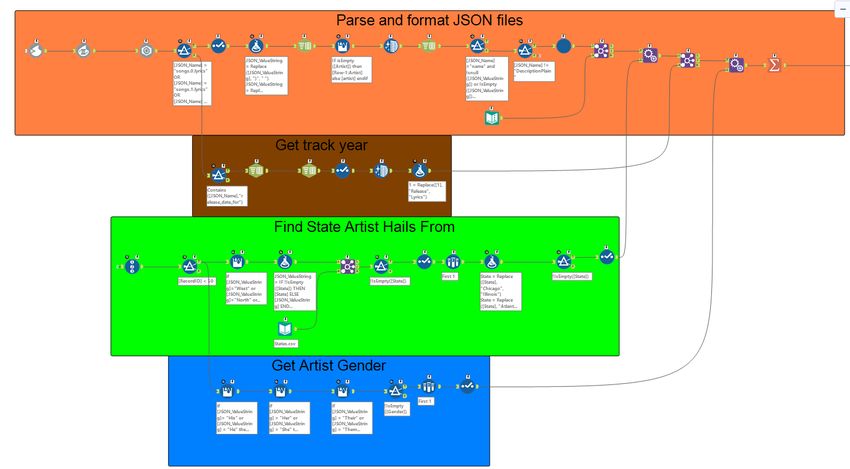
As above, the left column is what is being checked for in the lyrics. Another factor I had to
consider was that often in lyrics brands will be referred to by a nickname. I had to add the
nicknames to brands manually to the best of my ability, this meant from my own knowledge
and also reading through some lyrics from my dataset. I stored this dataset within the
Alteryx workflow

Transform
Alteryx Workflow

Fig.11 Alteryx Workflow Layout

There are four separate parts of my workflow as labelled. Each gets a different piece of data
relevant to the project, that we can use for our analysis. During my internship I had a lot of
experience using Alteryx, so I did not need to learn it from scratch. The first challenge I
faced when building the Alteryx workflow was it does not accept JSON files as input with the
standard input tool. This meant that I had to input the JSON file as a blob and convert the
blob to a text and finally use the JSON parse tool to parse it. This left us with our data like
this:

 14
Fig.12 JSON parsed in Alteryx

In the above example, there are 15,030 rows. All the JSON files had similar amounts of rows,
the vast majority of them being redundant and not useful for the project. The next step was
to select only the rows which we needed. This required me to go through the file structure
and find out where the relevant data is stored. We do this by selecting the cells in the
“JSON_Name” Column using a filter tool. I will break this down for each section of the
workflow.
Brand mentions – We need the column that relates to the lyrics and the artist’s name.

Fig.13 Filter tool configured to pick the relevant data

Once we have our relevant data, we need to break it down to single cells per word in order to allow
it to be searched through for the brand mentions. We start this by splitting the cells to rows, using
the space between words as a separator.

 15
Fig.14 Data after being split to rows, highlighted is a brand mention (Birkin is a bag produced by Hermès)

Once we have each word in a cell, we filter out the blank cells and remove all punctuation
and other symbols. We also need to add a column for the artist’s name, which is contained
in one of the cells we have selected.

Fig.15 Our data ready to be searched through for bran mentions

 16
We are then left with our data ready to be searched through for brand mentions. Once our
workflow has identified the brand mentions by checking it against our other dataset that we
created we are left with the following:

Fig.16 How our data once the brand mentions within the lyrics have been identified

In the above sample, our model identified 120 brand mentions within the 40 songs from the
artist’s “City Girls”. We will then count how many times each brand is mentioned per song.

Year Song was Released – The next thing we need to do is to get the year the song was
made, as some of our analysis will focus on brand mentions over the years. In the
“JSON_Name” column each song has its own unique number in between “Songs” and
“Lyrics”. In our JSON file we also have the year the song was made in the following format.

 17
Fig.17 Release date of songs within the JSON file

We start by splitting the “JSON_ValueString” Column and using the comma “,” as a delimter.
This leaves us with only the year in a column. In order to join the year with the brand
mentions dataset we need to do it by the JSON_Name column. We again split that but use
the underscore “_” as a delimiter. We then remove the punctuation and replace the word
“release” with “Lyrics”

Fig.18 Song year with the corresponding song lyrics identifier

We can then use a join tool and combine this with our brand mentions dataset.
Artist’s State – My project focuses on artists from the United States of America. I will be
visualising the data on a map of the USA, so it is necessary to get the artist’s state that they
are from within the data. This is not found in a single cell like the artist’s name or lyrics, so I
had to be a little bit creative with how I found the artist’s state. There is a cell within the
parsed JSON which has a blurb written about the artist which usually mentions where the
4artist hails from within the first few lines. I filtered out this cell and broke it down into

 18
single words per cell with the same method as seen above. Here is an example of how it
looks:

Fig.19 Artist description broken down cell by cell

The workflow will then search through the words for a state, in the above example we can
see in cell 12 contains the data we are after. Once we have the state, we create a column for
it and append it onto the brand mentions table we have.
Artist’s Gender – Another piece of the analysis of the final dataset will focus on the gender
of artists. We will split them into Male, Female and Group (multiple members). In order to
get this, we use the above dataset of the blurb broken down into single words. The
workflow then checks to see what pronouns are being used to describe them. If it finds
he/him it will categorise the artist as male, if it finds she/her then female and they/their it
will categorise them as a group. In our sample City Girls are a group, here is what we have at
the end of this section of our workflow:

Fig.20 Artist’s gender has been found

The last piece of information is the genre. This is not held anywhere within the JSON file, so I
had to make three separate workflows for each genre I will be analysing. At the end of the
process the workflow adds a column with the genre in it (Rap, Pop or Country).

Load
Once we have all of our relevant data, we can upload it to our SQL Server. This can be done
directly within Alteryx as it has the capability to connect to Microsoft SQL Server.

 19
Our database contains 2 tables. One for artist’s data called “Artist” and one for the brand
mentions called “Brand”.

Fig.21 Entity-Relationship Diagram for our data warehouse

With our Artist table we ended up with 186 artists, as some of our 209 had no brand
mentions that were found.

Fig.22 Artist table in our database

Our Brand table contains 4,763 rows, with a total of 11,233 brand mentions overall.

 20
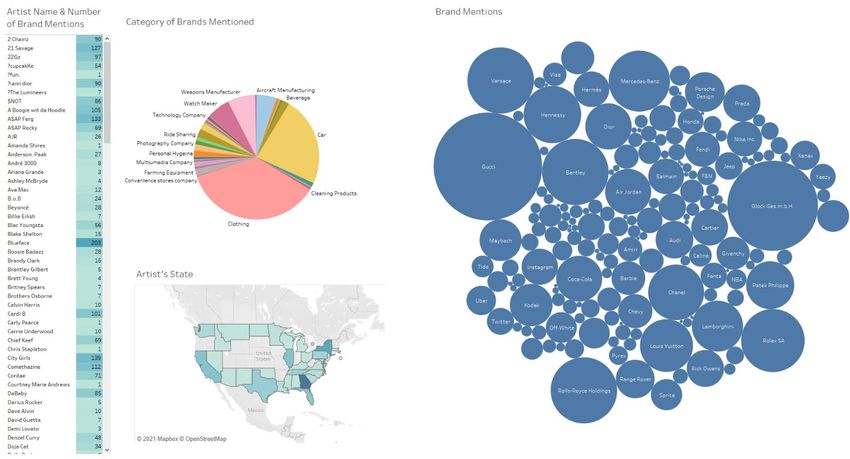
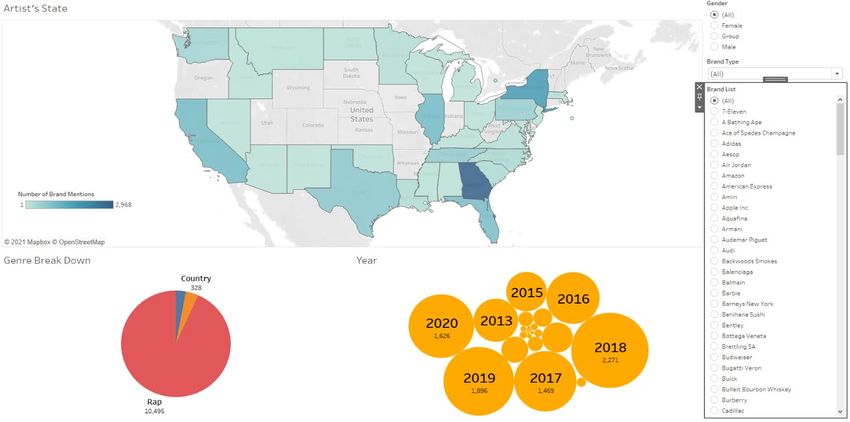
Fig.23 Brand table in our database

This is the final dataset I will be using for my analysis and visualisation. It is hosted on a
Microsoft SQL Server.

 4.2. Visualisation
To visualise the final dataset, I will be using Tableau. Data visualisations are an essential part
to communicating the results of findings of this project. My Tableau dashboard is a critical
element for the completion of my project. This is where marketing departments can jump in
and delve through the brand mentions.

Fig.24 Tableau Dashboard 1

 21
In figure 24 is the first Tableau dashboard, which focuses geographically where brands are
being mentioned the most. It has a breakdown of genre using a pie chart and a breakdown
of year using a bubble plot. On the right is some filter tools, one containing all the brands
found within the lyrics. If an employee from a company’s marketing department wanted to
see where their brand is mentioned most frequently by state, genre, year, they could select
their brand from the list and see all the breakdowns.

Fig.25 Tableau Dashboard 2

Figure 25 contains the second dashboard which is linked to the first dashboard. This
dashboard is more artist focused. It shows the number of mentions each artist has. Category
of brands are broken down is visualised in a pie chart.

 22
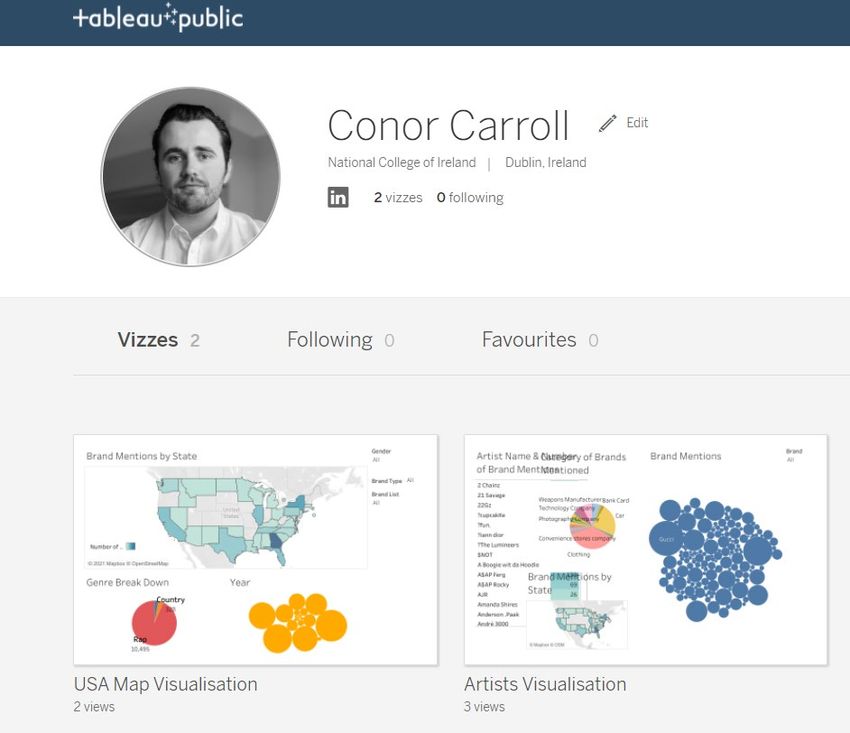
Fig.26 Tableau Public Profile

The visualisations are hosted on my Tableau Public profile and can be found at the following
link:
https://public.tableau.com/profile/conor.carroll1079#!/

 4.3. Neural Network
For the creation of our text generation machine learning script, we will be using Python with
the TensorFlow package and creating a Recurrent Neural Network (RNN). The reason why
we choose a RNN is because it recognises the sequence in which the letters are input. In
language, the sequence of our words in a sentence is of the upmost importance hence why
a RNN is appropriate for our task at hand (Karpathy, 2015). For my project I will be using the
Python notebook created by TensorFlow and tweaking it to create music lyrics in the style of
rap, pop and country.

 23
The first thing we must do in our Python script is import TensorFlow and our dataset which
is a txt file containing the lyrics.

Fig.27 Importing TensorFlow and downloading our dataset

The next step is to process the text, we begin by vectorizing the text. The text is split into
tokens and the characters are converted to numeric ID. Once we have the text processed,
we need to divide the text into sample sequences for the model to train on, We do this by
converting the text vector into a stream of character indices.

Fig.28 Text being converted to a stream for model to train on

The next step is to create a training dataset of input and label. Input and label are
sequences, the model will look at the original input and learn what the next characters are
going to be based on the label.

 24
Fig.29 Text being converted to a stream for model to train on

After this we split our data into manageable sequences, we also must rearrange the data
and format it into batches.

Fig.30 Text converted to trainable batches

 25
Once we have our text processed, we then need to move onto building the model. There are
three layers to the model, the input layer, an RNN layer and the output layer.

Fig.31 Three layers of our model

The next step is to attach an optimizer and loss function. This will allow our model to
attempt to minimise loss and increase accuracy of our output.

 26
Fig.32 Adding loss function

We then have to specify the number of epochs to train the model. I will be exploring the
optimum amount for each genre in the conclusion section. Once we specify the epoch
number, we allow the model to run through and train on the data.

Fig.33 EPOCH training

Once we have completed the preceding step, our model is trained on our input data. We are
ready to generate our lyrics, to do this we run the model in a loop. Each time the model is
called we pass in text and check the internal state. The model returns a prediction for the
next character and continues on doing this, generating a batch of text.

 27
Fig.34 Model outputting text

The process is repeatable for each genre, the only thing we must change is the input txt file
to have the lyrics for the corresponding genre. Each run of the above cell will produce a new
block of text in the style of the genre.

5.0 Analysis
Correlation Test of Brand Mentions vs Google Trends
I will be conducting an analysis on the final dataset to see if there is a correlation between
the frequency of brand mentions in a state and the popularity on Google based off Google
trends data. In order to do this, I calculated the top 10 most mentioned brands grouped by
state and year, which left me with the following dataset.

 28
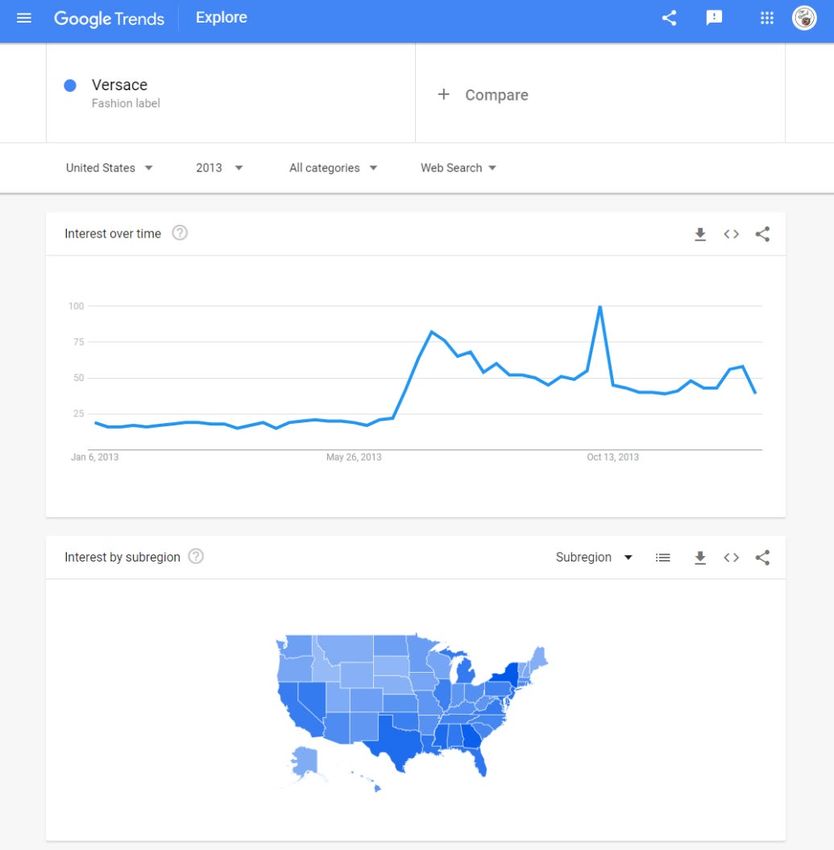
Fig.35 Top 10 most mentioned brands by state/year

I then needed to get the related data for search queries from Google Trends. Google Trends
allows users to search by year/subregion for popularity of a search query.

Fig.36 Search popularity for Versace for the year 2013

You can then download a csv file which ranks popularity for search query on a scale from 0-
100. Here is the schema of the csv file.

 29
Fig.37 csv file schema from Google Trends

We then Join this with our original dataset and get a column for the search popularity. Once
we have done this, we are left with the following dataset which is ready to be analysed.

Fig.38 Dataset ready to be analysed

 30
In order to test for correlation, I will be performing a Pearson’s Correlation Coefficient
(Pearson’s r) test within R studio. This is a measure of linear correlation between two
variables. To determine the strength of the relationship between the two variables we will
see if a statistically significant correlation can be observed.
Pearson’s Correlation Coefficient formula:

Fig.39 Pearson’s Correlation Coefficient

In figure 39 is the formula which is used to measure for Pearson’s r where:
r = Correlation coefficient.
N = The number of observations which occur.
∑xy = Sum of products of paired scores.
∑x = Sum of x score.
∑y = Sum of y score.
∑x2= Sum of squared x scores.
∑y2= Sum of squared y scores.

Comparison of Brand Mentions by Genre
Another piece of analysis that will be conducted will be a test to see if there is a significant
difference between the amount of brand references by each genre. For this we will be
performing a Kruskal-Wallis H Test in r programming language. Kruskal-Wallis test is also
known as Non-Parametric Anova, as it an alternative to One-way Anova for non-parametric
datasets.
In order to do this, we will be taking a sample of 40 artists from each genre and summing
their total brand mentions across the 40 songs from each artist. We are then left with a
dataset with the following schema:

 31
Fig.40 Sample of our dataset ready for Kruskal-Wallis H test

The first thing we need to do before performing our Kruskal-Wallis test is to check each
variable to see if it is non-normally distributed. We start by visualising the distribution with a
QQ Plot.

Fig.41 Q-Q Plot for all 3 variables

 32
Once we have confirmed our dataset is non-normally distributed, we can perform our test
with the following formula.

Fig.35 Kruskal-Wallis H test formula

Where:
n = sum of sample sizes for all samples
c = number of samples
Tj = sum of ranks in the jth sample
nj = size of the jth sample

Male vs Female Brand Mentions in Rap
I will be comparing if there is a statistical difference between the amount of brand
references for male and female artists in the rap genre. In a research Article titled
“Hegemonic Masculinity in Hip-Hop Music? Difference in Brand Mention in Rap Music Based
on the Rapper's Gender” (Mohammed-baksh and Callison, 2015), they conclude that male
artists had significantly higher amount of brand references within their lyrics when
compared to their female counterparts. They tested this on a dataset of 200 songs. In my
analysis I will be taking 10 female rappers and 10 male rappers with 40 songs each, a total of
800 songs. I will perform a T-test in order to determine if there is a significant difference
between the number of mentions between the two groups. Again, we must check for
normality between the two groups. When performing a Shapiro-Wilks test for normality in r,
we get the following results.

Fig.42 Results of normality test in r

 33
As our P-value is above 0.05 we can accept that our data is normally distributed, we can
continue with our T-test. The formula for the T-test is as follows.

Fig.43 T-test formula

Where:
 is the mean for sample Group 1
 is the mean for sample Group 2
 is the mean for Population 1
 is the mean for Population 2
 ^ is the variance of Group 1
 ^ is the variance of Group 2
 is the number of participants in Group 1
 is the number of participants in Group 2

6.0 Results
Correlation Test of Brand Mentions vs Google Trends
For our correlation analysis we first must set out the null and alternate hypothesis.
 H0: There is not a correlation between brand mentions in lyrics and Google Trends data
 H1: There is a correlation between brand mentions in lyrics and Google Trends data
We are calculating Pearson’s r value, so the null and alternate hypothesis is.
 H0: r = 0
 H1: r =/= 0
When we run the test in R-studio, we get the following output:

 34
Fig.44 T-test formula

This gives us an output of an r value of 0.48, this would imply a moderate correlation
between the two variables. As the r value is above 0, we can reject the null hypothesis and
accept the alternate hypothesis as true.
We can visualise the results on a scatterplot within R-studio, which gives us the following
output visual.

Fig.45 Scatterplot showing correlation between the two variables

Comparison of Brand Mentions by Genre
For our Genre comparison analysis, we will set out the null and alternate hypothesis:
 H0: There is no difference in amount of brand mentions in lyrics of rap, pop and country
 H1: There is a difference in amount of brand mentions in lyrics of rap, pop and country
The null hypothesis is expecting the mean value of each genre to be the same.
 H0: μ Rap = μ Pop = μ Country
 H1: μ Rap =/= μ Pop =/= μ Country

When we perform our Kruskal-Wallis H test, we will be looking for the p-value to see if the
difference in means is statistically significant. Anything below p-value of 0.05 is considered
statistically significant. Therefore, our null and alternate hypothesis for p value
 H0: P > 0.05

 35
H1: P < 0.05
The output from our Kruskal-Wallis H test in R-studio is:

Fig.46 Output of our Kruskal-Wallis test in R

Our P-value when written as a real number is 0.0000000000000003895. Therefore, we can
reject the null hypothesis and accept the alternate hypothesis that there is a significant
difference in the means of each group.
We can get some insight into the difference in each group by using some visualisations
Boxplot of three groups

Fig.47 Box Plot of the three genres

We can see the pop and country have relatively similar amounts of brand mentions;
however, rap has a significantly higher amount of brand references within its lyrics.
Histogram for each group

 36
Fig.48 Rap histogram

Fig.49 Pop histogram

Fig.50 Country histogram

 37
Pie chart for category of brands referenced for each genre

Fig.51 Rap pie chart showing different brand categories mentioned

 38
Fig.52 Pop pie chart showing different brand categories mentioned

Fig.53 Country pie chart showing different brand categories mentioned

 39
Male vs Female Brand Mentions in Rap
For our gender comparison analysis, we will set out the null and alternate hypothesis:
 H0: There is no difference in amount of brand mentions in the lyrics of male and female
 artists
 H1: There is a difference in amount of brand mentions in the lyrics of male and female
 artists
 The null hypothesis is expecting the mean value of each gender to be the same.
 H0: μ Male = μ Female
 H1: μ Male =/= μ Female

When we perform the t-test, we will be looking for the p-value to see if the difference in
means is statistically significant. Anything below p-value of 0.05 is considered statistically
significant. Therefore, our null and alternate hypothesis for p value
 H0: P > 0.05
 H1: P < 0.05
When we run our t-test in R-studio, we get the following output.

Fig.54 R-studio output for t-test

As our p-value is above 0.05 we can accept the null hypothesis as true.

Fig.55 Histogram for female and male artists

 40
7.0 Conclusions
 7.1. Problem Addressed
The main problem I set out to address at the start of this project was to create a tool which
can be used to quickly identify brand mentions within music lyrics. I achieved this by
downloading data from the Genius API, the data is then transformed using Alteryx workflow
and checked for brand mentions. It is then loaded onto a Microsoft SQL server.
I also set out to answer several research questions with our dataset, which I achieved by
using our final dataset and running statistical analyses on it using r programming language.
The last problem I addressed was to get a machine learning model to generate music lyrics
in the style of the genres analysed in our data. This was done by using a Recurrent Neural
Network in Python programming language

 7.2. Testing
Brand mentions
When testing the results of the final dataset, I manually went through the data to find
where the matches were found, and I noticed some false positives. There were certain
brands which were causing issues with the matches, mainly brands which did not have a
unique word that could be looked for within the lyrics. Some examples are Lucky Strike
(cigarettes), Chrome Hearts (clothing), Southern Comfort (Alcohol) among others. As the
model only checks one cell with one word at a time the issue was looking for “Hearts” for
chrome hearts would show a match when an artist simply was using the word heart in their
lyrics.
In order to resolve this, I had to create a macro within Alteryx to alleviate the false positives.
The macro will check if a cell contains one of the words from the brands giving false
positives, lets for our example take Chrome Hearts. If the macro finds a cell with the word
“Hearts”, it will check the previous cell and see if it says the word “Chrome”. If it finds the
two words beside each other, it will merge them to one cell containing both words. This
allowed us to search for two words and got rid of a large issue with false positives.

Fig.56 Expression to check for Chrome Hearts

We then repeated this process for all other brands with the same issue.

Lyric Generation
For our lyric generator, the Neural Network measures its accuracy by measuring the loss of
the predicted text. The lower the loss, the more similar the text is to the input dataset.
What determines the loss is the amount of training that the number of epochs we set the
model to go through. An epoch is one cycle of full training through the dataset. There was
some trial and error with each model for each genre, in finding the optimum number of

 41
epochs to minimise loss. In the end this was the optimal number of epochs for each genre’s
dataset.

Table 1 Optimum number of epochs

 Genre Epochs Loss
 Rap 60 0.0673
 Country 59 0.0694
 Pop 15 0.0631

 7.3. End Products
Brand mentions
The final product from this part of the project is a relational database which has analysed
the lyrics of over 8000 songs. It contains all the brand mentions within our list of brands and
also contains the gender, genre and home state of the artist. As well as this, there is a
workflow which allows users to add many more artists and lyrics to the database with the
click of a few buttons and some changing of code.
The results of the initial dataset analysis are also visualised on a Tableau dashboard which
can again be found here:
https://public.tableau.com/profile/conor.carroll1079#!/

Lyric Generation
For this section of the project, there is a Python script which accepts a txt file with lyrics and
will recreate its own lyrics in the style of the genre. I have used a text to speech tool to
perform the lyrics over a backing track to each genre. It can be found here:
https://youtu.be/mEDt829mq40

 7.4. Strengths and Limitations
Strengths
A huge strength of my project is that it integrates JSON files from the Genius API.
Genius.com host the data for almost every single musical artist of note meaning that with
more time, the number of songs/artists lyrics that can be analysed is almost infinite. The
model itself will not require any extra tweaking to parameters or any changes to workflow
etc. it is ready to work with the JSON files as is.
The Alteryx workflow also uploads directly to the Microsoft SQL server, which the Tableau
dashboard draws its data from for the visualisation. This means that if more artists/songs
were to be analysed, they would automatically update the Tableau dashboard and be
visualised instantly upon running.

 42
Another strength is that it could be tweaked to check for anything, not only brand mentions.
For example, if someone wanted to conduct a research on the amount of curse words used
within music lyrics, it would require changing out the brand mention dataset for a list of
curse words to search for. The workflow is highly adaptable and can have many uses beyond
the scope of analysing brand mentions.

Limitations
The main limitation of my project is that the JSON files must be manually ran through the
Alteryx workflow one at a time. Running multiple files that are accepted in the normal input
tool in Alteryx which accepts csv, txt, Excel etc. is easily done. However, due to the nature of
the JSON files they have to be read in as blobs and the usual method of running multiple
files in the one folder location does not work. I tried for many hours and did a lot of
research about ways to run multiple files but did not have any success.
Another limitation is with the list of brand names. I could not find a resource which
contained lists of brand nicknames that was suitable for the project. I had to manually add
them as best I could. In the end the model identified over 11,000 brand mentions in 8,000
songs which was a good return, but I feel more could have been identified with a more
complete list of brand nicknames.

 7.5. Key Findings
Google Trends and brand mentions are moderately correlated
After conducting our Pearson’s correlation test, we received an r value of 0.48 which can be
deemed a moderate positive correlation.

Fig.57 Pearson’s coefficient chart

The positive relationship means that as brand mention frequency rises, so do Google Trend
figures. However, it is only a moderate correlation, and our scatterplot does not show much
correlation between the two.

 43
Rap Music has significantly more mentions of brands than pop and country
From running our Kruskal-Wallis H test, we got the result that the mean mentions of brands
from 40 artists across 3 genres was significantly different. When we plot our data on a box
plot in figure 47 it is evident that rap music has a much higher mean than the other two
genres. It also contained the most outliers.

Male and female rap artists mention the same number of brands on average
The results of our t-test showed that the difference between the mean of a sample of 10
female and male rap artists was not statistically significant. The histograms of both variables
were fairly similar, and we had a p-value of 0.092. This contradicts the findings put forward
by Mohammed-baksh, S. and Callison, C in their 2015 report. They claimed that men are
more likely to mentioned brands within their lyrics than women. Their dataset was ¼ the
size of the dataset I have used, so I would argue that my analysis gives a better
representation.

8.0 Further Development or Research

 8.1. More artists/genres
With additional time on the project, I would like to include more artists to analyse the lyrics
of. It is quite time consuming to input all the names into the Python script and run the files
through the Alteryx workflow. My project currently analyses 8,000+ songs for 200+ artists
across 3 genres, however the analyses tool is made and the “hard part” of the project is
done. With additional time it could be used to analyse many more genres, artists, songs as
all the data that is required is available on the Genius API it just needs to be extracted and
ran through the rest of the process.

 8.2. Bigger Brand List
With additional time and resources, I would create a bigger list of brands and include more
brand nicknames. I know there are some matches being missed due to them being
referenced as nicknames within the lyrics. I would like to find a way to add these to the list
without having to do it manually. Given enough time however, I could add it manually
although this would be time consuming.

 8.3. Accept user input
Another route I would like my project to go down is to have a GUI which asks a user to enter
an artist’s name. The user would click run and the JSON file would be downloaded, analysed
and visualised. I researched how to achieve this; it is possible to do it using Power Automate
on the Microsoft apps. The Python script could email the JSON file after downloading it,
Power Automate can be triggered by the email and run the file through Alteryx. Alteryx
automatically uploads to the finished data to an SQL server, which Tableau is connected to
so it is automatically visualised.

 44
8.4. Animated tableau dashboard
One feature to the visualisation which I would like to achieve with additional time is to
animate some of the visualisation on Tableau. This would just be to add some creativity to
the visualisation and add some entertainment factor.

9.0 References
Sunset, B., 2008. OBEY YOUR THIRST CAMPAIGN (1998). [Blog] Marketing Campaign Case
Studies, Available at: http://marketing-case-studies.blogspot.com/2008/05/obey-your-
thirst-campaign-1998.html
Roberts, G., 2009. Rap stars lose taste for Cristal after owner's attack on 'bling'. The
Independent, [online] Available at: https://www.independent.co.uk/arts-
entertainment/music/news/rap-stars-lose-taste-cristal-after-owner-s-attack-bling-
6098086.html
Hore-Thorburn, I., 2020. HERE'S HOW GUCCI MANE WENT FROM CEASE AND DESIST TO
PARTNERSHIP WITH GUCCI. Highsnobiety, [online] Available at:
https://www.highsnobiety.com/p/gucci-gucci-mane-partnership-interview
Kelly, C., 2020. Why brands are doubling down on hip-hop talent. [online] Marketing Dive.
Available at: https://www.marketingdive.com/news/hip-hop-brand-campaigns-
2020/574585
Fortune. 2017. This Is the Most Name-Dropped Brand in Music. [online] Available at:
https://fortune.com/2017/08/18/name-brands-pop-music-rap
Craig, C., Flynn, M. and Holody, K., 2017. Name Dropping and Product Mentions: Branding in
Popular Music Lyrics. Journal of Promotion Management, 23(2), pp.258-276.
Karpathy, A., 2015. The Unreasonable Effectiveness of Recurrent Neural Networks. [Blog]
Andrej Karpathy blog, Available at: http://karpathy.github.io/2015/05/21/rnn-effectiveness
Mohammed-baksh, S. and Callison, C., 2015. Hegemonic Masculinity in Hip-Hop Music?
Difference in Brand Mention in Rap Music Based on the Rapper's Gender. Journal of
Promotion Management, 21(3), pp.351-370.

 45
10.0 Appendices
 10.1. Project Plan

Fig.58 Original Gantt chart for the project

 10.2. Reflective Journals

 Software Project Reflective Journal
 X14535037 – Conor Carroll - October

This month has mainly been one for researching about my idea for the project and learning more
about the technologies that I am planning to use; I am going to write this journal under each
heading.

Research:
Originally when I came up with my idea, in my head I had the idea to use web scraping to get data
from Genius.com, it was only when I started to research this that I found out they have a public API
which grants users access to the metadata contained on the website. I have read through some
documentation for the API as part of my research, the website contains lots of information on
navigating the API which I am sure will come in handy.

I have also been researching to see if there was anything like my idea done before. In my research I
came across a couple articles with infographic pictures regarding brands mentioned but nothing
interactive and on the scale of my own project. I came across two YouTube videos which were close
to the machine learning part of my own project. One video took a dataset of rap lyrics and then
created its own, the other video used a text to speech tool to mimic the voice of musician Billie
Eilish. From my research, I could not find anything which put the two aspects together.

 46
Learning:
For the project I decided to use Python, this is because it seems to be popular on most job
descriptions for roles, I am interested in. I have no prior experience with Python, so I am learning
from scratch. I bought a Udemy course, and I am going through the videos, I am about 2 of 8 hours
in and so far, I am finding it quite good and intuitive. As well as Python, I am going to use Alteryx for
some data cleansing etc. I used Alteryx heavily during my work experience over summer, so I am
fairly familiar with it. I downloaded a song lyrics data set from Kaggle.com, Then I used Alteryx to
create a workflow to single out brands within the lyrics from certain artists. I did this just as a proof
of concept and managed to do it easily enough.

Going forward, I am going to meet with my project supervisor to get some feedback from them and
then create a plan with a timeline. This coming week I plan on playing around with the Genius API
within a programme, just to get it functioning etc.

 Software Project Reflective Journal
 X14535037 – Conor Carroll
 November

Proof of Concept
This month I created a very basic proof of concept to show what exactly it is I am trying to
achieve with the data. I did some handson use with connecting to the Genius API using a
Python script. The Python script downloaded a JSON file from the API which contained
metadata about the artist and song lyrics. As it was only a proof of concept I chose one
Artist, and 5 of his songs (which the script pulled at random).

Once the JSON file was downloaded, I used Alteryx to parse the file as it has a built in JSON
parser tool which I had used before during my work placement. An issue I ran into is that
the JSON parser truncates the cells with the lyrics, cutting most of it off, this will be
something I will have to figure out/research to fix. After this I parsed the data by using a
space as a delimiter and split the data as one line per word. This left me with a dataset of
lyrics with one word per cell. It is then a case of linking it to another dataset which contains
brand names and identifying the cells with the brand names. I took 3 brand names (again
just as a proof of concept) and found them in the lyrics dataset. This Alteryx counts how
many times the word appears in the dataset and the end result looks something like this:

 47
You can also read