Design, Simulation, and Evaluation of Imaging Oximeters
←
→
Page content transcription
If your browser does not render page correctly, please read the page content below
Design, Simulation, and Evaluation of Imaging Oximeters
                                     Steve Dai1, Ye Tian, Joyce Farrell2
                   Electrical Engineering, Stanford University, Stanford, CA 94305, USA

                                                     ABSTRACT

Computer simulations have played an important role in the design and evaluation of imaging sensors with applications in
remote sensing [1] and consumer photography [2-7]. In this paper, we provide an example of computer simulations used
to guide the design of imaging sensors for a biomedical application: We consider how sensor design, illumination,
measurement geometry, and skin type influence the ability to detect blood oxygen saturation from non-invasive
measurements of skin reflectance. The methodology we describe in this paper can be used to design, simulate and
evaluate the design of other biomedical imaging systems.
Keywords: Oximetry, biomedical imaging, image systems evaluation, imaging sensors

                                                1. INTRODUCTION
As consumer photography matures, more and more engineers are turning their attention to designing biomedical imaging
devices. Recently, researchers have invented attachments that transform cell phone cameras into microscopes [8, 9] and
optometers [10]. In addition, there are numerous studies demonstrating that non-invasive hyperspectral imaging of
diffuse skin reflectance can be used to date bruises[11], diagnose skin diseases [12], monitor wound healing [13] and, in
general, characterize tissue perfusion [14-17]. These two types of imaging systems, the inexpensive and ubiquitous
RGB imaging sensor and the more expensive hyperspectral and multispectral imagers, bound the range of commercially
available spectrophotometric devices that are available today.
Recent advances in sensor technology [18, 19] give engineers many new sensor design options. Simulation enables the
engineer to design and evaluate systems that take advantage of these new technologies even before they become more
economically viable. To illustrate the power of system simulation in the design and optimization of new imaging
devices, we use the Image Systems Evaluation Toolbox (ISET) [2, 3] to explore and evaluate the design of an imaging
oximeter.

                                                   2. OXIMETRY
2.1 Conventional oximeters
Oximeters are pervasive in hospital settings where they are used in a wide variety of applications ranging from
monitoring the amount of blood oxygenation during artificial respiration in surgery to weaning patients from ventilators.
They are used to monitor the health of a mother and her fetus during childbirth and to determine neonatal care after birth.
They are used to assess the viability of tissue transplants and the progress in wound healing. Oximeters are also used in
a variety of non-medical applications such as monitoring pilots at high altitudes and athletes during exercise.
The design of oximeters takes advantage of the fact that oxygenated and deoxygenated blood absorbs light in different
wavelengths[20]. Since oxy-hemoglobin and deoxy-hemoglobin have different spectrophotometric signatures [21, 22], it
is possible to quantify the ratio of oxygenated to deoxygenated blood (referred to as blood oxygen saturation or SO2) by
the ratio of the amount of light absorbed at the different wavelengths.

1
    stevedai@stanford.edu
2
    joyce_farrell@stanford.edu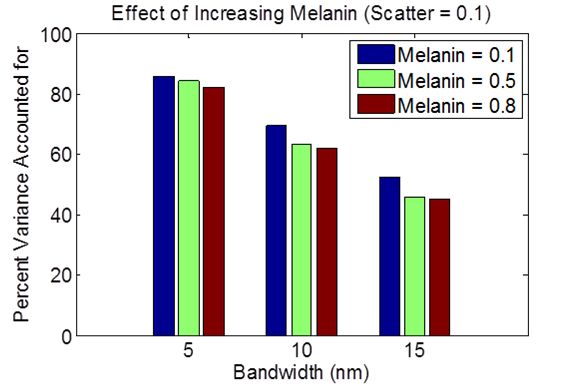
Pulse oximeters compare the amount of light absorbed at two wavelengths during the peak of the arterial pulse. The
reflected and transmitted light in one waveband, referred to as the isosbestic wavelength, does not change when
hemoglobin molecules bind with oxygen. The reflected and transmitted light in the other non-isosbestic waveband does
change when hemoglobin is oxygenated or deoxygenated. Oximeters calculate the ratio of light absorbed by the non-
isosbestic wavelength to that of the isosbestic wavelength. This ratio is invariant over a small range of skin types and
measurement geometries.
Most pulse oximeters are transmissive devices that shine light in narrow bands (typically generated by light emitting
diodes, LEDs) from one side of a finger and measure the amount of light that is received (and not absorbed) by a sensor
(typically a photodiode) placed at the other side of the finger. Reflective pulse oximeters can project light on any region
of the patient’s body and measure the amount of light that is reflected back and thus not absorbed in the body.
The oximeter signal-to-noise ratio (SNR) is determined by the power spectra of the LEDs, particularly the peak and
width of the spectral power. It is important to use narrowband lights that discriminate between the oxy-hemoglobin and
deoxy-hemoglobin spectral signatures. However the more narrow the bandwidth, the lower the SNR of the imaging
device. SNR is further reduced when other materials in skin tissue layers, such as melanin, water, fat and lipids, absorb
or scatter light.
2.2 Imaging oximeters
Pulse oximeters use photodiodes rather than CMOS or CCD spatial arrays. While all of these sensors are based on
silicon, photodiodes have higher quantum efficiency in the near-infrared (NIR) regions. The two spectral channels in a
pulse oximeter are created with LED lights. The design of oximeters has thus been limited by the spectral power of
commercially available LED lights. Typically, oximeters use an LED with peak sensitivity at 940 nm and a half-
amplitude bandwidth of 50 nm as the isosbestic channel and an LED with peak sensitivity at 660 nm and a half-
amplitude bandwidth of 20 nm as the non-isosbestic channel.
More recently, there has been growing interest in designing imaging oximeters that provide a spatial image of the
distribution of oxygenated hemoglobin. Researchers have used RGB [23], multispectral [24] , and hyperspectral
imaging systems [13, 14, 25] to visualize the hemodynamics of subsurface skin tissues. Engineers have many options for
designing imaging oximeters. They can use a monochrome sensor array with sequentially flashing LED lights [26] or
they can use a single broadband illuminant with multiple spectral filters [27]. They can use spectrally tunable imaging
sensors [15, 16] and/or a combination of different illuminants and imaging sensors. Whether spectral imagers are created
by varying illumination or the spectral transmissivity of color filters, one wonders how many spectral channels are
necessary. The answer to this question will depend on the spectral power of the illumination, the spectral transmissivity
of filters between the illuminated object and the sensor, and the spectral sensitivity of the sensor array.
In this paper we use image systems simulation technology to evaluate the design choices and tradeoffs by quantifying
the performance of two-channel imaging oximeters. We vary the peak wavelength sensitivity and waveband of two
spectral channels and analyze their performance in predicting blood oxygenation levels.

                                     3. IMAGE SYSTEMS SIMULATION
The ISET [2, 3] simulations include representations of the scenes, optics, sensors, and image processing.
3.1 Scene
The reflectance spectroscopy of human skin in the visible range of wavelengths is primarily determined by the light
absorbed by chromophores in the epidermis (melanin) and dermis (hemoglobin) and by the light scattered by cells and
collagen fibers in these two layers of skin. In fact, light reflected in wavelengths ranging between 480 nm and 700 nm
can be predicted by
                                            10                                                                          (1)

where           ,       , and        are spectral functions (Figure 1) describing the absorbance coefficients for oxy-
hemoglobin, deoxy-hemoglobin, and melanin, respectively;           ,   , and     are weights representing the relative
saturations of these chromophores; and is a factor representing the effects of light scatter [13]. We validate this
characterization of skin by fitting experimentally measured skin reflectances from 70 individuals to the model      to
obtain the weights , , and estimated for each measured reflectance. The estimated reflectances generated by
these weights are then compared to the experimentally measured reflectances. From Figure 2, we see that the estimated
reflectances are highly correlated ( 0.9982) with the 70 skin reflectances that were measured between 480 and 700
nm.
Oxygen saturation (SO2) is estimated by the ratio of the amount of oxy-hemoglobin to the total amount of hemoglobin
( / ). We expect this ratio to be constant for all healthy individuals; however the estimates for SO2 ranged
between 0.4 and 0.8. The variance in the estimates can be explained by the observation that the weights for oxy-
hemoglobin ( and melanin ( are negatively correlated ( 0.8311). Individuals with darker skin have higher
values for , as would be expected. The negative correlation between and is also expected. Melanin resides in
the superficial layers of skin. Thus, when more light is absorbed by melanin, less light reaches the deeper layers of the
skin where it can be absorbed by hemoglobin. This is the reason why oximeters are less accurate for individuals with
dark skin[28, 29].
When we only consider individuals with 0.6, the mean oxygen saturation across individuals is 0.5301. This value
is lower than one would measure using a conventional pulse oximeter. However, pulse oximeters calculate blood
oxygen saturation at the peak signal strength of the arterial pulse. The skin reflectance measurements were averaged
over time and represent the oxygen in subcutaneous arteries and veins. Our estimates are within the range of other
reported studies that estimate blood oxygen saturation from time-averaged hyperspectral images of skin [11].
The predictions of the linear skin model are consistent with our measurements of skin reflectances within the 480 nm to
700 nm window of interest (see Figure 2), but the correlation between estimated and measured reflectance decreases as
we introduce wavelengths longer than 700 nm where water and lipid absorb relatively more light. For our purposes, the
failure of the linear skin absorbance model at these longer wavelengths does not influence the results of our simulations
because the spectral sensitivity of CMOS imagers decreases rapidly beyond 700 nm. Nonetheless, we restrict our
analysis to skin reflectances within the range of 480 nm to 700 nm.
4
Absorption Coefficient (cm-1)
10 0.8
Estimated Reflectance
oxy
deoxy
melanin 0.6
2
scatter
10 0.4
0.2
0
10 0
400 500 600 700 800 900 1000 0 0.2 0.4 0.6 0.8
Wavelength (nm) Measured Reflectance
Figure 1: Spectral absorbance function Figure 2: Measured versus modeled reflectance
With (1) as the skin model, we vary the amount of oxy-hemoglobin ( ), deoxy-hemoglobin ( ), melanin ( ) and
scatter ( ) to simulate different skin reflectances for our experiment. Because oximeters rely on the assumption that
blood volume is constant, we set 1 . Since blood oxygen saturation, SO2, is quantified by /
and 1, we can use to quantify the level of SO2. Figure 3 and 4 show skin reflectances that have different
levels of SO2, melanin, and scatter. Notice that for any combination of SO2, melanin, and scatter levels, the reflectances
at different oxy/deoxy ratios remain equal at several isosbestic wavelengths. Thus, there are several candidate
wavelengths (500 nm, 528 nm, 548 nm, and 570 nm) for the isosbestic sensor channel. Similarly, wavelengths showing
variation in reflectance (560 nm and 580 nm) serve as good candidates for the non-isosbestic sensor channel.Figure 3: Varying SO2 at three melanin levels and Figure 4: Varying SO2 at three scatter levels and
constant scatter. Isosbestic wavelengths are constant melanin. Isosbestic wavelengths are
demarcated with dashed vertical lines. demarcated with dashed vertical lines.
3.2 Optics
We create an optical image of the scene subtended on the sensor using diffraction limited optics with f/# of 4.0 and focal
length of 3.86 mm.
3.3 Sensors
A pulse oximeter uses a single photodiode rather than CMOS or CCD spatial arrays. The two spectral channels in a
pulse oximeter are created with LED lights. The design of pulse oximeters has thus been limited by the quantum
efficiency of the photodiode and the spectral power of commercially available LED lights.
We model an imaging oximeter that has peak sensitivities at the isosbestic and non-isosbestic wavelength, respectively.
Sensor channels are modeled as Gaussian functions of wavelength that differ in peak sensitivity and bandwidth. In the
simulations we report here, the bandwidths of the spectral channels vary between 5 nm and 15 nm, with pixel size of 2.8
microns and sensor noise limited to photon noise. (We will consider the effect of pixel size and different sources of
sensor noise in future simulations.) We keep the peak wavelength sensitivity of one channel fixed (referred to as the
reference channel) while varying the peak wavelength of the second channel (referred to as the test channel). We used
ISET simulations to predict the output (volts) of the reference and test channels for skin reflectance stimuli with different
SO2 levels. We calculate the correlation between the ratios of responses of the two spectral channels and the SO2 levels.
Unlike pulse oximeters that have a single pixel photodiode, we use a CMOS imaging array3. We refer to our sensor as
an imaging oximeter because it has the potential to measure the spatial distribution of blood oxygenation. In this paper,
we evaluate the effects of the peak sensitivity and bandwidth of a two-channel imaging oximeter and discuss the
implications of our results for sensor design.
3.4 Processing
We estimate oxygen saturation by the ratio of the responses of isosbestic and non-isosbestic channels. In a separate
paper, we will compare this approach with more general linear methods for estimating oxygen saturation from the
response of two or more spectral channels.
4. ANALYSIS AND RESULTS
Computer simulations make it possible to explore a very large design space for imaging systems. We constrained our
search of the design space in the following way: We simulated the performance of a two-channel imaging oximeter by
3
We used the spectral sensitivity functions for the Micron MT9M001 CMOS Digital Image Sensor reported in
http://download.micron.com/pdf/datasheets/imaging/mt9m001_1300_mono.pdfkeeping the peak sensitivity of one channel constant (centered on an isosbestic wavelength and referred to hereafter as
the reference channel) while varying the peak sensitivity of the second channel (hereafter referred to as the test channel).
In our initial simulations, we set the melanin and scatter coefficients to be low (0.2 and 0.1, respectively) in order to
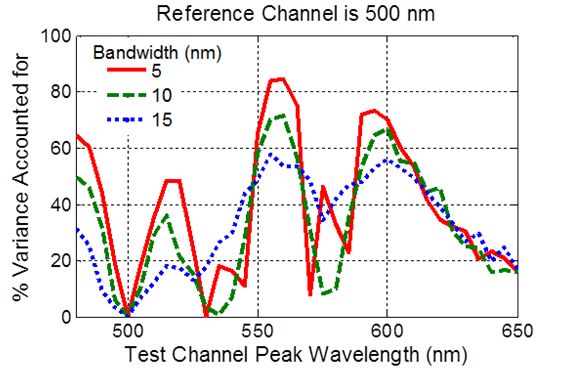
focus on the spectral properties of the reference and test channels. Figure 5 shows the squared correlation coefficient (r2)
between the ratio of sensor responses and SO2 expressed as the percentage of the variance explained, r2 * 100 ) plotted as
a function of the peak sensitivity of the test channel. In this example, the reference channel had peak sensitivity at 500
nm (an isosbestic wavelength). Obviously, when the test wavelength is equal to the reference wavelength, it is not
possible to predict the SO2 levels.
Figure 5 summarizes the results of a simulation in which we found that the best peak sensitivity for the reference and test
channels is 500 and 560 nm, respectively. This result should not be surprising since Figures 3 and 4 show that the largest
variation in skin reflectance with oxygen saturation (SO2) occurs around 560 nm and the isosbestic wavelength that is
farthest from 560 nm is 500 nm. We should therefore expect that a reference (isosbestic) channel centered at 500 nm and
a test channel (non-isosbestic) with peak sensitivity at 560 nm would be good candidate wavelengths for a two-channel
imaging oximeter.
Figure 5: Correlation between the ratio of sensor responses and SO2, Figure 6: Effect of increasing melanin concentration on
expressed as the percentage of the variance in SO2 (r2 * 100), correlation between the ratio of sensor responses and SO2 ,
plotted as a function of the peak wavelength sensitivity of the test expressed as the percentage of the variance in SO2
channel, with bandwidth as the parameter. (r2 * 100).
Figure 5 also shows that the correlation between the ratio of sensor responses and SO2 decreases with increasing
bandwidth. This result is also to be expected since the wider the bandwidth the more likely the reference channel and the
test channel will integrate parts of the reflectance signal that increase with SO2, with parts of the signal that decrease with
SO2.
Figure 6 shows that the correlation between the ratio of sensor responses and SO2 decreases with increasing
concentrations of melanin. This result is consistent with the observation that it is difficult to estimate SO2 in skin that has
high concentrations of melanin.
5. DISCUSSION AND SUMMARY
The purpose of this paper is to illustrate how computer simulations can be used to guide the design of imaging sensors
for biomedical applications, such as measuring the percentage of oxygenated blood. The simulations make it possible to
vary the illuminant, optics, and sensor in order to obtain the configuration most optimized for measuring oxygen
saturation.We used a weighted combination of absorbance functions for oxy-hemoglobin, deoxy-hemoglobin, melanin, and light
scatter to generate skin reflectances. We show that the linear model for skin components can predict measurements of
skin reflectances between 480 and 700 nm After validating the model over this range of wavelengths, we used the
model to simulate skin reflectances with varying amounts of oxygen saturation.
Skin reflectances generated with different levels of SO2 were used as input to an ISET simulation of a two-channel
imaging oximeter. The ISET simulations allowed us to evaluate the effectiveness of different combinations of two
channels with different spectral sensitivities in predicting the SO2 levels. We found that the best predictions were
obtained when the spectral sensitivities of the two channels were narrowband (~5 nm) with peak sensitivities centered at
500 and 560 nm, respectively. Increasing melanin concentration reduced the ability of the imaging oximeters to predict
SO2 levels.
Our analysis is limited by the restricted range of wavelengths (480 – 700 nm) over which a simple linear model of skin
absorbances can predict skin reflectances. At longer wavelengths, we know that the signal reaching the photodetector
array is much smaller due to the fact that light is absorbed by water and lipids in the longer wavelengths. Furthermore,
silicon photodetector arrays are much less sensitive to light in wavelengths greater than 700 nm. On the other hand, light
in longer wavelengths can penetrate tissue to greater depths where arteries lie. And, as we noted earlier, most pulse
oximeters use an LED with peak sensitivity at 940 nm and a half-amplitude bandwidth of 50 nm as the isosbestic
channel and an LED with peak sensitivity at 660 nm and a half-amplitude bandwidth of 20 nm as the non-isosbestic
channel. In the future, we plan to use empirical measurements of oxygen-deprived tissue to evaluate the design tradeoffs
of imaging oximeters that use spectral channels that have peak sensitivities in the longer wavelengths and wider
bandwidth.
Another future direction for this research is to determine whether existing imaging devices, such as RGB digital cameras
and multispectral imaging systems, can be used to predict SO2 levels. We will also consider whether it is possible to use
transverse field detectors [15, 16] to tune the spectral sensitivity of two or more channels in order to predict SO2 levels.
To answer these questions, we are simulating imaging devices with more than two spectral channels and using linear
combinations of the channel responses to predict SO2 levels. The methodology we describe in this paper serves as an
important foundation for this ongoing research.
6. REFERENCES
[1] R. D. Fiete, Tutorial Texts in Optical Engineering vol. TT92: SPIE Press, 2010.
[2] J. Farrell, et al., "A simulation tool for evaluating digital camera image quality," Proceedings of the SPIE, vol.
5294, pp. 124-131, 2004.
[3] J. E. Farrell, et al., "Digital camera simulation," Applied Optics, vol. 15, pp. 84-90, 2012.
[4] J. Farrell, et al., "Sensor calibration and simulation," Proceedings of the SPIE, vol. 6817, 2008.
[5] J. Farrell, et al., "Using visible SNR (vSNR) to compare the image quality of pixel binning and digital
resizing," Proceedings of SPIE, vol. 7537, 2010.
[6] J. Farrell, et al., "Resolution and light sensitivity tradeoff with pixel size," Proceedings of the SPIE vol. 6069,
2006.
[7] J. Chen, et al., "Digital Camera Imaging System Simulation," IEEE Transactions On Electron Devices vol. 56,
pp. 2496-2505, 2009.
[8] Z. Smith, et al., "Cell-Phone-Based Platform for Biomedical Device Development and Education
Applications," PLoS One, vol. 6, 2011.
[9] S. Seo, et al., "Lensfree holographic imaging for on-chip cytometry and diagnostics," Lab Chip, vol. 9, pp. 777-
787, 2009.
[10] V. Pamplona, et al., "NETRA: interactive display for estimating refractive errors and focal range," ACM Trans.
Graph., vol. 29, pp. 1-8, 2010.
[11] L. L. Randeberg, et al., "Hyperspectral imaging of bruised skin," Proceedings of the SPIE, vol. 6079, 2006.
[12] G. Zonios, et al., "Skin melanin, hemoglobin, and light scattering properties can be quantitatively assessed in
vivo using diffuse reflectance spectroscopy," The Journal of Investigative Dermotology, vol. 117, pp. 1452 -
1457, 2001.[13] D. Yudovsky, et al., "Hyperspectral imaging in diabetic foot wound care," Journal of Diabetes Science and
Technology, vol. 4, pp. 1099 - 1113, 2010.
[14] K. J. Zuzak, et al., "Visible Reflectance Hyperspectral Imaging: Characterization of a Noninvasive, in Vivo
System for Determining Tissue Perfusion," Analytical Chemistry vol. 74, pp. 2021-2028, 2002.
[15] G. Langfelder, "Spectrally reconfigurable pixels for dual-color-mode imaging sensors," Appl. Opt., vol. 51, pp.
A91-A98, 2012.
[16] G. Langfelder, et al., "Tunable Spectral Responses in a Color-Sensitive CMOS Pixel for Imaging
Applications," Electron Devices, IEEE Transactions on, vol. 56, pp. 2563-2569, 2009.
[17] P. B. Catrysse and B. A. Wandell, "Integrated color pixels in 0.18-um complementary metal oxide
semiconductor technology," J. Opt. Soc. Am. A, vol. 20, pp. 2293-2306, 2003.
[18] G. Langfelder, et al., "Tunable Spectral Responses in a Color-Sensitive CMOS Pixel for Imaging
Applications," IEEE Transactions On Electron Devices, vol. 56, pp. 2563-2569, 2009.
[19] F. Zaraga and G. Langfelder, "White balance by tunable spectral responsivities" Journal of the Optical Society
of America A., vol. 27, pp. 31-39, 2010.
[20] J. G. Webster, ed. Design of Pulse Oximeters: Institute of Physics Publishing,, 1997.
[21] R. R. Anderson and J. A. Parrish, "The Optics of Human Skin," The Journal of Investigative Dermotology, vol.
77, pp. 13-19, 1981.
[22] M. J. C. V. Gemert, et al., "Skin Optics," IEEE Transcations on Biomedical Engineering, vol. 36, pp. 1146-
1154, 1989.
[23] I. Nishidate, et al., "Noninvasive imaging of human skin hemodynamics using a digital red-green-blue camera,"
Journal of Biomedical Optics, vol. 16, 2011.
[24] A. Vogel, et al., "Using noninvasive multispectral imaging to quantitatively assess tissue vasculature," Journal
of Biomedical Optics, vol. 12, 2007.
[25] D. Yudovsky and L. Pilon, "Retrieving skin properties from in vivo spectral reflectance measurements,"
Journal of Biophotonics, vol. 4, pp. 305–314, 2011.
[26] M. Parmar, S. Lansel, J. Farrell, "An LED based lighting systems for acquiring multispectral scenes",
Proceedings of the SPIE, vol. 8299, 2012
[27] K. Martinez, et al., "Ten Years of Art Imaging Research," Proceedings of the IEEE, vol. 90, pp. 28-41, 2002.
[28] P. E. Bickler, et al., "Effect of skin pigmentation on pulse oximeter accuracy at low saturation," Anesthesiology,
vol. 102, pp. 715-719, 2005.
[29] J. R. Feiner, et al., "Dark skin decreases the accuracy of pulse oximeters at low oxygen saturation: the effects of
oximeter probe type and gender," Anesthesia & Analgesia, vol. 105, 2007.You can also read