Detection of peanut allergen by real-time PCR: looking for the suitable detection marker as affected by processing - Preprints
←
→
Page content transcription
If your browser does not render page correctly, please read the page content below
Preprints (www.preprints.org) | NOT PEER-REVIEWED | Posted: 28 May 2021                   doi:10.20944/preprints202104.0382.v2

              Article

              Detection of peanut allergen by real-time PCR:
              looking for the suitable detection marker as affected
              by processing
              Africa Sanchiz 1, Paulina Sánchez-Enciso2, Carmen Cuadrado1* and Rosario Linacero2,*
               1 Food Technology Department, SGIT-INIA, Ctra. La Coruña Km. 7.5, 28040 Madrid, Spain;
                 africa.sanchiz@gmail.com (A.S.); cuadrado@inia.es (C.C.)
               2 Genetics, Physiology and Microbiology Department, Biology Faculty, Complutense University, 28040

                 Madrid, Spain charolin@ucm.es (R.L.)
               * Correspondence: charolin@ucm.es; Tel+34-913944849 / cuadrado@inia.es; Tel+34-913476925

               Abstract

               Peanut (Arachis hypogaea) contains allergenic proteins, which make it harmful to the sensitised
               population. The presence of peanut in foods must be indicated on label, to prevent accidental
               consumption by allergic population.. In this work, we use chloroplast markers for specifically
               detection of peanut by real-time PCR, in order to increase the assay sensitivity. Three different
               protocols of DNA isolation were evaluated, for total and organelle-DNA extraction. Binary mixtures
               of raw and processed peanut flour in wheat were performed at concentrations ranging from 100000
               to 0.1 mg/kg. DNA isolation from peanut, mixtures and other legumes was carried out following
               three protocols for obtaining genomic and chloroplast-enrich DNA. Quantity and quality of DNA
               was evaluated, obtaining better results for protocol 2. Specificity and sensitivity of the method has
               been assayed with specific primers for three chloroplast markers (mat k, rpl16 and trnH-psbA) and
               Ara h 6 peanut allergen-coding region was selected as nuclear low-copy target and TaqMan probes.
               Efficiency and linear correlation of calibration curves were within the adequate ranges. Moreover,
               the influence of pressure and thermal processing on the peanut detectability was analyzed.

               Keywords: Realtime PCR, peanut, food allergen, chloroplast marker, DNA isolation

              1. Introduction

              Peanut (Arachis hypogea L.) is a plant belonging to the Fabaceae family, whose seed fruits are
              worldwide consumed. Peanut allergy is one of the most common IgE-mediated reactivity to food
              because of its severity and lifelong persistence [1]. Considerable effort has been spent in
              characterizing peanut allergens and several allergenic proteins have been identified until now (up to
              Ara h 18 has been included in the WHO/IUIS Allergen Nomenclature Sub-Committee Database). The
              major peanut allergens, Ara h 1 (65 kDa, vicilin) and Ara h 2 (17 kDa, conglutin), are recognized by
              70-90 % of sensitizsd subjects [2] and Ara h 3 (11 S legumin) has been considered to play a lesser
              allergenic role [3]. The thermal treatment has significant effect on peanut immunoreactivity. Roasting
              peanut enhances its IgE-binding capacity [4], while boiling decreases its allergenicity [5]. According
              to Cabanillas et al. [6], IgE immunoreactivity of roasted peanut decreased significantly at extreme
              conditions of autoclaving (2.6 bar, 30 min). When DIC treatment (instantaneous controlled pressured-
              drop, based on 6 bar of pressure for 3 min) was applied to raw and roasted peanut proteins compared
              to untreated samples resulted into a significant decrease in the protein band of 65 kDa (putative Ara
              h 1) and the disappearance of immunoreactive bands under 20 kDa [7]. The immunoreactivity
              changes of peanut proteins following thermal treatment may be due to modification of protein
              structure of each individual allergen of peanut as well as their interaction with the food matrix.

           © 2021 by the author(s). Distributed under a Creative Commons CC BY license.
Preprints (www.preprints.org) | NOT PEER-REVIEWED | Posted: 28 May 2021 doi:10.20944/preprints202104.0382.v2
Nowadays, as no treatment for food allergies is available, sensitised individuals must avoid the
consumption of the offending ingredient but the presence of allergens in foods can be a consequence
of fraudulent substitution or adventitious contamination during food processing at the industrial
facilities. Therefore, the development of reliable and specific tools to detect traces of food allergens
is indeed essential to improve the quality of life of sensitised individuals, in agreement with the
consensus experts [8]. Usually, protein-based assays as enzyme-linked immunosorbent assay
(ELISA) are used to detect small amounts of proteins from specific foods. DNA-based methodologies,
such as real-time PCR and genosensors, have been proposed as specific, sensitive and reliable
alternatives to ELISA since DNA molecules preserve their integrity better than proteins [9]. Until the
date, several methods have been performed for peanut allergen detection, either relying on protein
or DNA-analysis [10–16] . MS methods for peanut allergen analysis have been developed that can
detect peanut allergens different matrices belonging to different food product categories [11]. DNA-
based methods applied to peanut detection have been review by Zhan et al [17]. Foods, including
peanuts, are usually thermally treated to preserve food safety or even modify allergenic reactivity
[18] but maintaining or improving organoleptic and functional properties [19]. The protein solubility
can be highly affected by thermal food processing, and subsequent detection with protein-based
techniques might be hampered [20]. In contrast to protein-based techniques, DNA-based assays have
been proposed as a reliable, sensitive and specific alternatives for food allergen identification.
Although DNA is a very stable molecule, fragmentation and/or degradation of DNA molecules after
severe treatments have been reported by several authors [21,22]. Some studies have analyzed the
effect of many different treatments (boiling, High Hydrostatic Pressure HHP, autoclave, frying,
roasting) on the detection of different DNA targets in peanut, hazelnut, walnut, almond or pistachio,
among others [23–27].
Specificity, sensitivity and potential of quantification of a real-time PCR method for allergen detection
can be compromised by the selected target sequence.Either multi-copy (such as ITS or chloroplast
sequences or genes) or single/low-copy genes have been sed as targets for real-time PCR based
detection methods for nut analysis [9,15,17,28-32]. Most of the real-time PCR methods for peanut
detection used Ara h 2 coding sequence as target gene reaching sensitivity levels around 2-10 ppm
of peanut in food products [15, 16]. When ITS are used as target the sensitivity is higher (0.1 ppm)
[15]. The data with chloroplast sequences, such as atp 6 or mat k, indicate that these sequences are
powerful analytical tools for the quantitative detection of trace amounts of peanut in commercial food
products [30-32]. The objective of this study was to set up and validate a real-time PCR assay for
sensitive, specific and reliable peanut detection, using previously confirmed primer pairs for
chloroplast marker sequences [30] or novel primers and probe for allergen coding sequences as
targets. Additionally, we aimed to analyze the effect of thermal food processing (boiling, autoclaving
and DIC) on peanut detection in complex food products by real-time PCR.
2. Materials and Methods
2.1. Plant material and treatments
Peanuts (Arachis hypogaea) were provided by Productos Manzanares S.L. (Cuenca, Spain). Several
thermal and pressure-based treatments were performed on whole peanuts. One hundred grams of
peanuts, immersed in distilled, water were boiled for 60 min or autoclaved (Compact 40 Benchtop,
Priorclave, London,UK) at 121°C (1.20 bar) and at 138°C (2.56 bar) for 15 and 30 min, as previously
described [33]. Peanuts were also subjected to controlled Instantaneous Depressurization (DIC)
treatment, performed at the La Rochelle University (LaSiE). DIC treatment was carried out following
a factorial experimental design previously described [34]. In this experiment, the moistened whole
nuts are placed in a processing chamber and exposed to steam pressure (7 bar) at high temperature
(up to 170°C), over a short time (120 s). An instant pressure drop towards a vacuum at about 50 mbar
follows this high-temperature-short time stage. This abrupt pressure drop, at a rate ΔP/Δt higher than
5 bar/s, simultaneously provokes an auto-vaporization of a part of the water in the product, and anPreprints (www.preprints.org) | NOT PEER-REVIEWED | Posted: 28 May 2021 doi:10.20944/preprints202104.0382.v2
instantaneous cooling of the products, which stops thermal degradation. After treatments, peanuts
were freezedried (Telstar Cryodos, Terrasa, Spain), defatted using n-hexane (34 mL/g) for 4 hours.
Flours were passed through a 1mm mill and stored at 4⁰C until use.
2.2. Binary mixtures
Binary mixtures (spiked samples) of untreated (control) and treated (boiled, B60; autoclave 121⁰C at
15 min (A1) and at 30 min (A2); autoclave 138⁰C at 15 min (A3) and 30 min (A4) and DIC (DIC)
defatted flours were performed in spelt wheat as described elsewhere [26]. Thus, mixtures containing
10, 100, 1000, 10000 and to 100000 mg/kg (0.01%–10%) of peanut in wheat were prepared in a final
weight of 25 g. Spiked samples were mixed using a kitchen robot (Thermomix 31-1, Vorwerk
Elektrowerke, GmbH & Co. KG, Wüppertal, Germany). The mixture containing 10% of each peanut
sample (100000 mg/kg) was prepared by adding 2.5 g of the nut flour to 22.5 g of spelt wheat flour,
and followed by 10-fold dilutions, homogenizing with the kitchen robot (Table S1).
2.3. DNA isolation and conventional PCR
Isolation of DNA was performed following different protocols. Genomic DNA was obtained using
DNeasy Plant Pro kit (Qiagen, Hilden, Germany), with slight modifications. Briefly, 80 mg of binary
mixtures and other plant species was homogenized in 1 mL of CD1 buffer with 5 µL of 25 mg/mL
RNAse using Tissue Lyser (TissueLyser II, Qiagen, Hilden, Germany) for cycles of 2 min at 24 1/s of
frequency with a 30 s of pause. After centrifugation for 5 min at 11000 rpm, 500 µL of supernatant
were collected and 250 µL of CD2 buffer were added. Incubation for 20 min in ice was included after
this step, followed by centrifugation at 11300 rpm for 2 min. Five hundred µL of supernatant were
mixed with 1 volume of APP buffer before loading the column. Two steps of washing with AW2
buffer were performed, and DNA was eluted in 50 µL of pre-warmed deionized water (protocol 1).
With the aim of performing a representative (compared to genomic DNA kit) but chloroplast-
focused, faster and/or cheaper DNA isolation protocols, DNA from the same quantity of flour was
isolated with two protocols (2 and 3).
Protocol 2 was SpeedTools plasmid DNA purification Kit (Biotools, Loganholme, Australia)
following the manufacturer instructions. Homogenization of 80 mg of peanut flours and binary
mixtures was performed as described for protocol 1, adding 1 ml of the corresponding lysis buffer
from the kit.
Regarding protocol 3 or in-home designed protocol, 80 mg of peanut or binary mixture’s flours were
homogenized in 700 µL of solution I (glucose 50 mM, Tris HCl 25 mM, EDTA 10 mM) using tissue
lyzer at the same conditions described above. Centrifugation at 3000 rpm for 5 min was performed
and 500 µL of supernatant was collected and centrifugated at 12000 rpm for 10 min. Pellet was
suspended in 500 µL of MLB (NaCl 150 mM, Na2EDTA 50 mM, Tris HCl 10 mM), 250 µL of solution
II (2% SDS, NaOH 0.4M) and 500 µL of solution III (29.5% acetate, pH 4.8) and centrifuged at 13000
rpm for 5 min at room temperature. Eight hundred µL of supernantant was kindly mixed with 700
µL with cold isopropanol, and centrifuged 15 min at 13000 rpm. Pellet was washed with 500 µL of
cold ethanol, centrifuged 5 min at 13000 rpm and completely dried before suspended in 50 µL of pre-
warmed deionized water.
DNA from food products was isolated using NucleoSpin kit (Macherey-Nagel, Düren, Germany)
following the manufacturer instructions with minor modification [35]. Quality and quantity of
isolated DNA was analyzed by spectrophotometry using NanoDrop™ One (Thermo-Fisher,
Waltham, MA, USA) and electrophoresis by 0.8% agarose-gels.
End-point PCR using universal eukaryotic primers targetingthe nuclear 18S rRNA gene were
performed as described by Sanchiz et al. [36] (Table 1). These reactions were carried out in 20 µL,
containing 25 ng of DNA, 250 nM of each primer and 1XFastStar PCR Master Mix (Biotools,Preprints (www.preprints.org) | NOT PEER-REVIEWED | Posted: 28 May 2021 doi:10.20944/preprints202104.0382.v2
Loganholme, Australia). SensoQuest LabCycler (Progen Scientific Ltd, London, UK) was
programmed with an initial denaturation step at 95⁰C, 5 min, followed by 35 cycles of denaturation
at 94⁰C for 1 min, annealing at 60⁰C for 30 s and elongation at 72⁰C for 45 s, and a last step at 72⁰C for
5 min.
2.4. Primers, probes and sequencing
Three chloroplast markers from Arachis hypogaea were selected based on previous literature [30],
named mat K, trnH-psbA and rpl16 (KJ468094.1). Slight modification on one of the primer sequence
for mat K target was done, due to amplification performance reasons. Moreover, Ara h 6 allergen-
coding region of peanut (AF092846) was selected as nuclear low-copy target and specific primers and
Taqman probe were designed using primer3 software. In-silico analysis of these sequences was also
performed using BLASTn from NCBI, searching for homologue sequences from other species,
especially legumes and tree nuts. Moreover, end-point PCR was performed with peanut and other
species DNA using specific primers (Table S2), following the same program that described in 2.4
section. Then, Sanger sequencing of partial rpl16, trnH-psbA and Ara h 6 sequences was performed
in an ABI PRISM 3700 sequencer (Applied Biosystems, Foster City, CA, USA) from the Genomics
Service (Universidad Complutense de Madrid, Spain). In the case of Ara h 6, resulted amplicons were
cloned into the pCR™4-TOPO® Vector using TOPO® TA Cloning® Kit (Invitrogen, Inc., UK)
following the manufacturer's instructions. Sequences were analysed using Bioedit Software (Ibis
Biosciences, Carlsbad, CA, USA). Final sequences of primers and probes, their final concentration
used in real-time PCR reactions and amplicon sizes are included in Table 1.
2.5. Real-time PCR
Real-time PCR assays were performed with 7900HT Fast real-time PCR (Applied Biosystems, CA,
USA), in a volume of 20 µL containing 5 µL of DNA at different concentrations, different final
concentration of primers and probes (Table 1) and 10 µL of TaqMan ® Gene Expression Master Mix
(Applied Bio- system, CA, USA). The used program included an initial denaturation at 95 ⁰C for 10
min followed by 40 cycles of denaturation at 95 ⁰C for 15 s and primer annealing and elongation at
60 ⁰C for 1 min.
The cycle threshold (Ct) value, obtained from 10-fold serial dilutions of peanut DNA in deionized
water and different points of binary mixtures containing from 100000 to 0.1 mg of peanut per kg of
mixture, were used to generate standard curves for real-timePCR. The efficiency (10(-1/slope)-1) of each
reaction was calculated from the slope of each standard curve (Ct vs log DNA content or Ct vs log
Quantity of peanut nut flour). Sensitivity and limit of detection (LOD) were determined taking into
account the lowest amount of target that can be detected in at least 95% of the cases [37]. Specificity
of primers was tested real-time PCR, by means of the amplification of 10 ng of isolated DNA from
different species.
Table 1. DNA sequences of primers and probes.
F
i
n
a
l
Amplicon
Oligonucleotide Sequence (5’→ 3’) c Reference
(bp)
o
n
c
e
nPreprints (www.preprints.org) | NOT PEER-REVIEWED | Posted: 28 May 2021 doi:10.20944/preprints202104.0382.v2
t
r
a
t
i
o
n
(
n
M
)
mat K fw TGGACTCGCCTCTGGTCAT 6
0
mat K rv CTGCATATCCGCAAATACCG [30]*
0
104
2
mat K probe FAM-CATCCCATTAGTAAGCCCGTTTG-BHQ 0
0
trnH-psbA fw AGGAGCAATAGAAACTGCGT 5
0
trnH-psbA rv TTTTTGTCTTAAGGGATACGAGT [30]
0
68
2
trnH-psbA probe 6FAM-TGATATTGCTCCTTTACTTTCAAAA-BHQ1 5
0
rpl16 fw GCGATGGGAACGACGAAAAC 2
5
rpl16 rv TTAGTTCGTTCCGCCATCCC
0
69 [30]
1
rpl16 probe 6FAM-ACCTAAGATTCATTTGACGGGA-BHQ1 5
0
Ara h 6 fw AGTGCGATAGGTTGCAGGAC 6
0
Ara h 6 rv AAATCGCAACGCTGTGGTG This article
0
107
2
Ara h 6 probe 6FAM-GCAAATGGTGCAGCAGTTCAAGAG-BHQ1 0
0
Universal 18S fw CGCGAGAAGTCCACTAAACC 2
5 64 [37]
Universal 18S rv CCTACGGAAACCTTGTTACGA
0
*Based on that article with slight sequence modification.
2.6. Statistical analysis
The significance of differences (p < 0.05) between the Ct values of each spiked level for each treatment
(boiling, DIC and autoclave processing) compared to untreated control was evaluated by t-student
test using GraphPad Prism Programme.
3. Results and Discussion
3.1. Selection of the suitable target
Four target has been selected for specific detection of peanut: three chloroplast markers, rpl16, trnH-
psbA and mat K and a nuclear allergen-coding gene, Ara h 6. As mentioned in material and methods
section, we first reviewed the available literature in DNA-based methods for peanut allergen
detection, selecting rpl16, trnH-psbA and mat K because of their better results regarding sensitivity,
efficiency of the amplification and specificity [30]. Puente-Lelievre et al designed a multiplex assay,Preprints (www.preprints.org) | NOT PEER-REVIEWED | Posted: 28 May 2021 doi:10.20944/preprints202104.0382.v2
based on chloroplast markers, to detect allergenic peanut. Multicopy sequences, such as chloroplast
or ITS sequences, have been proposed as very sensitive markers for trace food allergen detection, not
only in peanut but in other nuts [15,31–42]. Low/single copy number genes have also provided
specific and sensitive results in real-time PCR [9, 15]. Thus, we designed primers and a Taqman probe
for the amplification of the allergen-coding gene Ara h 6, which is major allergen in peanut encoding
for a 2S albumin, aimed to detect peanut traces in food.
Amplification plots, calibration curves with serial diluted DNA and binary mixtures spiked with
peanut, of the four targets are showed in Figure 1 and Table 2 respectively. All DNA used in these
experiments was isolated with Protocol 1, described in M&M section.
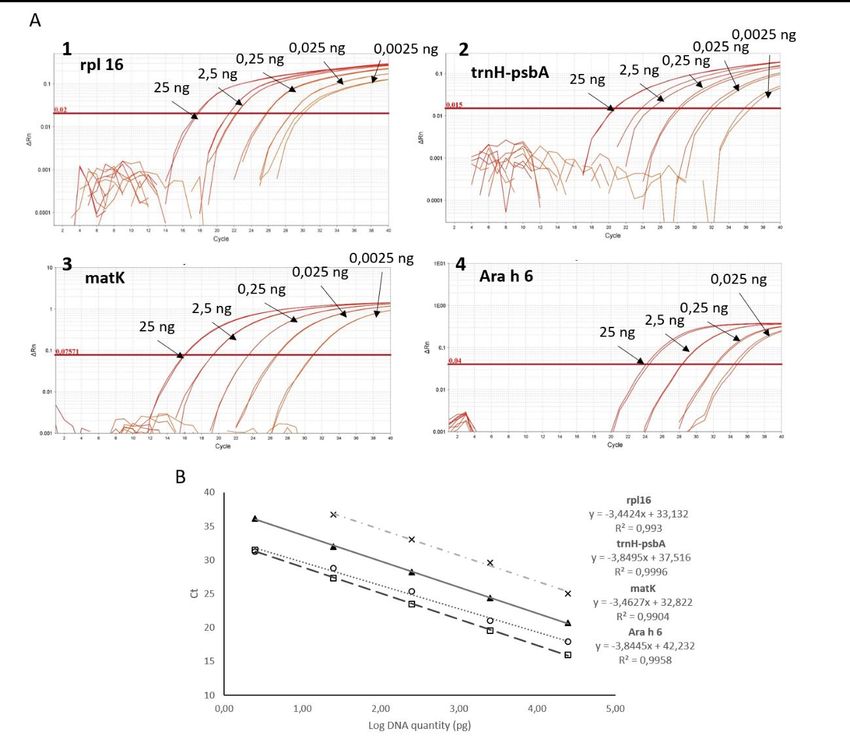
Regarding rpl16 target, 95%, of efficiency of the amplification reaction and 0.993 of correlation
coefficient was obtained (Figure 1). However, calibration curves with binary mixtures using same
primers and probe, did not show acceptable efficiency (113.52%) or correlation coefficient( 0.970)
(Table 2).
The trnH-psbA marker showed lower efficiency values than expected (84%), with an adequate
correlation coefficient (0.9912) with serial dilutions of peanut DNA (Figure 1). When curves were
performed with binary mixtures containing known amounts of peanut in wheat, efficiency and R 2
were within the adequate ranges. Regarding sensitivity, at least 1 mg/kg of peanut in binary mixtures
was detected in 100% of the replica (Table 2).
The mat K primers/probe yielded good results regarding amplification efficiency, after analyzing
both performed calibration curves, 91.36% for serial diluted DNA and 108.30% in binary mixtures
curves. Linear dynamic range was obtained between 25 and 0.0025 ng with a R 2 coefficient of 0.994
in the 10-fold diluted DNA curve (Figure 1). After representing the mean Ct value and the log of the
quantity of peanut flour in the mixtures, R2 was 0.995, in the linear range between 100000 and 1 mg/kg
(Table 2).Preprints (www.preprints.org) | NOT PEER-REVIEWED | Posted: 28 May 2021 doi:10.20944/preprints202104.0382.v2
Figure 1. Calibration curves for the four selected targets. A) Representative amplification plots of calibration
curves of rpl 16 (1), trnH-psbA (2), matK (3) and Ara h 6 (4), obtained by real-time PCR amplification of serial
diluted peanut DNA (from 25 ng to 0.0025 ng). B) Calibration curves of the four targets (“cross” for Ara h 6;
“circle” for rpl 16; “triangle” for trnH-psbA and “square” for matK) represented by plotting Ct against the
logarithm of peanut DNA quantity. Slope and correlation coefficient (R2) for each target is shown.
Ara h 6 primers and probe were designed based on the sequencing information of some clones
(Figure 1SM). Calibration curves using primers for peanut Ara h 6 coding gene (Figure 1 and Table
2), did not show acceptable efficiency (within the range of 90-110%), although good linearity was
obtained in both cases (R2>0.990). Twenty-five nanograms of peanut DNA (first point of the DNA
curve) were detected after 25 cycles of amplification, almost 8 cycles after than the same sample
assayed with primers targeting chloroplast markers as mat K and rlp16.
Table 2. Comparative data of calibration curves from binary mixtures of peanut in wheat, analyzed by real-
time PCR using specific primers and probe for the four selected targets. Obtained Ct mean and SD for each
spiked level is shown, as well as calibration curves parameters (slope, coefficient correlation and efficiency of
the reaction). All DNA samples were isolated by protocol 1.
Peanut quantity
rpl 16 trnH-psbA mat K Ara h 6
(mg/kg)
100000 15.54 ± 0.02 21.45 ± 0.56 17.55 ± 0.17 25.97 ± 0.02
10000 18.98 ± 0.07 23.55 ± 0.77 21.52 ± 0.30 28.71 ± 0.11
1000 22.10 ± 0.22 26.51 ± 0.33 24.17 ± 0.17 31.78 ± 0.22
100 26.55 ± 0.02 30.39 ± 0.46 27.89 ± 0.14 34.72 ± 0.05
10 27.24 ± 0.01 34.26 ± 0.36 30.77 ± 0.25 36.65 ± 0.19
1 29.35 ± 0.02 37.70 ± 0.17 33.22 ± 0.20 37.61 ± 1.35*
0.5 - - 32.74 ± 0.15† -
0.1 - - 33.87 ± 0.58† -
Slope -3.04 -3.35 -3.14 -2.74
Efficiency (%) 113.52 98.81 108.30 131.95
R2 0.970 0.991 0.995 0.994
* Detection is possible but Ct is not considered in the calculation of the parameters of the calibration curve
Regarding specificity of chloroplast target, trnH-psbA and mat K markers showing adequate results
regarding specificity after assaying 10 ng of DNA from several species by real-time PCR, (Table 3).
The mat K primers and probe specificity showed Ct ranged between 34.44 ± 0.27 for pistachio and
39.70 ± 0.42 for apple (Table 3). This amplification was not considered significant since 10 ng of peanut
DNA would be detected at cycle 18 (by DNA curve extrapolation), being even more than 15 cycles
earlier than those species. However, rpl16 primers/probe, was much compromised, since Ct 35), and as a consequence of these data, putative LOD was too high (1000 ppm) (tablePreprints (www.preprints.org) | NOT PEER-REVIEWED | Posted: 28 May 2021 doi:10.20944/preprints202104.0382.v2
2). We decided to discard this marker as a possible target for peanut detection in treated samples and
foodstuff.
Table 3. Specificity of the three selected targets. 10 ng of DNA from different plant species was assayed at least
in triplicate. Protocol 1 was used to obtain genomic DNA. N.D. not detected. “- not assayed”.
Common Scientific Ct ± SD
name name rpl16 trnH-psbA mat K Ara h6
Apple Malus domestica - - 39.70 ± 0.42 -
Lentil Lens culinaris 28.30 ± 1.00 N.D. 39.51 ± 0.68 -
Lemon Citrus x limon - - 37.24 ± 0.21 -
Lupin Lupinus albus 29.10± 0.25 - 37.71 ± 1.22 34.60 ± 0.28
Almond Prunus dulcis - N.D. 37.79 ± 1.24 -
Phaseolus
Green bean 38.7 ± 0.14 N.D. 38.25 ± 0.79 -
vulgaris
Kiwi Actinia deliciosa - - N.D. -
Carob Ceratonia siliqua 28.54 ± 0.46 - 35.46 ± 2.48 -
Walnut Juglans regia - N.D. 35.55 ± 0.26 -
Pear Pyrus pyrifolia - - N.D. -
Fababean Vicia faba 28.44 ± 0.70 N.D. 36.20 ± 1.62 -
Chickpea Cicer arietinum 26.83 ± 1.57 N.D. 37.73 ± 2.60 31.62 ± 0.01
Soy Glycine max 29.44 ± 0.03 N.D. 39.06 ± 1.11 -
Pistachio Pistacia vera - 35.33 ± 0.94 34.44 ± 0.27 34.90± 0.08
Hazelnut Corylus avellana - 36.97 ± 0.38 37.51 ± 0.48 34.22 ± 0.01
Anacardium
Cashew - 37.39 ± 1.48 37.39 ± 1.48 -
occidentale
Grass pea Lathyrus sativus 37.08 ± 0.83 - 37.77 ± 0.89 -
Chestnut Castanea sativa - - N.D. -
Pea Pisum sativum N.D N.D. 38.47 ± 0.88 33.74 ± 0.14
Wheat Triticum spelta N.D. 35.70 ± 0.30 N.D. 35.17 ± 0.43
3.2. Effect of thermal treatments on peanut detection
In the food industry, processing is frequently applied in order to improve safety and organoleptic
properties. In the recent years, many researchers have demonstrated that allergen detection is
importantly affected by food processing, not only in protein-based detection methodologies but also
in DNA-based ones [43,44], being extensively reviewed. It has been defended that food-processing
effect on DNA target detection by PCR should be always considered, even although DNA is a very
stable molecule, especially compared to proteins. It has been possible to detect DNA markers even in
harsh thermal conditions, including autoclaving, roasting, boiling, etc [45, 46]. In order to establish
the real influence of any processing, many authors have supported the necessity of analyzing the
same kind of model mixtures in control and treated samples [47]. For this reason, binary mixtures
were also made with treated flours in the same wheat matrix. Here we described the effect of several
treatments, based on temperature (boiling) or heat combined with pressure (Depressurized Instant
Controlled, named DIC and autoclaving at different conditions) on the detection of specific peanut
chloroplast DNA markers. A calibration curve has been then performed for each treatment, plotting
the average Ct values against the log of the quantity of peanut flour in mixture. NTC (non template
control) samples were always not detected (N.D.) and DNA was first isolated with standard Protocol
1. Regarding detection of trnH-psbA marker, efficiency of 106% of efficiency and linear correlation of
0.970) were obtained in curves set up from boiled samples, and amplification was delayed 2 cyclesPreprints (www.preprints.org) | NOT PEER-REVIEWED | Posted: 28 May 2021 doi:10.20944/preprints202104.0382.v2
compared to untreated control (Fig. 2, light grey columns). However, when pressure and temperature
was applied, in the first autoclave condition (at 121 ⁰C for 15 min), the detection of trnH-psbA was
difficult. Linear range was not obtained and Ct > 29 was obtained in samples with 10% w/w of treated
peanut (or 100000 mg/kg) in the mixture (compared to Ct ~20 when peanut was kept untreated)
(Figure 2A).
Figure 2. Real-time PCR detection of peanut targeting trnH-psbA (A) and mat K (B) chloroplast
marker in untreated and treated samples. Binary mixtures were performed with known amounts of
untreated (control, white columns), boiled for 60 min (grey) or autoclaved at 121 ⁰C (1.2b) for 15 min
(dark grey) peanut in wheat (from 100000 to 1 kg/kg) for the analysis using both targets. Other three
autoclave conditions (columns in black, diagonal and horizontal stripes) and DIC processing (dotted
column) were evaluated by real-time PCR targeting mat K sequence. Mean Ct values against log of
untreated or treated peanut quantity in mixtures is represented.
Effect of autoclaving treatment for longer time was also analyzed, but the tendency was similar to
that obtained in softer conditions of autoclave (data non-shown). Amplicon size of trnH-psbA was
small, just 68 pb, and this fact usually contributes to better results regarding sensitivity when DNA
integrity is affected. Recently, we designed a real-time PCR assay to detect cashew presence in food,
being possible even in autoclaved samples at 138 ⁰C for 15 min, maintaining linearity of the curves
up to 1000 ppm [36]. In that case, amplicon size was only 65 pb, targeting partial Ana o 1 allergen
coding gene. Nevertheless, amplicon size is not the only important factor influencing the capacity to
detect the target in samples with comprised DNA integrity. From our point of view, it becomes
essential to analyze, experimentally, the influence of several common food technological treatments
on the detection capacity of any specific target. Same approach was tested with specific primers and
probe for mat K target.. Suitable detection of mat K target was possible in mixtures containing boiled
peanut for 1 hour, showing R2>0.98 and 106.73% of amplification efficiency, comparable performance
to untreated. Efficiency and correlation coefficient of the curves were within acceptable ranges when
binary mixtures were performed with other treated peanut flour as DIC and autoclave at 120 ⁰C forPreprints (www.preprints.org) | NOT PEER-REVIEWED | Posted: 28 May 2021 doi:10.20944/preprints202104.0382.v2
15 and 30 min, although detection was significantly delayed several cycles compared to control
mixture (Table 3SM).
According to our results, the influence of DIC treatment, based on high temperature (up to 180⁰C)
and pressure (7b) for a very short time (2 min) on mat K target detectability was similar to the
observed effect of autoclave at 121 ⁰C for 30 min, with no significant differences among the Ct values
in different spiked levels (p>0.05). In both cases, it was possible to detect up to 1 mg/kg of peanut but
in less than 50% of the replica (Table 3SM). Our group recently described for the first time the effect
of this novel thermal treatment on real-time PCR detection of three tree nuts allergen-coding
sequences [34]: Cor a 9 from hazelnut, Pis v 1 from pistachio and Ana o 1 from cashew. In that article,
we reported the capacity to detect and quantify DIC-treated samples in mixtures when the allergenic
ingredient was around 100000 and 1000 mg/kg. Here, the detection system would allow detecting
and even quantifying the presence of treated peanut when it is around 100000 and 100 mg/kg in a
mixture. When autoclave at 138⁰C was applied on peanut and DNA from the mixtures was obtained,
linearity of the curves (representing mean Ct of several spiked level vs log quantity of peanut in each
mixture) was not maintained, and efficiency was slightly higher than the acceptable 110% (Table 4).
Detection was not possible in AU 138⁰C 30 min samples, with Ct > 38 in all the spiked levels.
It resulted interesting to observe that maximum obtained Ct value was higher in samples containing
treated peanut comparted to those with untreated nut. Thereby, as an example, in samples with 1
mg/kg (LOD of the system) of untreated/control peanut, Ct was ~33, and then Ct values were not in
the calibration curve. However, mixtures containing boiled peanut, same peanut quantity was
detected at cycle 36, within the linear dynamic range of the calibration curve (Figure 2; Table 3SM).
A similar effect can be discussed when we analyzed the results from our reference [30]. Authors
prepared several food matrices spiked with known amounts of peanut flour (muffins, cookies, sauces,
etc) and generated calibration curves by plotting Ct values against log of peanut concentration.
Obtained Ct values for the lowest spiked level were different depending on the matrix (Ct 32-38), and
good linearity and efficiency was obtained in some of them. Thus, thermal treatment is contributing
to the fragmentation or degradation of DNA molecules affecting the final Ct values.
As mentioned, real-time PCR methods for peanut detection have been performed before targeting
different sequences, but only a few analyzed the effect of processing on DNA detectability, compared
to untreated samples [15, 16, 39]. Among them, usually peanut-containing foodstuff which requires
some kind of thermal treatment, such as cookies, sauces or doughs, are prepared and analysed. Here,
we incorporated peanut samples processed by a plethora of conditions regarding temperature,
pressure and time, observing the influence on the target detectability.
3.3. Comparative analysis of DNA isolation methods
, To compare DNA isolations methods, we decided to perform the real-time PCR assay targeting mat
K chloroplast gene, based on the primers and probe published by Puente-Lelievre et al [30], with a
slight modification on the reverse primer to improve reaction performance. Mat K primers/probe
yielded good results with DNA obtained with protocol 1, as presented in section 3.1. Thus, absolute
LOD was stablished at 0.0025 ng (2.5 pg) of peanut DNA and practical LOD, calculated with standard
curves based on binary mixtures spiked with known quantity of peanut, was stablished at 1 mg of
peanut per kg of mixture, with Ct max of 33.22 ± 0.20 (Figure 1; Table 2) [31]. Since the lowest
amplified level is within the linear range of the standard curve, 1mg/kg is also considered as the LOQ.
Below 1 mg/kg detection was possible but Ct was not within the calibration curve (Table 3). These
results, regarding absolute LOD and curve efficiency obtained from the slope, resulted more
promising than those recently reported by Puente-Lelievre and collaborators. In the particular case
of mat K, when it was analyzed as a single marker, authors obtained standard curves with correlation
coefficient of 0.98 and 88% of efficiency, calculated from the curve slope. With the slight modificationPreprints (www.preprints.org) | NOT PEER-REVIEWED | Posted: 28 May 2021 doi:10.20944/preprints202104.0382.v2
on the reverse primer published by these authors, we acquired R2 and efficiency within the acceptable
ranges for this single chloroplast marker. LOD for mat K target was 1 mg/kg in both previously
published study and ours, using different food matrices.
Figure 3. mat K target detection analyzing peanut DNA samples isolated with 3 different protocols. A)
Calibration curves of real-time PCR assay using mat K specific primers and probe, performed with 10 fold serial
diluted peanut DNA isolated by three different isolation protocols (1, 2 and 3). B) Calibration curves performed
with DNA from binary mixtures of peanut in wheat, using DNA obtained with the 3 different protocols.
Efficiency and R2 values are included for the two kit-based DNA isolation protocols. Only Ct values obtained
after DNA isolation by protocol 3 are shown as grey circles for comparison purposes (samples containing 100,
10 and 1 mg of peanut/kg of mixture). Mean and standard error are represented.
Protocols 2 and 3 were planned to be faster and cheaper methods to obtain quality DNA from peanut
samples, and more focused on the isolation of chloroplast DNA, compared to standard genomic DNA
extraction protocol (Protocol 1). Thus, detection of the chloroplast marker, mat K, might be facilitated.
Moreover, we aimed to use this isolated DNA for a subsequent future use in a specific peanut
genosensor, which requires a rapid, reproducible and economically worthwhile DNA isolation step.
General results about the reaction performance using DNA isolated with protocols 2 and 3 are shown
in Figure 2. Both calibration curves from 10-fold diluted peanut DNA showed good linearity with
correlation coefficients higher than 0.99 and efficiencies of the amplification within the acceptable
ranges (90-110%), not significantly different to the performance observed when protocol 1 was
applied (p>0.05; Fig 3A). Similar results were obtained when calibration curves were performed using
binary mixtures spiked with known amounts of untreated peanut flour, with DNA obtained by
means of Protocol 2 (Figure 3B, triangle). In contrast, DNA from these samples obtained with protocol
3 or in-home protocol, did not allow detecting peanut with enough reproducibility and feasibility,
since with binary mistures, each point is obtained from an independent DNA isolation and is not
built by serial dilution of the DNA (Figure 3B).Preprints (www.preprints.org) | NOT PEER-REVIEWED | Posted: 28 May 2021 doi:10.20944/preprints202104.0382.v2
Figure 4. Influence of the DNA isolation method in the performance of mat K detection in processed matrices.
Amplification of mat K was analysed in two treated peanut samples, by AU 138⁰C 15 min and DIC 7b 2 min,
which DNA was isolated by Protocols 1 and 2. Curves were performed by plotting mean Ct and log of the peanut
quantity. As a reference, a curve performed with untreated peanut in wheat is included, using Protocol 1 for
DNA isolation (cross).
As described before with untreated samples, DNA from several points of binary mixtures prepared
with processed peanut flour (DIC 7b 120 s and AU 138⁰C 15 min) was isolated using protocols 2 and
3, and compared to standard protocol 1 (Figure 4). Standard curves built with DNA from mixtures
containing from 100000 mg/kg to 1 mg/kg of DIC-treated peanut, obtained from protocols 1 and 2,
showed a linear dynamic range extended 4 log10, up to 100 mg/kg of treated with R2 > 0.99 (Figure 4).
In the case of autoclave-treated spiked samples, DNA obtained with protocol 2 allowed to build a
curve with a better correlation coefficient than the one with protocol 1 (R2 0.998 vs 0.885). With DNA
obtained with protocol 3, nevertheless, it was not possible to achieve consistent and reliable data,
being complicated to obtain enough DNA from so processed samples (data non shown). With all
these data, it can be concluded that protocol 2 allows the peanut DNA isolation in a cheaper and
faster manner than standard genomic DNA isolation protocol (here protocol 1), even in processed
matrices. Performance of the reactions is not affected, although it is not improving chloroplast marker
detection compared to the standard protocol. DNA from other species, isolated with this protocol,
should be analysed by real-time PCR; thus, this protocol might be established as the routine DNA
isolation method in the future, for sample analysis by a specific genosensor for peanut detection.
3.4. Applicability of the peanut mat K-based detection assay
Finally, we have confirmed the possible applicability of the real-time PCR assay, based on mat K
target amplification, for the detection of peanut traces in foodstuff. All food samples were amplified
with 18S primers as false negative control, confirming the presence of isolated DNA and the absence
of putative co-isolated PCR inhibitors together with the DNA. A 2-fold dilution of the isolated DNA
was used, and conventional end-point PCR using Universal eukaryotic 18S primers was performed
with DNA from food before specific peanut detection. We analyzed thirteen commercial food
samples by mat K based real-time PCR assay and results are shown in Table 4. One of them is the
cereal bar I, which according to the label contents around 35% of peanut, together to hazelnut,
obtaining a mean Ct near to 18. Four of them showed Ct values higher than 36, which might be
considered as negative results regarding peanut detection. Cereal bar III declared the presence of
peanut/almond traces and 10% of hazelnut content, resulting in a mean Ct of 33. Possible peanut
contamination should be considered in food named Chocolate bar I, whose label indicates tree nut
traces. Interestingly, 3 out of 13 foods, named chocolate bar II, cookies with fiber and cookies with
chocolate, did not declare presence of any allergen on their label; however, Ct 31-32 were obtained
and possible contamination should not be discarded. Even although these Ct values are high, are
included in the linear range of the standard curve, and those foods might be containing between 10
and 1 mg/kg of peanut, or even more if DNA has been damaged during processing, as described
above. Comparison with commercial ELISA tests would be interesting in order to determine the
feasibility of this assay.
Table 4. Detection of mat K target in several commercial food products by real-time PCR. Mean Ct and
standard deviation is shown. Measurements of the same sample were performed at least twice in two different
DNA extractions. N.D. means that non signal after 40 cycles of amplification. All samples were first assayed for
amplification inhibitor presence using eukaryotic universal primers.
Food Food allergen declaration Ct ± SD
Cereal Bar I Peanut (35%), Hazelnut (24%) 17.97 ± 0.26
Cereal Muesli Tree nut and peanut traces 38.73 ± 0.76
Cereal Bar II Almond and tree nuts 32.40 ± 0.29Preprints (www.preprints.org) | NOT PEER-REVIEWED | Posted: 28 May 2021 doi:10.20944/preprints202104.0382.v2
Cereal Bar III Hazelnut (10%), Almond and Peanut traces 33.74 ± 0.29
Cereal Bar IV May content tree nut traces 35.90 ± 0.94
Chocolate with pistachio Pistachio (5%), Almond, Hazelnut, tree nut traces 36.80 ± 0.43
Vegetal Burger May content tree nut traces 39.17 ± 0.96
Sausage with walnut Walnuts N.D.
Chocolate Almond and Hazelnut traces 37.99 ± 0.33
Chocolate Bar I Tree nut traces 32.42 ± 0.16
Chocolate Bar II Not declared 31.32 ± 0.21
Cookies with fiber Not declared 31.02 ± 0.30
Cookies with chocolate Not declared 32.25 ± 0.46
4. Conclusions
In this study, a real-time PCR assay addressed to detect peanut in complex food samples has been
performed. Several gene targets and DNA isolation methods have been proposed and compared in
this work. As markers, three chloroplast markers (trnH-psbA, rpl16 and mat K) and one nuclear
marker (Ara h 6 allergen coding sequence) were analysed regarding sensitivity, efficiency and
specificity of each real-time PCR method. The experiments based on trnH-psbA or mat K target
detection were the most specific, reliable and sensitive enough for the detection of peanut. We have
improved the reaction efficiency of the single mat K reaction by a slight modification on the primer
sequence, compared to the available literature. Moreover, different conditions of heat, pressure and
time (as boiling, autoclaving and DIC. processing) were applied to peanut nuts and their influence
on the amplification of trnH-psbA and mat K targets has been determined. According to our results,
mat K-based real-time PCR method is suitable for reliable for reliable detection of peanut in processed
samples, even after application of a plethora of thermal and pressure-based treatments. Applicability
of the method has been assayed in several commercial food products. DNA isolation, kits based on
silica membranes resulted more adequate for the obtaining of quality DNA from complex food
matrices, named in this work protocol 1 for the isolation of total DNA and 2 for the obtainment of
plasmid-enrich DNA. These two protocols have been compared, showing same amplification
performance for mat K target. Protocol 2 resulted in a cheap and fast methodology that might be
applied for the DNA isolation step in the future, in the development of novel and innovative
detection systems.
Supplementary Materials: The following supplementary material is available online at www.mdpi.com/xxx/s1,
Table SM1: Preparation of binary mixtures of peanut in spelt wheat flours, Table 2SM: Primers used for
sequencing purposes; Table 3SM: Detection of mat K target by probe-based real-time PCR in untreated (control)
and treated spiked samples; Figure 1SM: Sequence alignment of two clones of partial Ara h 6-allergen coding
gene.
Author Contributions: “Conceptualization, R.L. and C.C..; methodology, A.S., P.S.E.; formal analysis, A.S., R.L;
investigation, A.S, R.L., C.C.; resources, C.C.; data curation, A.S., R.L. C.C; writing—original draft preparation,
A.S.; writing—review and editing, R.L, C.C.; supervision, R.L.; project administration, C.C.; funding acquisition,
C.C. All authors have read and agreed to the published version of the manuscript.
Funding: This research was funded by the Spanish Ministerio de Ciencia e Innovación, grant number AGL2017-
83082-R.
Conflicts of Interest: “The authors declare no conflict of interest.”
.
References
1. Sicherer, S.H.; Sampson, H.A. Food allergy: A review and update on epidemiology, pathogenesis, di-
agnosis, prevention, and management. J. Allergy Clin. Immunol. 2018, 141, 41–58.
2. Burks, W.; Sampson, H.A.; Bannon, G.A. Peanut allergens. Allergy 1998, 53, 725–730.
3. Rabjohn, P.; Helm, E.M.; Stanley, J.S.; West, C.M.; Sampson, H.A.; Burks, A.W.; Bannon, G.A. Molecular
cloning and epitope analysis of the peanut allergen Ara h 3. J. Clin. Invest. 1999, 103, 535–542.Preprints (www.preprints.org) | NOT PEER-REVIEWED | Posted: 28 May 2021 doi:10.20944/preprints202104.0382.v2
4. Maleki, S.J. Food processing: effects on allergenicity. Curr. Opin. Allergy Clin. Immunol. 2004, 4, 241–
245.
5. Beyer, K.; Morrow, E.; Li, X.M.; Bardina, L.; Bannon, G.A.; Burks, A.W.; Sampson, H.A. Effects of cook-
ing methods on peanut allergenicity. J. Allergy Clin. Immunol. 2001, 107, 1077–1081.
6. Cabanillas, B.; Maleki, S.J.; Rodríguez, J.; Burbano, C.; Muzquiz, M.; Jiménez, M.A.; Pedrosa, M.M.;
Cuadrado, C.; Crespo, J.F. Heat and pressure treatments effects on peanut allergenicity. Food Chem.
2012, 132, 360–366.
7. Cuadrado, C.; Cabanillas, B.; Pedrosa, M.M.; Muzquiz, M.; Haddad, J.; Allaf, K.; Rodriguez, J.; Crespo,
J.F.; Burbano, C. Effect of instant controlled pressure drop on IgE antibody reactivity to peanut, lentil,
chickpea and soybean proteins. Int Arch Allergy Immunol 2011, 156, 397–404.
8. Pádua, I.; Moreira, A.; Moreira, P.; Melo de Vasconcelos, F.; Barros, R. Impact of the regulation (EU)
1169/2011: Allergen-related recalls in the rapid alert system for food and feed (RASFF) portal. Food
Control 2019, 98, 389–398.
9. Linacero, R.; Sanchiz, A.; Ballesteros, I.; Cuadrado, C. Application of real-time PCR for tree nut allergen
detection in processed foods. Crit. Rev. Food Sci. Nutr. 2020, 60, 1077–1093.
10. Pafundo, S.; Gullì, M.; Marmiroli, N. Multiplex Real Time PCR using SYBR®GreenERTM for the de-
tection of DNA allergens in food. Anal. Bioanal. Chem. 2010, 396, 1831–1839.
11. Chassaigne, H.; Nørgaard, J. V.; Van Hengel, A.J. Proteomics-based approach to detect and identify
major allergens in processed peanuts by capillary LC-Q-TOF (MS/MS). J. Agric. Food Chem. 2007, 55,
4461–4473.
12. Brežná, B.; Piknova, L. Real Time PCR Methods for Identification of Animal or Plant Species. Curr
Issues Mol Biol 2013, 15, 253–272.
13. Hird, H.; Lloyd, J.; Goodier, R.; Brown, J.; Reece, P. Detection of peanut using Real Time polymerase
chain reaction. Eur. Food Res. Technol. 2003, 217, 265–268.
14. Ruiz-Valdepeñas, V.; Pellicanò, A.; Campuzano, S.; Torrente-Rodríguez, R.M.; Reviejo, Á.J.; Cosio,
M.S.; Pingarrón, J.M. Electrochemical detection of peanuts at trace levels in foods using a magnetoim-
munosensor for the allergenic protein Ara h 2. Sensors Actuators, B Chem. 2016, 236, 825–833.
15. López-Calleja, I.M.; de la Cruz, S.; Pegels, N.; González, I.; García, T.; Martín, R. Development of a real
time PCR assay for detection of allergenic trace amounts of peanut (Arachis hypogaea) in processed
foods. Food Control 2013, 30, 480–490.
16. Scaravelli, E.; Brohée, M.; Marchelli, R.; Hengel, A. Development of three Real Time PCR assays to
detect peanut allergen residue in processed food products. Eur. Food Res. Technol. 2008, 227, 857–869.
17. Zhang, M.; Wu, P.; Wu, J.; Ping, J., Wu, J.. Advanced DNA-based methods for the detection of peanut
allergens in processed food. TrAC Trends in Analytical Chemistry, 2019, 114, 278-292.
18. Cabanillas, B.; Novak, N. Effects of daily food processing on allergenicity. Crit. Rev. Food Sci. Nutr.
2017, 11, 1–12.
19. Sanchiz, A.; Pedrosa, M.M.; Guillamón, E.; Arribas, C.; Cabellos, B.; Linacero, R.; Cuadrado, C. Influ-
ence of boiling and autoclave processing on the phenolic content , antioxidant activity and functional
properties of pistachio , cashew and chestnut flours. LWT - Food Sci. Technol. 2019, 105, 250–256.
20. Mattison, C.P.; Bren-mattison, Y.; Vant-hull, B.; Vargas, A.M.; Wasserman, R.L.; Grimm, C.C. Heat-
induced alterations in cashew allergen solubility and IgE binding. Toxicol. Reports 2016, 3, 244–251.
21. Costa, J.; Oliveira, M.B.P.P.; Mafra, I. Effect of thermal processing on the performance of the novel sin-
gle-tube nested Real Time PCR for the detection of walnut allergens in sponge cakes. Food Res. Int.
2013, 54, 1722–1729.
22. Gryson, N. Effect of food processing on plant DNA degradation and PCR-based GMO analysis: A re-
view. Anal. Bioanal. Chem. 2010, 396, 2003–2022.
23. Iniesto, E.; Jimenez, A.; Prieto, N.; Cabanillas, B.; Burbano, C.; Pedrosa, M.M.; Rodriguez, J.; Muzquiz,
M.; Crespo, J.F.; Cuadrado, C.; et al. Real Time PCR to detect hazelnut allergen coding sequences in
processed foods. Food Chem 2013, 138, 1976–1981.
24. Linacero, R.; Ballesteros, I.; Sanchiz, Á.; Prieto, N.; Elisa, I.; Martinez, Y.; Pedrosa, M.; Muzquiz, M.;
Cabanillas, B.; Rovira, M.; et al. Detection by Real Time PCR of Walnut Allergen Coding Sequences in
Processed Foods. Food Chem. 2016, 202, 334–340.
25. Prieto, N.; Iniesto, E.; Burbano, C.; Cabanillas, B.; Pedrosa, M.M.; Rovira, M.; Rodr??guez, J.; Muzquiz,
M.; Crespo, J.F.; Cuadrado, C.; et al. Detection of almond allergen coding sequences in processed foods
by real time PCR. J. Agric. Food Chem. 2014, 62, 5617–5624.
26. Sanchiz, A.; Ballesteros, I.; Martin, A.; Rueda, J.; Pedrosa, M.M.; Dieguez, M. del C.; Rovira, M.; Cuad-
rado, C.; Linacero, R. Detection of pistachio allergen coding sequences in food products: A comparison
of two real time PCR approaches. Food Control 2017, 75, 262–270.
27. Scaravelli, E.; Brohée, M.; Marchelli, R.; Van Hengel, A.J. The effect of heat treatment on the detection
of peanut allergens as determined by ELISA and Real Time PCR. Anal. Bioanal. Chem. 2009, 395, 127–
137.Preprints (www.preprints.org) | NOT PEER-REVIEWED | Posted: 28 May 2021 doi:10.20944/preprints202104.0382.v2
28. Brzezinski, J.L. Detection of Cashew Nut DNA in spiked Baked goods using Real Time Polymerase
Chain Reaction Method. 2006, 89, 1035–1038.
29. Demmel, A.; Hupfer, C.; Hampe, E.I.; Busch, U.; Engel, K.H. Development of a Real Time PCR for the
detection of lupine DNA (Lupinus species) in foods. J. Agric. Food Chem. 2008, 56, 4328–4332.
30. Puente-lelievre, C.; Eischeid, A.C. Development and Evaluation of a Real Time PCR Multiplex Assay
for the Detection of Allergenic Peanut Using Chloroplast DNA Markers. J. Agric. Food Chem. 2018, 66,
8623–8629.
31. Ladenburger, E.-M.; Dehmer, M.; Grünberg, R.; Waiblinger, H.-U.; Stoll, D.,; Bergemann, J. Highly Sen-
sitive Matrix-Independent Quantification of major food allergens peanut and soy by competitive real-
time PCR targeting mitochondrial DNA. Journal of AOAC International 2019, 101(1), 170-184.
32. Kim, J. H.; Hong, J. Y.; Moon, J.-C.; Kwon, K., ; Jang, C. S. Development of molecular markers for
detecting almond, peanut, pine nut, and walnut in commercial food using quantitative real-time PCR.
Applied Biological Chemistry 2018, 61(3), 345-354.
33. Cuadrado, C.; Sanchiz, A.; Vicente, F.; Ballesteros, I.; Linacero, R., Changes Induced by Pressure Pro-
cessing on Immunoreactive Proteins of Tree Nuts. Molecules 2020, 25, (4), 11.
34. Vicente, F.; Sanchiz, A.; Rodríguez-Pérez, R.; Pedrosa, M.; Quirce, S.; Haddad, J.; Besombes, C.; Lin-
acero, R.; Allaf, K.; Cuadrado, C. Influence of instant controlled pressure drop (DIC) on allergenic po-
tential of tree nuts. Molecules 2020, 25.
35. Costa, J.; Melo, V.S.; Santos, C.G.; Oliveira, M.B.P.P.; Mafra, I. Tracing tree nut allergens in chocolate: A
comparison of DNA extraction protocols. Food Chem. 2015, 187, 469–476.
36. Sanchiz, A.; Ballesteros, I.; Marqués, E.; Dieguez, M.C.; Rueda, J.; Cuadrado, C.; Linacero, R. Evaluation
of locked nucleic acid and TaqMan probes for specific detection of cashew nut in processed food by
real time PCR. Food Control 2018, 89, 227–234
37. Bustin, S.A.; Benes, V.; Garson, J.A.; Hellemans, J.; Huggett, J.; Kubista, M.; Mueller, R.; Nolan, T.; Pfaffl,
M.W.; Shipley, G.L.; et al. The MIQE Guidelines: Minimum Information for Publication of Quantitative
Real Time PCR Experiments. Clin. Chem. 2009, 55, 611–622.
38. Lopez-Calleja, I.M.; de La Cruz, S.; Gonzalez, I.; Garcia, T.; Martin, R. Market analysis of food products
for detection of allergenic walnut (Juglans regia) and pecan (Carya illinoinensis) by Real Time PCR.
Food Chem. 2015, 177, 111–119.
39. Lopez-Calleja, I.M.; de la Cruz, S.; González, I.; García, T.; Martín, R. Survey of undeclared allergenic
pistachio (Pistacia vera) in commercial foods by hydrolysis probe Real Time PCR. Food Control 2014,
39, 49–55.
40. Garino, C.; De Paolis, A.; Coïsson, J.D.; Bianchi, D.M.; Decastelli, L.; Arlorio, M. Sensitive and specific
detection of pine nut (Pinus spp.) by Real Time PCR in complex food products. Food Chem. 2016, 194,
980–985.
41. Brežná, B.; Dudášová, H.; Kuchta, T. A novel Real Time polymerase chain reaction method for the
detection of Brazil nuts in food. J. AOAC Int. 2010, 93, 197–202.
42. Sanchiz, A.; Cuadrado, C.; Haddad, J.; Linacero, R. Effect of Instant Controlled Pressure Drop ( DIC )
treatment on the detection of nut allergens by Real Time PCR. Foods 2020, 9, 729–742.
43. de la Cruz, S.; Lopez-Calleja, I.; Martin, R.; Gonzalez, I.; Alcocer, M.; Garcia, T. Recent advances in the
detection of allergens in foods. In Food Allergens: Methods and Protocols, Methods in Molecular Biol-
ogy.; Lin, J., Alcocer, M., Eds.; Springer Science, 2017; Vol. 1592, pp. 263–295 ISBN 978-1-4939-6923-4.
44. Linacero, R.; Sanchiz, A.; Ballesteros, I.; Cuadrado, C. Application of Real Time PCR for tree nut allergen
detection in processed foods. Crit. Rev. Food Sci. Nutr. 2020, 60, 1077–1093.
45. Scaravelli, E.; Brohée, M.; Marchelli, R.; Van Hengel, A.J. The effect of heat treatment on the detection
of peanut allergens as determined by ELISA and Real Time PCR. Anal. Bioanal. Chem. 2009, 395, 127–
137.
46. Lopez-Calleja, I.M.; de la Cruz, S.; Pegels, N.; Gonzalez, I.; Garcia, T.; Martin, R. High resolution Taq-
Man Real Time PCR approach to detect hazelnut DNA encoding for ITS rDNA in foods. Food Chem
2013, 141, 1872–1880.
47. Villa, C.; Costa, J.; Gondar, C.; Oliveira, M.B.P.P.; Mafra, I. Effect of food matrix and thermal processing
on the performance of a normalised quantitative Real Time PCR approach for lupine (Lupinus albus)
detection as a potential allergenic food. Food Chem. 2018, 262, 251–259.You can also read