Fibre-Cement Panel Ventilated Façade Smart Control System
←
→
Page content transcription
If your browser does not render page correctly, please read the page content below
materials
Article
Fibre-Cement Panel Ventilated Façade Smart Control System
Anna Adamczak-Bugno * , Grzegorz Świt and Aleksandra Krampikowska

                                          Faculty of Civil Engineering and Architecture, Kielce University of Technology, 25-314 Kielce, Poland;
                                          gswit@tu.kielce.pl (G.Ś.); akramp@tu.kielce.pl (A.K.)
                                          * Correspondence: aadamczak@tu.kielce.pl

                                          Abstract: This paper outlines a design for a fibre-cement panel ventilated façade smart control system
                                          based on the acoustic emission method. The paper also provides methodology and test results, as
                                          well as statistical analysis of the three-point bending results with AE signal acquisition as a basis
                                          for the development of the system in question. The test items were samples cut from a full-size
                                          fibre-cement panel for interior and exterior use, according to the standard guidelines. The recorded
                                          acoustic emission signals were classified statistically into four classes, which were assigned to the
                                          processes occurring in the material structure as a result of the applied load. The system development
                                          was based on the differences between the characteristics of the individual signal classes and their
                                          number for each test case, as well as on the different distribution of successive classes over time.
                                          Given the results of the tests and the resulting conclusions indicating the applicability of the acoustic
                                          emission method (based on signal classification using the k-means algorithm for the assessment
                                          of variations in the mechanical parameters of cement-fibre composites), a methodology for such
                                          assessment was therefore developed. The approach proposed is a reasonable method for assessing the
                                          variation in mechanical parameters of fibre-cement panels on the basis of the parameters determined
                                by the non-destructive method indicated.


Citation: Adamczak-Bugno, A.; Świt,      Keywords: ventilated façade; acoustic emission method; fibre-cement boards
G.; Krampikowska, A. Fibre-Cement
Panel Ventilated Façade Smart
Control System. Materials 2021, 14,
5076. https://doi.org/10.3390/            1. Introduction
ma14175076
                                                Fibre-reinforced cement-based products have been used in the construction industry
                                          for over a century. The inventor of the first fibre-cement panels was an engineer from
Academic Editor: Edyta Pawluczuk
                                          the Czech Republic, Ludwik Hatschek [1–4], who led the development and patenting of
                                          the technology to produce this type of composite. The original product, called ‘Eternit’,
Received: 15 August 2021
                                          demonstrated high strength and durability while being light, moisture-resistant, and
Accepted: 2 September 2021
Published: 5 September 2021
                                          non-combustible. The combination of these parameters in fibre-cement panels was an
                                          outstanding innovation globally. The fibre-cement panels have proven to be the most
Publisher’s Note: MDPI stays neutral
                                          popular roofing material in the world over the last century [5]. The backlash came when
with regard to jurisdictional claims in
                                          one component, asbestos, was found to be carcinogenic [6]. In the 1990s, work began on
published maps and institutional affil-
                                          replacing the toxic component. Since then, the cement matrix has been reinforced with fibres
iations.                                  that do not pose a health risk to users, mainly cellulose fibres. Fibre-cement panels available
                                          on the market today may include cement, cellulose fibres, synthetic fibres, and various
                                          additives and admixtures [7] which makes them a different type of building product in
                                          relation to the original. Limestone dust, mica, perlite, kaolin, and microspheres are the most
                                          common additives and fillers in fibre-cement panels [8–12]. Products containing recycled
Copyright: © 2021 by the authors.
Licensee MDPI, Basel, Switzerland.
                                          materials (cellulose recycling) are also available [13]. All types of fillers used contribute to
This article is an open access article
                                          the innovative properties of fibre-cement products and are part of sustainable development.
distributed under the terms and
                                                The cement-fibre panels are a material exposed to defects and damage, both during
conditions of the Creative Commons        the manufacturing process and in service. This fact significantly affects their properties
Attribution (CC BY) license (https://     and durability parameters. The production of panels is a complex process governed by
creativecommons.org/licenses/by/          the properties and quantities of the individual components and how they are incorporated
4.0/).                                    into the finished product [14–18]. During the consecutive production stages, the panels

Materials 2021, 14, 5076. https://doi.org/10.3390/ma14175076                                                 https://www.mdpi.com/journal/materials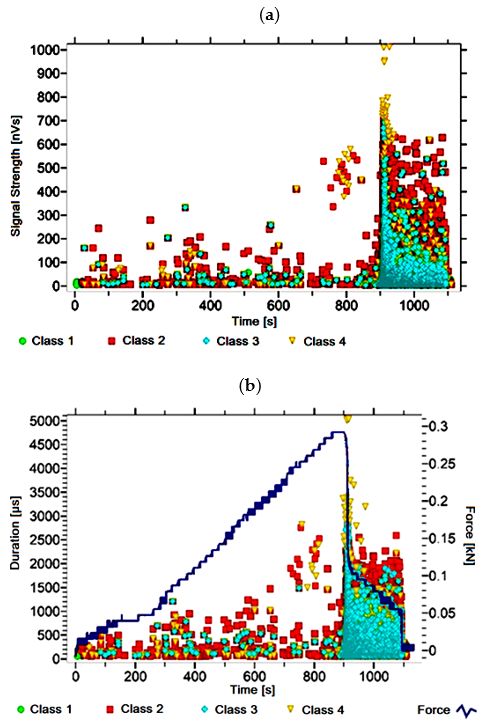
Materials 2021, 14, 5076                                                                                            2 of 32

                           are exposed to defects and damage in the form of large pores, delamination, cracks and
                           discontinuities in the reinforcement fibre distribution. In service conditions, the fibre-
                           cement panels are exposed to variable atmospheric and environmental conditions, both
                           in terms of temperature and humidity, in the form of significant temperature fluctuations,
                           including transitions through 0 ◦ C in a daily cycle (cyclic freeze-thaw phenomenon), the
                           likelihood of chemical aggression in the form of acid rainfall, and exposure to ultraviolet
                           rays [19–25]. In addition, the fibre-cement cladding panels are exposed to extreme service
                           conditions. The most destructive of these is heat and direct fire exposure in a fire scenario.
                           Service impacts in the form of horizontal force are also potentially damaging from a
                           strength perspective. The occurrence of the above-mentioned conditions during the service
                           life of the panels is related to the fact that they are used as external façade cladding in the
                           ventilated façade system, as balcony and terrace cover panels, and as wall finishes inside
                           buildings [26].
                                 When these factors occur, there is a high probability that the cement-fibre panel
                           structure will change, resulting in a deterioration of the performance and durability prop-
                           erties [27–30]. Therefore, cladding panels should meet the requirements set out in the
                           standards and legislation [31], taking into account the impacts indicated. Determining
                           the extent to which fibre-cement panels are affected by service conditions is important,
                           particularly for the external parts of buildings, as this has a direct impact on the safe use
                           of a building. This issue seems to be particularly relevant for tall and high-rise buildings.
                           The question of providing a proven, reliable, and durable cladding material is therefore
                           indisputable. The mere determination of the impact of the presented conditions on the
                           change of strength parameters of the cement-fibre panels is one of the basic conditions of
                           safe operation. However, it is important to stress that a very significant contribution to the
                           final product quality and durability is also attributable to testing at the product production
                           stage [32–34].
                                 Fibre-cement is subject to the same processes as other cement-based products. One of
                           the most intensive is carbonatization, the intensity of which depends, among other things,
                           on the concentration of carbon dioxide. The way the material behaves during use is also
                           affected by its layered structure. The studies on cement-fibre materials show that in the
                           first years of service, the reaction between the calcium phases and carbon dioxide from
                           air and water has a positive effect on the bonding between the product layers. However,
                           after only about five years, reactions of the carbon with hydration products result in
                           moisture migration tracks in the material. Long-term exposure of the panels to weather
                           ultimately leads to a reduction in the bonding between the layers and the formation of
                           a discontinuity in the matrix. Cellulose fibres also become particularly vulnerable due
                           to increased moisture movement in the material and freeze-thaw cycles. The gradual
                           depolymerisation of the fibres, resulting in, among other things, a decrease in mechanical
                           strength, is a direct effect of these interactions. It is estimated that after about 15 years of
                           service, the strength of cement-fibre panels decreases by up to 40% [31,32].
                                 Due to the processes taking place in the material of cement-cellulose boards and due to
                           the operational conditions to which they are exposed, it is necessary to at least periodically
                           monitor the buildings made with their use. This type of control should make it possible to
                           detect a possible decrease in the mechanical parameters of the boards.
                                 Taking into account the conclusions of the literature review, steps were taken to select
                           a non-destructive method that would allow the control of the built-in boards. The result
                           of the carried-out work is the system for assessing the change in mechanical parameters
                           of fiber-cement panels, presented in the article, based on the acoustic emission method.
                           The paper also presents the research that is the basis for the development of the final
                           diagnostic methodology.

                           2. Materials and Methods
                              The tests prior to the system development to assess the change in mechanical perfor-
                           mance of the fibre-cement panels involved three-point bending tests on samples cut from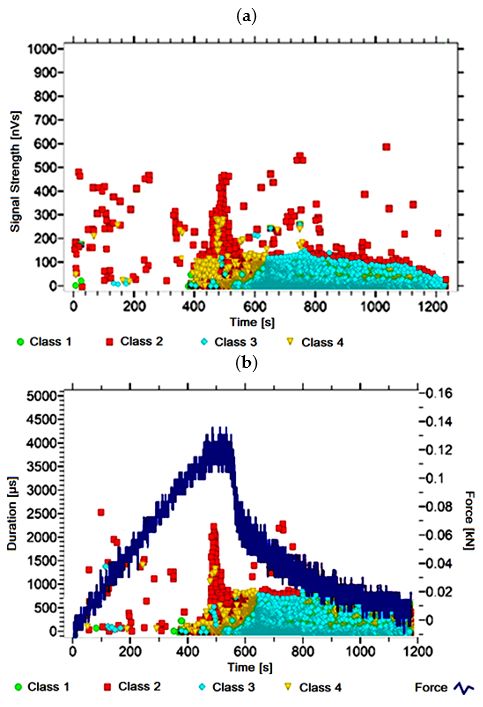
Materials 2021, 14, x FOR PEER REVIEW 3 of 34
2. Materials and Methods
Materials 2021, 14, 5076 The tests prior to the system development to assess the change in mechanical perfor- 3 of 32
mance of the fibre-cement panels involved three-point bending tests on samples cut from
full-size panels together with acoustic emission (AE) signal acquisition. The bending con-
figuration and dimensions of the test pieces were chosen based on the standard guide-
full-size panels together with acoustic emission (AE) signal acquisition. The bending con-
lines.
figuration and dimensions of the test pieces were chosen based on the standard guidelines.
The test pieces were subjected to environmental conditions (soaking in water for 1 h
The test pieces were subjected to environmental conditions (soaking in water for
and 24 h, cyclic freeze-thaw in an air-water environment for 10 cycles, 25 cycles, 50 cycles,
1 h and 24 h, cyclic freeze-thaw in an air-water environment for 10 cycles, 25 cycles,
and 100 cycles) and extreme conditions (burning in a laboratory oven for 3 h at 230 °C,
50 cycles, and 100 cycles) and extreme conditions (burning in a laboratory oven for 3 h
exposure to direct fire for 2.5 min, 5.0 min, 7.5 min, 10.0 min), and were also tested in air-
at 230 ◦ C, exposure to direct fire for 2.5 min, 5.0 min, 7.5 min, 10.0 min), and were also
dry condition. The acoustic emission method in the energy approach was used as the main
tested in air-dry condition. The acoustic emission method in the energy approach was
testing method to determine the change in mechanical parameters of cement-fibre com-
used as the main testing method to determine the change in mechanical parameters of
posites.
cement-fibre composites.
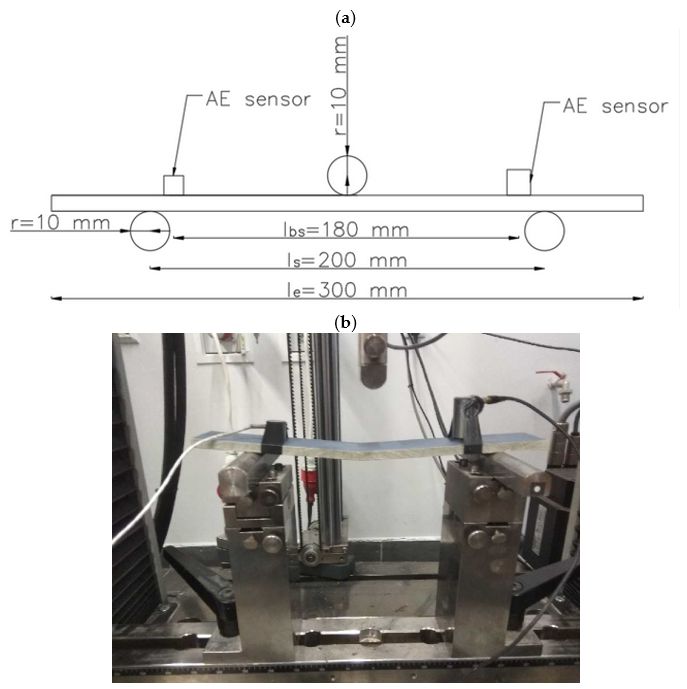
The scheme of the test stand and a photograph of one of the tested samples are shown
The scheme of the test stand and a photograph of one of the tested samples are shown
in Figure 1. Cuboidal 300 × 50 × 8 mm samples were cut from 1.25 × 3.10 m and 8 mm thick
in Figure 1. Cuboidal 300 × 50 × 8 mm samples were cut from 1.25 × 3.10 m and 8 mm
panels for three-point
thick panels bending.
for three-point Load Load
bending. F, displacement and acoustic
F, displacement emission
and acoustic signals
emission AE
signals
were recorded during the tests. The distance between the support axes (ls) was 200 mm.
AE were recorded during the tests. The distance between the support axes (ls ) was 200 mm.
AA Zwick
ZwickRoell
Roelltesting
testingmachine
machinewas wasused
usedinin
the tests.
the TheThe
tests. constant loading
constant loadingspeed waswas
speed 0.1
mm/s.
0.1 mm/s.
Figure 1.
Figure Test stand
1. Test stand diagram:
diagram: (a)
(a) load
load diagram;
diagram; (b)
(b) aa photograph
photograph of
of one
one of
of the
the samples.
samples.
According to
According to the
the manufacturer’s
manufacturer’s declaration,
declaration, the
the boards
boards from
from which
which the
the test
test elements
elements
were cut out consisted of Portland cement, mineral binders, cellulose fibers, color dyes,
were cut out consisted of Portland cement, mineral binders, cellulose fibers, color dyes, and
admixtures. Accurate quantitative and qualitative data on the composition are protected
by patent law. The declared technical parameters of the board are presented in Table 1.
Fourteen standard AE parameters were used to determine the change in mechanical
parameters:
1. Duration;
2. Rise time;
3. Decay time;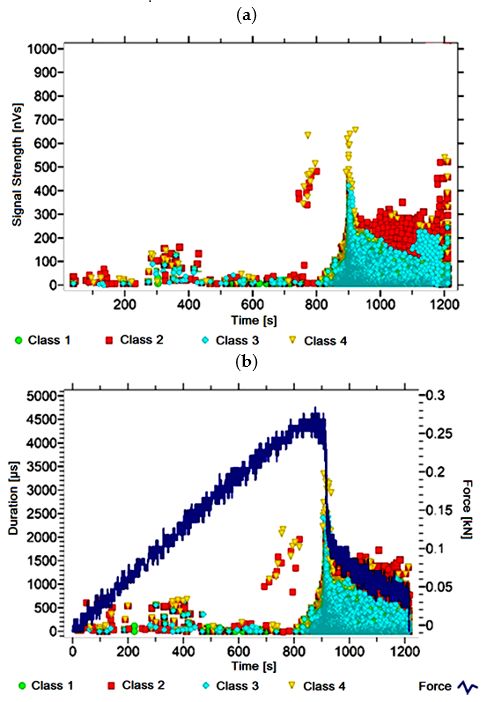
Materials 2021, 14, 5076                                                                                              4 of 32

                           4.      RMS;
                           5.      Counts;
                           6.      Counts to peak;
                           7.      Amplitude;
                           8.      Energy;
                           9.      Average frequency;
                           10.     Reverberation frequency;
                           11.     Initiation frequency;
                           12.     Absolute energy;
                           13.     Signal strength;
                           14.     ASL.

                           Table 1. The declared technical parameters of the boards.

                                       Density              Dry state       PN-EN 12467         ≥1.65          g/cm3
                                  Flexural strength      Perpendicular      PN-EN 12467          24.0          N/mm2
                                  Flexural strength        In parallel      PN-EN 12467          18.5          N/mm2
                                 Modulus of elasticity                      PN-EN 12467         12,000         N/mm2
                                   Stretching with
                                                              30–95%                              1.0           mm/m
                                      humidity
                                       Porosity               0–100%                              >18             %

                                 These parameters were used to classify the signals using pattern recognition methods
                           with arbitrary class division (USPR). Scattergram of signal strength and duration were used
                           to present the results of the tests after analysis with the created reference signal database.
                           The advantage of creating a database of reference signals is the fact of assigning invariable
                           characteristics to individual classes, marked by graphic symbols and colour. As a result,
                           we can use selected parameters (preferably depicting the transformation of destructive
                           processes) rather than all AE parameters to analyse the processes taking place, which
                           facilitates the interpretation of the results by people not trained in acoustic emission testing.
                           According to Świt et al. [33], analysis using the parameters of signal power and duration
                           illustrates well the distribution of signals of the different classes and makes it possible to
                           observe the differences between them.
                                 To assess the change in mechanical parameters as affected by service (environmental
                           and extreme) conditions, a three-point bending test was conducted during the MOR
                           flexural strength test. The standard parameter for assessing the change (deterioration) of
                           the mechanical parameters of the tested cement-fibre panels are the classes of acoustic
                           emission signals with the destructive processes assigned to them, namely fibre cracking
                           and fibre pull-out from the cement matrix. The decline in recorded events of this nature
                           allowed assessment of the extent to which mechanical parameters change when exposed to
                           service conditions. The other classes serve as a preliminary confirmation of the presence of
                           other destructive processes in the tested pieces.
                                 On the basis of the preliminary tests performed, it was confirmed that the external
                           panels have the mechanical parameters as declared by the manufacturers. It is important
                           to note, however, that the fibre-cement panel compositions and their technological process
                           are strictly protected by the manufacturers, and information on specific components, their
                           quantities and suppliers, and production details are restricted extensively. The fibre-cement
                           panels tested were made using basic components, such as Portland cement CEM I 42.5N,
                           cellulose fibres, synthetic fibres PVA and additives, such as limestone dust. The coloured
                           panels have additional colouring admixtures. All panels were manufactured according to
                           the Hatschek process.
                                 The test samples were cut in one direction, parallel to the length of the panel, avoiding
                           the 50 mm edge zone of the panel.
                                 The changes in the mechanical parameters of the fibre-cement panels under environ-
                           mental and extreme service conditions were assessed for the following test cases: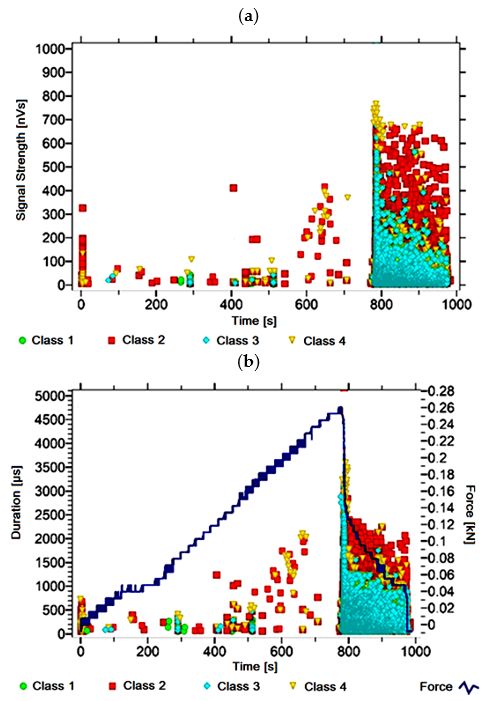
Materials 2021, 14, 5076                                                                                         5 of 32

                           •    Air-dry condition (no destruction, reference condition, referential);
                           •    Soaking in water for 1 h;
                           •    Soaking in water for 24 h;
                           •    25 soaking-drying cycles;
                           •    50 bath-drying cycles;
                           •    10 freeze-thaw cycles;
                           •    25 freeze-thaw cycles;
                           •    50 freeze-thaw cycles;
                           •    100 freeze-thaw cycles;
                           •    Direct exposure to flame (resulting in a temperature of up to 400 ◦ C) for 2.5 min;
                           •    Direct exposure to flame (resulting in a temperature of up to 400 ◦ C) for 5 min;
                           •    Direct exposure to flame (resulting in a temperature of up to 400 ◦ C) for 7.5 min;
                           •    Direct exposure to flame (resulting in a temperature of up to 400 ◦ C) for 10 min;
                           •    Temperature of 230 ◦ C for 3 h.
                               The creation of a reference signal database in the acoustic emission method involves
                           several steps. These include:
                           •    Signal generation under laboratory conditions during the destruction of standard
                                samples in a specified manner;
                           •    Comparison of signals from the destruction of model samples subjected to different
                                destruction processes;
                           •    Verification of the reference signals generated by various types and lengths of com-
                                posite panel loaded to destruction;
                           •    Final verification on components during standard operation (this step will be per-
                                formed during further tests).
                               The next step was to adopt the standard parameters needed to create a reference signal
                           database, namely:
                           •    The assumed number of destructive processes (based on literature and own research);
                           •    Measures of distance between clusters–in this case Euclidean space with time distribu-
                                tion;
                           •    The number of iterations necessary to determine the optimal number of classes (min.
                                1,000,000).
                                 The reference file with four classes obtained in this way was then verified on the
                            samples in laboratory tests with single destructive processes prevailing.
                                 As a result of the work performed, a database of reference signals was obtained
                            for assessing the technical condition of the panels. Using the reference signal database,
                            the individual AE parameters are only an illustration of the processes taking place and
                            not a source for analysis. Therefore, it is important to apply BIG DATA analyses to create
                           “BLACK BOX”, which can be used for structural health analysis by people without academic
                            knowledge of AE.
                                 The number of classes was imposed by a statistical software using the k-means
                            algorithm for the analysis of AE signals based on the literature reports. Another criterion
                            to explain the imposed number of classes was how well the individual signals matched the
                            correct classes, which in this case was over 90%.

                           3. Results
                                After dividing the recorded AE signals into four classes, using the k-means algorithm,
                           two of the fourteen acoustic emission parameters–the signals strength and their duration
                           –were used as illustrations of the processes taking place. Individual AE signal classes
                           assigned, based on preliminary tests, to processes occurring in the structure of the tested
                           material include:
                           •    Class 1 (green colour)–micro-crack initiation;
                           •    Class 2 (red colour)–crack development and spread;
                           •    Class 3 (blue)–material delamination, fibre separation;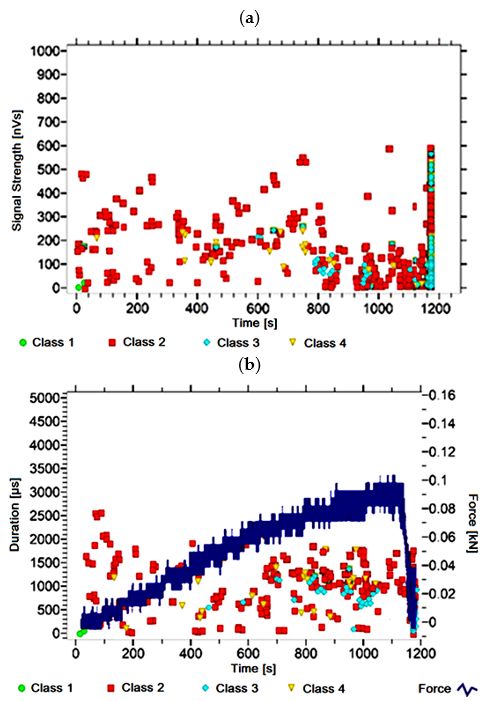
Materials 2021, 14, 5076                                                                                                                  6 of 32

                                 •    Class 4 (yellow colour)–fibre breakage, material deterioration;
                                      The paper presents graphs of the descriptors over time, including their division into
                                 classes, for mock samples from each of the tested series. The results obtained for samples
                                 within the group were similar.

                                 3.1. AE Signal Grouping Results
                                 3.1.1. Signal Analysis for Research Case A1
                                          For the sample from the A1 (Figure 2) test case, signals of all four classes were observed
                                     from the start of each recorded waveform. The signals corresponding to the initiation
                                     of microcracks appear from the start of the test until they reach 600 s; their power is up
                                     to 50 nVs and their duration up to 120 µs. The signals linked to crack development and
                                     spread are recorded throughout the measurement and, in most cases, are characterised by
                                     a power of up to 650 nVs and a duration of up to 2700 µs. Events corresponding to material
                                     delamination and fibre detachment were also recorded from the start of the test, but their
                                     intensity increases after 900 s. The strength of the signals associated with the indicated
                                     processes reaches 700 nVs. In turn, the duration of events of this class reaches 3000 µs. The
 Materials 2021, 14, x FOR PEER REVIEW                                                                                    7 of 34
                                     power of the signals associated with fibre breakage and component destruction            is up to
                                     1000 nVs and their duration is generally up to 4500 µs.

                                            Graphs of acoustic
                                 Figure2.2. Graphs
                                Figure                  acoustic emission
                                                                  emission signals
                                                                             signalsfor
                                                                                     forananexemplary
                                                                                              exemplarysample  of of
                                                                                                          sample  A1 A
                                                                                                                     series:  (a) (a)
                                                                                                                       1 series:  signal strength
                                                                                                                                      signal
                                strength  over
                                 over time;  (b)time; (b) distribution
                                                  distribution         of the duration
                                                                of the duration  of theof  the signals
                                                                                         signals  over over
                                                                                                       timetime
                                                                                                            withwith  the force
                                                                                                                 the force       increment
                                                                                                                            increment    curve.
                                curve.

                                3.1.2. Signal Analysis for Research Case A2
                                     For the sample from the A2 (Figure 3) test case, signals of all four classes were ob-
                                served from the start of each recorded waveform. The signals corresponding to the initia-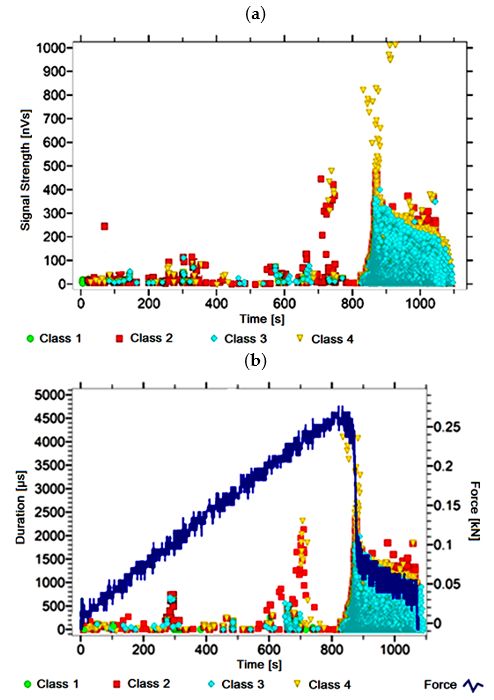
Materials 2021, 14, 5076                                                                                                              7 of 32

                                 3.1.2. Signal Analysis for Research Case A2
                                         For the sample from the A2 (Figure 3) test case, signals of all four classes were observed
                                    from the start of each recorded waveform. The signals corresponding to the initiation of
                                    microcracks appear from the start of the test until they reach 650 s; their power is up to
                                    130 nVs and their duration up to 200 µs. The signals linked to crack development and
                                    spread are recorded throughout the measurement and, in most cases, are characterised by
                                    a power of up to 550 nVs and a duration of up to 1700 µs. Events corresponding to material
                                    delamination and fibre detachment were also recorded from the start of the test, but their
                                    intensity increases after 800 s. The strength of the signals associated with the indicated
                                    processes reaches 500 nVs. In turn, the duration of events of this class reaches 2500 µs. The
Materials 2021, 14, x FOR PEER REVIEW                                                                                        8 of 34
                                    power of the signals associated with fibre breakage and component destruction is up to
                                    700 nVs and their duration is 4000 µs.

                                        3. Graphs
                                 Figure 3.
                                Figure     Graphsofofacoustic
                                                       acousticemission  signals
                                                                  emission       for an
                                                                            signals  forexemplary   sample
                                                                                          an exemplary      of A2 series:
                                                                                                          sample   of A2 (a) signal
                                                                                                                          series: (a)strength
                                                                                                                                       signal
                                 over time;
                                strength    (b)time;
                                         over   distribution  of the duration
                                                     (b) distribution         of the signals
                                                                      of the duration   of theover time
                                                                                               signals   with
                                                                                                       over   thewith
                                                                                                            time  forcethe
                                                                                                                        increment    curve.
                                                                                                                           force increment
                                curve.
                                 3.1.3. Signal Analysis for Research Case A3
                                3.1.3. For the Analysis
                                       Signal  sample from   the A3 (Figure
                                                         for Research  Case4)A3test case, signals of all four classes were observed
                                 fromForthethe
                                            start
                                               sample from the A3 (Figure 4) The
                                                  of each recorded   waveform.    test signals corresponding
                                                                                       case, signals  of all fourtoclasses
                                                                                                                    the initiation
                                                                                                                           were ob-of
                                 microcracks    appear  from   the start of the test until  they reach    1000 s; their power
                                served from the start of each recorded waveform. The signals corresponding to the initia-       is up
                                tion of microcracks appear from the start of the test until they reach 1000 s; their power is
                                up to 45 nVs and their duration up to 150 µs. The signals linked to crack development and
                                spread are recorded throughout the measurement and, in most cases, are characterised by
                                a power of up to 600 nVs and a duration of up to 2500 µs. Events corresponding to material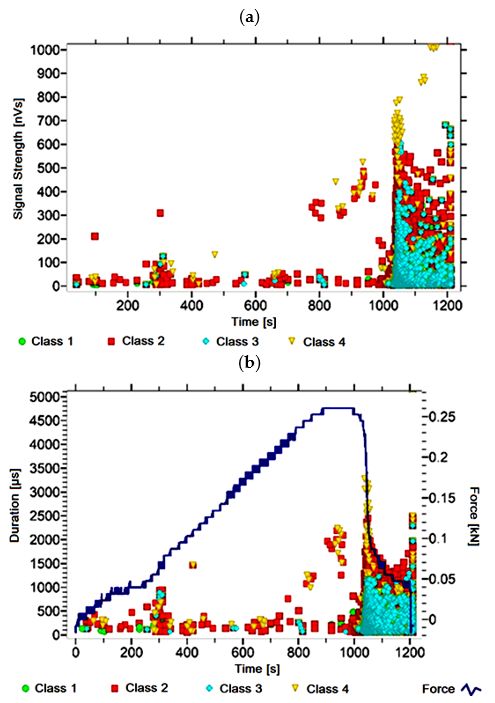
Materials 2021, 14, 5076                                                                                                           8 of 32

                                    to 45 nVs and their duration up to 150 µs. The signals linked to crack development and
                                    spread are recorded throughout the measurement and, in most cases, are characterised by
                                    a power of up to 600 nVs and a duration of up to 2500 µs. Events corresponding to material
                                    delamination and fibre detachment were also recorded from the start of the test, but their
                                    intensity increases after 1000 s. The strength of the signals associated with the indicated
                                    processes reaches 700 nVs. In turn, the duration of events of this class reaches 2500 µs.
Materials 2021, 14, x FOR PEER REVIEW
                                                                                                                              The
                                                                                                                          9 of 34
                                    power of the signals associated with fibre breakage and component destruction is even up
                                    to 1000 nVs and their duration is 3500 µs.

                                Figure 4. Graphs
                               Figure     Graphs ofofacoustic
                                                      acousticemission  signals
                                                                 emission       for an
                                                                           signals  forexemplary  sample
                                                                                        an exemplary     of A3 series:
                                                                                                       sample  of A3 (a)  signal
                                                                                                                       series: (a)strength
                                                                                                                                    signal
                                over time;
                               strength    (b)time;
                                        over   distribution  of the duration
                                                    (b) distribution         of the signals
                                                                     of the duration  of theover time
                                                                                            signals   with
                                                                                                    over   thewith
                                                                                                         time  forcethe
                                                                                                                     increment    curve.
                                                                                                                        force increment
                               curve.
                                3.1.4. Signal Analysis for Research Case A4
                               3.1.4. For the Analysis
                                      Signal  sample from   the A4 (Figure
                                                        for Research   Case 5)
                                                                             A4test case, signals of all four classes were observed
                                fromForthethe
                                           start of each  recorded   waveform.
                                              sample from the A4 (Figure 5) test     The  signals
                                                                                        case, signalscorresponding     to the were
                                                                                                        of all four classes    initiation
                                                                                                                                      ob-
                                of microcracks    appear  from  the  start of  the  test until they   reach  600  s; their
                               served from the start of each recorded waveform. The signals corresponding to the initia-   power    is up
                                to 60ofnVs
                               tion         and theirappear
                                        microcracks   duration   up the
                                                              from   to 200     ofThe
                                                                         startµs.       signals
                                                                                   the test until linked  to crack
                                                                                                    they reach   600development
                                                                                                                      s; their power andis
                                spread   are recorded  throughout   the measurement        and,  in  most  cases, are  characterised
                               up to 60 nVs and their duration up to 200 µs. The signals linked to crack development and               by
                                a power
                               spread     ofrecorded
                                        are  up to 500throughout
                                                       nVs and a duration     of up to 2100
                                                                   the measurement              inEvents
                                                                                          and,µs.           corresponding
                                                                                                    most cases,              to material
                                                                                                                 are characterised     by
                                delamination and fibre detachment were also recorded from the start of the test, but their
                               a power of up to 500 nVs and a duration of up to 2100 µs. Events corresponding to material
                                intensity increases after 800 s. The strength of the signals associated with the indicated
                               delamination and fibre detachment were also recorded from the start of the test, but their
                               intensity increases after 800 s. The strength of the signals associated with the indicated
                               processes reaches 450 nVs. In turn, the duration of events of this class reaches 2000 µs. The
                               power of the signals associated with fibre breakage and component destruction is even
                               up to 1000 nVs and their duration is 4500 µs.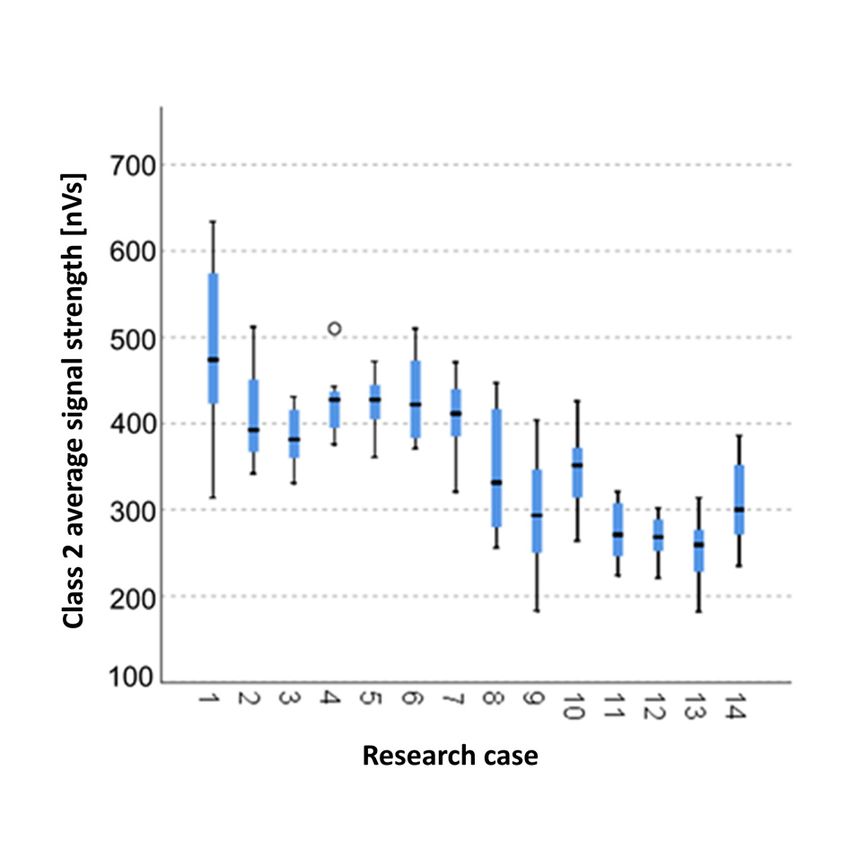
Materials 2021, 14, 5076                                                                                                              9 of 32

                                   processes reaches 450 nVs. In turn, the duration of events of this class reaches 2000 µs. The
Materials 2021, 14, x FOR PEER REVIEW                                                                                   10 of 34
                                   power of the signals associated with fibre breakage and component destruction is even up
                                   to 1000 nVs and their duration is 4500 µs.

                                             Graphs of acoustic
                                   Figure5.5.Graphs
                                 Figure                  acousticemission
                                                                  emissionsignals forfor
                                                                            signals   an exemplary   sample
                                                                                          an exemplary      of A4 of
                                                                                                         sample   series: (a) signal
                                                                                                                     A4 series:   (a) strength
                                                                                                                                       signal
                                   over time; (b) distribution of the duration of the  signals over time with the force increment     curve.
                                 strength over time; (b) distribution of the duration of the signals over time with the force increment
                                 curve.
                                   3.1.5. Signal Analysis for Research Case A5
                                        For theAnalysis
                                 3.1.5. Signal   sample from   the A5 (Figure
                                                          for Research   Case A6)5 test case, signals of all four classes were observed
                                   from   the start of each  recorded   waveform.
                                       For the sample from the A5 (Figure 6) test      The   signals
                                                                                          case, signalscorresponding    to thewere
                                                                                                          of all four classes   initiation
                                                                                                                                      ob-
                                   of microcracks
                                 served             appear
                                          from the start     fromrecorded
                                                         of each   the start waveform.
                                                                              of the test until   they reach
                                                                                            The signals        400 s; theirtopower
                                                                                                          corresponding              is up
                                                                                                                              the initia-
                                   to 50
                                 tion  of nVs  and theirappear
                                          microcracks    duration
                                                                fromupthe
                                                                        to 150
                                                                           startµs.  Thetest
                                                                                 of the    signals
                                                                                               untillinked  to crack
                                                                                                      they reach  400development
                                                                                                                      s; their powerand is
                                   spread   are recorded throughout    the  measurement       and  are  characterised
                                 up to 50 nVs and their duration up to 150 µs. The signals linked to crack development by a power of andup
                                   to 600 nVs and a duration of up to 2000 µs. Events corresponding to material delamination
                                 spread are recorded throughout the measurement and are characterised by a power of up
                                   and fibre detachment were also recorded from the start of the test, but their intensity
                                 to 600 nVs and a duration of up to 2000 µs. Events corresponding to material delamination
                                   increases after 800 s. The strength of the signals associated with the indicated processes
                                 and fibre detachment were also recorded from the start of the test, but their intensity in-
                                   reaches 800 nVs. In turn, the duration of events of this class reaches 2300 µs. The power
                                 creases after 800 s. The strength of the signals associated with the indicated processes
                                   of the signals associated with fibre breakage and component destruction is even up to
                                 reaches 800 nVs. In turn, the duration of events of this class reaches 2300 µs. The power
                                   1000 nVs and their duration is 3000 µs.
                                 of the signals associated with fibre breakage and component destruction is even up to
                                 1000 nVs and their duration is 3000 µs.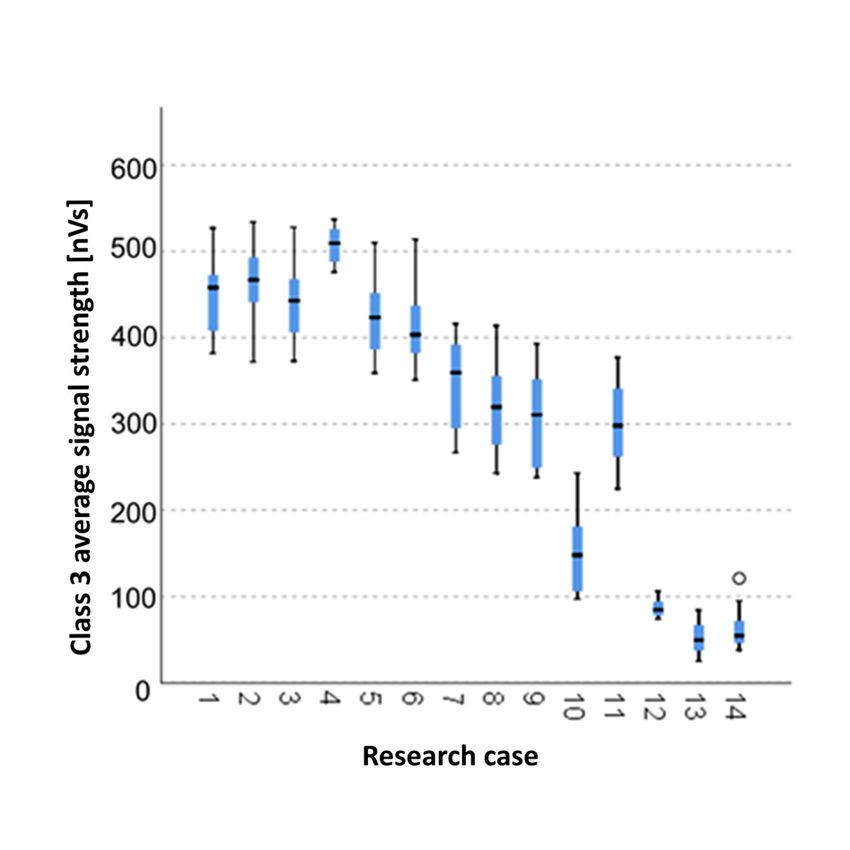
Materials 2021,
   Materials    14,14,
             2021,  x FOR
                       5076 PEER REVIEW                                                                                                10 of 32 11 of 34

                                    Figure 6.6.Graphs
                                   Figure       Graphs of acoustic emission
                                                           of acoustic      signals signals
                                                                        emission    for an exemplary   sample of A5sample
                                                                                             for an exemplary       series: (a)
                                                                                                                              ofsignal strength(a) signal
                                                                                                                                  A5 series:
                                   strength over time; (b) distribution of the duration of the signals over time with the curve.
                                    over time;  (b) distribution of the duration of the  signals over time with the force increment    force increment
                                   curve.
                                    3.1.6. Signal Analysis for Research Case A6
                                         For the sample from the A (Figure 7) test case, signals of all four classes were observed
                                                                6
                                   3.1.6. Signal Analysis for Research Case A6
                                    from the start of each recorded waveform. The signals corresponding to the initiation
                                         For the sample
                                    of microcracks   appearfrom
                                                              from the   A6 (Figure
                                                                    the start          7) test
                                                                              of the test   untilcase,
                                                                                                  they signals
                                                                                                         reach 400 ofs;all four
                                                                                                                        their    classes
                                                                                                                              power   is upwere ob-
                                   served   from
                                    to 50 nVs  andthe  start
                                                    their     of each
                                                          duration   uprecorded
                                                                         to 200 µs.waveform.
                                                                                     The signalsThe      signals
                                                                                                     linked        corresponding
                                                                                                             to crack   developmentto     the initia-
                                                                                                                                        and
                                    spread
                                   tion  of are recorded throughout
                                            microcracks     appear from the the
                                                                            measurement
                                                                                start of the and,
                                                                                                testin until
                                                                                                        most cases,   are characterised
                                                                                                              they reach     400 s; theirbypower is
                                    a power
                                   up  to 50 of upand
                                              nVs  to 500  nVsduration
                                                        their   and a duration
                                                                           up toof200
                                                                                    upµs.
                                                                                        to 2200
                                                                                            Theµs.     Events
                                                                                                  signals      corresponding
                                                                                                            linked              to material
                                                                                                                      to crack development      and
                                    delamination   and  fibre detachment    were   also  recorded    from  the  start of
                                   spread are recorded throughout the measurement and, in most cases, are characterised  the test, but their      by
                                    intensity increases after 700 s. The strength of the signals associated with the indicated
                                   a power of up to 500 nVs and a duration of up to 2200 µs. Events corresponding to material
                                    processes reaches 400 nVs. In turn, the duration of events of this class reaches 2500 µs. The
                                   delamination     and fibre detachment were also recorded from the start of the test, but their
                                    power of the signals associated with fibre breakage and component destruction exceeds
                                   intensity
                                    600 nVs andincreases   after 700
                                                  their duration       s. The
                                                                  is 3000  µs. strength of the signals associated with the indicated
                                   processes reaches 400 nVs. In turn, the duration of events of this class reaches 2500 µs. The
                                   power of the signals associated with fibre breakage and component destruction exceeds
                                   600 nVs and their duration is 3000 µs.
Materials 2021,
Materials 14, 14,
2021, x FOR
5076PEER REVIEW 11 of 32 12 of 34
Figure 7. Graphs of acoustic emission signals for an exemplary sample of A6 series: (a) signal strength
Figure 7. Graphs of acoustic emission signals for an exemplary sample of A6 series: (a) signal
over time; (b) distribution of the duration of the signals over time with the force increment curve.
strength over time; (b) distribution of the duration of the signals over time with the force increment
curve.
3.1.7. Signal Analysis for Research Case A7
For the sample from the A7 (Figure 8) test case, signals of all four classes were observed
3.1.7.
from Signal Analysis
the start of each for Research
recorded Case A7The signals corresponding to the initiation
waveform.
of microcracks appear
For the sample fromthe
from theAstart of the8)test
7 (Figure testuntil they
case, reachof
signals 700alls;four
theirclasses
power were
is ob-
up to 45 nVs and their duration up to 170 µs. The signals linked to crack
served from the start of each recorded waveform. The signals corresponding to the initia- development
and spread are recorded throughout the measurement and are characterised by a power
tion of microcracks appear from the start of the test until they reach 700 s; their power is
of up to 600 nVs and a duration of up to 2300 µs. Events corresponding to material
up to 45 nVs and their duration up to 170 µs. The signals linked to crack development and
delamination and fibre detachment were also recorded from the start of the test, but their
spread are
intensity recorded
increases throughout
at around the strength
800 s. The measurement and are
of the signals characterised
associated with theby a power of up
indicated
toprocesses
600 nVsreaches
and a duration
600 nVs. In ofturn,
up tothe2300 µs. Events
duration corresponding
of events to material
of this class reaches delamination
3000 µs. The
and fibre
power detachment
of the were also
signals associated withrecorded from and
fibre breakage the component
start of thedestruction
test, but their intensity
is even up in-
to 1000 at
creases nVs and their
around 800duration is 5000 µs.
s. The strength of the signals associated with the indicated processes
reaches 600 nVs. In turn, the duration of events of this class reaches 3000 µs. The power
of the signals associated with fibre breakage and component destruction is even up to
1000 nVs and their duration is 5000 µs.Materials 2021,
Materials 14, 14,
2021, x FOR
5076PEER REVIEW 12 of 32 13 of 34
Figure 8. Graphs of acoustic emission signals for an exemplary sample of A series: (a) signal strength
7
Figure 8. Graphs of acoustic emission signals for an exemplary sample of A7 series: (a) signal
over time; (b) distribution of the duration of the signals over time with the force increment curve.
strength over time; (b) distribution of the duration of the signals over time with the force increment
curve.
3.1.8. Signal Analysis for Research Case A8
For the sample from the A8 (Figure 9) test case, signals of all four classes were observed
3.1.8.
fromSignal Analysis
the start of each for Research
recorded Case A8The signals corresponding to the initiation
waveform.
of microcracks appearfrom
For the sample fromthe
the Astart of the test
8 (Figure until
9) test theysignals
case, reach 400of s;alltheir
fourpower is up
classes were ob-
to 50 nVs and their duration up to 130 µs. The signals linked to crack development
served from the start of each recorded waveform. The signals corresponding to the initia- and
spread
tion are recorded throughout
of microcracks appear from thethe
measurement
start of theand
testareuntil
characterised
they reach by400
a power of up
s; their power is
to 600 nVs and a duration of up to 2000 µs. Events corresponding to material delamination
up to 50 nVs and their duration up to 130 µs. The signals linked to crack development and
and fibre detachment were also recorded from the start of the test, but their intensity
spread are recorded throughout the measurement and are characterised by a power of up
increases after 800 s. The strength of the signals associated with the indicated processes
toreaches
600 nVs and
600 nVs.a duration of duration
In turn, the up to 2000 of µs. Events
events corresponding
of this to material
class reaches 2500 µs. The delamination
power
and fibre
of the detachment
signals associatedwere
withalso
fibrerecorded
breakagefrom the start of destruction
and component the test, but is their
even intensity
up to in-
creases
1000 nVsafter
and 800
theirs.duration
The strength
is 3000 µs.of the signals associated with the indicated processes
reaches 600 nVs. In turn, the duration of events of this class reaches 2500 µs. The power
of the signals associated with fibre breakage and component destruction is even up to
1000 nVs and their duration is 3000 µs.Materials2021,
Materials 14,x5076
2021,14, FOR PEER REVIEW 1413ofof34
32
Figure 9.
Figure Graphs of
9. Graphs ofacoustic
acousticemission signals
emission for for
signals an exemplary sample
an exemplary of A8 series:
sample (a) signal
of A8 series: (a)strength
signal
over time; (b) distribution of the duration of the signals over time with the force increment curve.
strength over time; (b) distribution of the duration of the signals over time with the force increment
curve.
3.1.9. Signal Analysis for Research Case A9
3.1.9. For theAnalysis
Signal sample for
from the A9 Case
Research (Figure
A9 10) test case, signals of all four classes were
observed from the start of each recorded waveform. The signals corresponding to the
For the sample from the A9 (Figure 10) test case, signals of all four classes were ob-
initiation of microcracks appear from the start of the test until they reach 500 s; their power
served from the start of each recorded waveform. The signals corresponding to the initia-
is up to 60 nVs and their duration up to 250 µs. The signals linked to crack development
tion of microcracks appear from the start of the test until they reach 500 s; their power is
and spread are recorded throughout the measurement and are characterised by a power
up to 60 nVs and their duration up to 250 µs. The signals linked to crack development and
of up to 700 nVs and a duration of up to 2500 µs. Events corresponding to material
spread are recorded throughout the measurement and are characterised by a power of up
delamination and fibre detachment were also recorded from the start of the test, but their
to 700 nVs and a duration of up to 2500 µs. Events corresponding to material delamination
intensity increases at around 800 s. The strength of the signals associated with the indicated
and fibre detachment were also recorded from the start of the test, but their intensity in-
processes reaches 700 nVs. In turn, the duration of events of this class reaches 3000 µs. The
creases at around 800 s. The strength of the signals associated with the indicated processes
power of the signals associated with fibre breakage and component destruction reaches up
reaches 700 and
to 800 nVs nVs.their
In turn, the duration
duration of events of this class reaches 3000 µs. The power
is 4000 µs.
of the signals associated with fibre breakage and component destruction reaches up to 800
nVs and their duration is 4000 µs.Materials
Materials2021,
2021,14,
14,x5076
FOR PEER REVIEW 1514ofof34
32
Figure
Figure 10.
10. Graphs
Graphsofofacoustic
acousticemission
emissionsignals
signalsfor
for an
an exemplary
exemplary sample
sample of
of A
A99 series:
series: (a)
(a) signal
signal
strength
strengthover
overtime;
time;(b)(b)
distribution of of
distribution thethe
duration of the
duration signals
of the overover
signals timetime
withwith
the force increment
the force incre-
curve.
ment curve.
3.1.10.Signal
3.1.10. SignalAnalysis
Analysisfor forResearch
ResearchCaseCaseAA1010
Forthe
For thesample
samplefromfromthe theAA (Figure
(Figure
10 10 11)11)
testtest case,
case, signals
signals of 1of
and1 and 2 classes
2 classes werewereob-
observed
served fromfromthethe start
start of of each
each recorded
recorded waveform.Class
waveform. Class3 3and
and4 4signals
signalsare
areintensified
intensifiedat at
around 400 s. Signals corresponding to the initiation of microcracks occur up to about 400s;
around 400 s. Signals corresponding to the initiation of microcracks occur up to about 400
s;their
theirpower
powerisisup uptoto5050nVs
nVsandandtheir
theirduration
duration up up to
to 250
250 µs. The signals
µs. The signals linked
linked toto crack
crack
development and spread are recorded throughout the measurement
development and spread are recorded throughout the measurement and are characterised and are characterised
byaa power
by power of of up
up to
to 500
500 nVs
nVs and
and aa duration
duration of of up
up to
to 2500
2500 µs. The intensity
µs. The intensity ofof events
events
corresponding to material delamination and fibre detachment
corresponding to material delamination and fibre detachment increases after 400 s. increases after 400 s. The
The
strength of
strength of the
the signals
signals associated
associatedwith
withthetheindicated
indicatedprocesses
processes reaches
reaches200200
nVs. In turn,
nVs. In turn,the
duration of events of this class is 1300 µs. The power of the signals
the duration of events of this class is 1300 µs. The power of the signals associated withassociated with fibre
breakage
fibre and component
breakage and component destruction is upistoup
destruction 300tonVs
300and
nVstheir duration
and their is up is
duration 1500
up µs.
1500
µs.Materials 2021, 14, x5076
FOR PEER REVIEW 1615of
of 34
32
Figure 11.
Figure Graphs of
11. Graphs of acoustic
acoustic emission
emission signals
signals for
for an
an exemplary
exemplary sample
sample of
of A
A10 series: (a) signal
10 series: (a) signal
strength over time; (b) distribution of the duration of the signals over time with the force
strength over time; (b) distribution of the duration of the signals over time with the force incre-
increment
ment
curve.curve.
3.1.11. Signal Analysis for Research Case A
3.1.11. Signal Analysis for Research Case A1111
For the sample from the A (Figure 12) test case, signals of 1 and 2 classes were
For the sample from the A1111 (Figure 12) test case, signals of 1 and 2 classes were ob-
observed for the majority of each of the recorded waveforms. Single class 3 and 4 signals
served for the majority of each of the recorded waveforms. Single class 3 and 4 signals
start to appear around 400 s and are emitted when the sample is destroyed. Few signals
start to appear around 400 s and are emitted when the sample is destroyed. Few signals
corresponding to the initiation of microcracks appear from the start of the test until they
corresponding to the initiation of microcracks appear from the start of the test until they
reach 200 s; their power is up to 170 nVs and their duration up to 250 µs. The signals
reach 200 s; their power is up to 170 nVs and their duration up to 250 µs. The signals linked
linked to crack development and spread are recorded throughout the measurement and
to crack development and spread are recorded throughout the measurement and are char-
are characterised by a power of up to 600 nVs and a duration of even up to 2500 µs. Events
acterised by a power
corresponding of up delamination
to material to 600 nVs andand
a duration of even upare
fibre detachment to characterised
2500 µs. Eventsbycorre-
up to
sponding to material delamination and fibre detachment are characterised by up
600 nVs and have a duration of 1500 µs. The power of the signals linked with fibre breakageto 600
nVs
and and have a duration
component of 1500
destruction µs. 600
reaches ThenVs
power
andof the duration
their signals linked
is 1700with
µs. fibre breakage
and component destruction reaches 600 nVs and their duration is 1700 µs.Materials 2021, 14, x5076
FOR PEER REVIEW 1716of
of 34
32
Graphs of
Figure 12. Graphs
Figure of acoustic
acoustic emission
emission signals
signals for an exemplary sample of A 11 series: (a) signal
A11
strength
strength over
overtime;
time;(b)
(b)distribution ofof
distribution thethe
duration of the
duration signals
of the overover
signals timetime
withwith
the force increment
the force incre-
curve.
ment curve.
3.1.12. Signal
3.1.12. Signal Analysis
Analysis for for Research
Research CaseCase A A1212
For the
For the sample
samplefrom fromthe theAA (Figure
(Figure
1212 13)13)testtest case,
case, signals
signals of 1ofand
1 and 2 classes
2 classes werewere
ob-
observed for the majority of each of the recorded waveforms. Single
served for the majority of each of the recorded waveforms. Single 3 and 4 class signals 3 and 4 class signals
are
are emitted
emitted afterafter
100 s.100Fews. Few signals
signals corresponding
corresponding to thetoinitiation
the initiation of microcracks
of microcracks appearappear
from
from
the theofstart
start of the
the test testthey
until until they200
reach reach 200 power
s; their s; theirispower is up
up to 250 nVsto and
250 their
nVs and their
duration
duration up to 300 µs. The signals linked to crack development and
up to 300 µs. The signals linked to crack development and spread are recorded throughout spread are recorded
throughout
the measurementthe measurement and are characterised
and are characterised by a power of byupa power
to 600 of
nVsupand
to 600 nVs andofa
a duration
duration of even up to 2500 µs. Events corresponding to material
even up to 2500 µs. Events corresponding to material delamination and fibre detachment delamination and fibre
detachment are characterised by up to 250 nVs and have a duration
are characterised by up to 250 nVs and have a duration of 1300 µs. The power of the of 1300 µs. The power
sig-
nals linked with fibre breakage and component destruction reaches 250 nVs and their and
of the signals linked with fibre breakage and component destruction reaches 250 nVs du-
their duration is 1300 µs.
ration is 1300 µs.Materials 2021,
Materials 14,14,
2021, x FOR
5076 PEER REVIEW 17 of 32 18 of 34
13. Graphs
Figure 13.
Figure Graphsofofacoustic emission
acoustic signals
emission for an
signals forexemplary samplesample
an exemplary of A12 series:
of A12 (a) signal
series: (a) signal
strength over time; (b) distribution of the duration of the signals over time with the force
strength over time; (b) distribution of the duration of the signals over time with the force incre-
increment
ment curve.
curve.
3.1.13. Signal Analysis for Research Case A13
3.1.13. Signal Analysis for Research Case A13
For the sample from the A13 (Figure 14) test case, signals of class 2 were observed for
For the of
the majority sample from theobserved.
the waveform A13 (Figure
The14) test case,
number signals
of class 1 andof class 2 iswere
3 signals observed
small. No for
the majority
class 4 signalsof therecorded.
were waveform Theobserved.
few signalsThe number oftoclass
corresponding 1 and 3ofsignals
the initiation is small. No
microcracks
are characterised
class by a power
4 signals were of 20 nVs
recorded. The and
fewa signals
durationcorresponding
of up to 120 µs. The signals
to the linked of mi-
initiation
to crack development
crocracks and spread
are characterised are recorded
by a power throughout
of 20 nVs the measurement
and a duration andµs.
of up to 120 areThe sig-
characterised by a power of up to 550 nVs and a duration of even up to 2500
nals linked to crack development and spread are recorded throughout the measurement µs. Events
corresponding to material delamination and fibre detachment are characterised by up to
and are characterised by a power of up to 550 nVs and a duration of even up to 2500 µs.
100 nVs and have a duration of 700 µs.
Events corresponding to material delamination and fibre detachment are characterised by
up to 100 nVs and have a duration of 700 µs.Materials 2021,
Materials 14, 14,
2021, x FOR
5076 PEER REVIEW 18 of 32 19 of 34
Figure
Figure 14. Graphs
Graphs ofofacoustic
acousticemission
emission signals
signals forexemplary
for an an exemplarysamplesample
of A13 of A13 (a)
series: series: (a) signal
signal
strength
strength over
over time;
time; (b) distribution ofthe
distribution of theduration
durationofofthe
thesignals
signals over
over time
time with
with thethe force
force increment
incre-
curve.
ment curve.
3.1.14. Signal Analysis for Research Case A
3.1.14. Signal Analysis for Research Case14A14
For the sample from the A14 (Figure 15) test case, signals of class 2 were observed
Formajority
for the the sample from
of the the A14observed.
waveform (Figure 15) test case,
Single class 3signals
signalsof classto2 appear
begin were observed
after for
the
200majority of the of
s. The presence waveform
class 1 and observed. Single
4 signals was notclass 3 signals
recorded. begin to
The signals appear
linked after 200 s.
to crack
The presence and
development of class
spread1 and 4 signalsthroughout
are recorded was not recorded. The signals
the measurement linked
and are to crack devel-
characterised
opment andofspread
by a power arenVs
up to 600 recorded throughout
and a duration the
of even upmeasurement andcorresponding
to 2500 µs. Events are characterised
to by a
material
power ofdelamination
up to 600 nVs and and
fibre adetachment
duration ofareeven
characterised
up to 2500by up to Events
µs. 350 nVs corresponding
and have a to
duration of up to 1000 µs.
material delamination and fibre detachment are characterised by up to 350 nVs and have
a duration of up to 1000 µs.Materials 2021,
Materials 14,14,
2021, x FOR
5076 PEER REVIEW 19 of 32 20 of 34
15. Graphs
Figure 15.
Figure Graphsofofacoustic emission
acoustic signals
emission for an
signals forexemplary samplesample
an exemplary of A14 series:
of A14(a) signal(a) signal
series:
strength over time; (b) distribution of the duration of the signals over time with the force
strength over time; (b) distribution of the duration of the signals over time with the force incre-
increment
ment curve.
curve.
3.1.15. Summary of Signal Analysis
3.1.15. Summary of Signal Analysis
Analysing Figures 2–15, it can be seen that for samples in the air-dry state and exposed
Analysing Figures
to environmental 2–115,
factors (A –A9it) there
can be areseen thatoffor
signals allsamples
classes fromin the
theair-dry
beginning state
of and ex-
posed to environmental
the external load action. Shortly (A1–applying
factorsafter A9) therethe are signals
force, classof3 all classes
signals from
begin the beginning
to appear,
indicating
of that load
the external the structural delimination
action. Shortly and fibre the
after applying detachment
force, classfrom the matrix
3 signals begin have
to appear,
begun. As the cracks in the tensile zone progresses and the crack deepens,
indicating that the structural delimination and fibre detachment from the matrix have be- class 4 signals
for gradual fibre breakage and material deterioration start to appear at the bottom of
gun. As the cracks in the tensile zone progresses and the crack deepens, class 4 signals for
the sample. Exceeding the stress limits in the material results in a rapid increase in the
gradual fibre breakage and material deterioration start to appear at the bottom of the sam-
recorded descriptors.
ple. Exceeding
For the samplesthe stress
exposed limits in the
to direct fire material
(A10 –A13 ) results
and highintemperature
a rapid increase in flame
(A14 ), the the recorded
descriptors.
interaction did not affect the nature of the signals recorded for the samples torched for
For(A
2.5 min the
10 ),samples
while theexposed to direct
prevailing class 2fire (A10–were
signals A13) and high temperature
observed (A14), the flame
in the other recorded
interaction
time courses.did notauthor
The affectlinked
the nature of the
this fact signals
to the recorded
potential for theorsamples
for damage degradationtorched
of for 2.5
the reinforcing fibres when exposed to fire and temperature, which
min (A10), while the prevailing class 2 signals were observed in the other recorded implied a change in time
courses. The author linked this fact to the potential for damage or degradation of the re-
inforcing fibres when exposed to fire and temperature, which implied a change in the
deterioration of the components. It was found that dry samples and samples exposed to
environmental conditions, due to the presence of reinforcing fibres, were destroyed byexposed to temperature fluctuations, caused by probable fibre degradation, was caused
Materials 2021, 14, 5076 by exceeding the shear strength. The analysis of the characteristics of the recorded 20 of 32 de-
scriptors also revealed that, during the bending of the torched and burned samples, the
occurrence of most AE events was associated with the emission of signals with lower
power (below 600 nVs)
the deterioration of thethan those of Itthe
components. wasother
foundgroups.
that dry samples and samples exposed
toAnalysing
environmental the conditions,
classes of due
AE to
signals present
the presence of in the analysed
reinforcing fibres, waveforms of A
were destroyed by11–A14
samples, it was
exceeding found
tensile that the
stresses. Onabsence
the otherofhand,
classthe
1 signals in the process
deterioration initial phase
of the of testing in-
samples
exposed
dicates the to temperature
potential fluctuations,
presence caused
of locally by probable
weakened fibre degradation,
structure was caused
of cement-fibre panels.by The
exceeding the shear strength. The analysis of the characteristics of the recorded
absence of the class 3 and 4 signals in the recorded events clearly indicates damage to the descriptors
also revealed
reinforcing that,
fibres or during the bending
the potential of the torched
delamination andandvoidsburned samples,
in the materialthestructure.
occurrence
of most AE events was associated with the emission of signals with lower power (below
600 nVs) than those of the other groups.
3.2. Statistical Analysis of the Obtained Results
Analysing the classes of AE signals present in the analysed waveforms of A11 –A14
Duringitstatistical
samples, was found analysis
that theofabsence
received of results, for all in
class 1 signals samples, first,
the initial all data
phase were pre-
of testing
tested in order
indicates to selectpresence
the potential the appropriate
of locally test groups
weakened to examine
structure the data. panels.
of cement-fibre The groups
The ex-
absence of the class 3 and 4 signals in the recorded events clearly indicates
amined are approximately equinumerous. Therefore, standard distributions of data damage to thein in-
reinforcing
dividual groupsfibres or the
were potentialwith
examined delamination and voids test.
the Shapiro–Wilk in theFor
material
most structure.
data, no grounds to
reject
3.2.the hypothesis
Statistical of of
Analysis standard distribution
the Obtained Results were found. The Levene test was then per-
formed to examine the homogeneity of variance.
During statistical analysis of received results, for all samples, first, all data were
In most groups
pre-tested in order there is no
to select thehomogeneous
appropriate testvariance.
groups toTherefore, in data.
examine the orderThe
to examine
groups the
distributions, it was decided to use the non-parametric test for Kruskal–Wallis
examined are approximately equinumerous. Therefore, standard distributions of data independ-
in
entindividual
variables.groups were examined with the Shapiro–Wilk test. For most data, no grounds
toThe below
reject charts provide
the hypothesis graphical
of standard results were
distribution of thefound.
Kruskal–Wallis
The Levenetest.
test was then
performed to examine the homogeneity of variance.
In most groups Test
3.2.1. Kruskal-Wallis thereResults
is no homogeneous variance.
for Independent Therefore,
Samples in order
of the to examine
Number the1
of Class
distributions,
Signals it was decided to use the non-parametric test for Kruskal–Wallis independent
variables.
Analysing the
The below graphical
charts providerepresentation
graphical resultsofofthe
the Kruskal–Wallis test results for inde-
Kruskal–Wallis test.
pendent samples of the number of class 1 signals (Figure 16), it can be observed that the
3.2.1. Kruskal-Wallis
maximum number of Test Results
signals for Independent
of this Samples of
class was recorded forthe Number
panels fromof the A6 test case
Class 1 Signals
(frozen-thawed samples for 10 cycles). For this case there was also the largest scatter of
results. Analysing thecases
The A8 test graphical representation
(frozen-thawed of the for
samples Kruskal–Wallis testA
50 cycles) and results for inde-
9 (torched samples
pendent samples of the number of class 1 signals (Figure 16), it can be observed that the
for 100 cycles) contain single statistical outliers. The lowest values of the class 1 signal
maximum number of signals of this class was recorded for panels from the A6 test case
number were recorded for the A13 test cases (torched samples for 10 min) and A14 (burned
(frozen-thawed samples for 10 cycles). For this case there was also the largest scatter of
samples).
results. The A test cases (frozen-thawed samples for 50 cycles) and A (torched samples for
8 9
100 cycles) contain single statistical outliers. The lowest values of the class 1 signal number
were recorded for the A13 test cases (torched samples for 10 min) and A14 (burned samples).
Figure 16. The graphical representation of the Kruskal–Wallis test results for independent samples of
the number of class 1 signals.
Figure 16. The graphical representation of the Kruskal–Wallis test results for independent samples
of the number of class 1 signals.You can also read