Developing a smart trap prototype equipped with camera for tortricid pests remote monitoring
←
→
Page content transcription
If your browser does not render page correctly, please read the page content below
Bulletin of Insectology 74 (1): 147-160, 2021
 ISSN 1721-8861 eISSN 2283-0332

 Developing a smart trap prototype
 equipped with camera for tortricid pests remote monitoring
Michele PRETI1,2, Christian MORETTI2, Gabriele SCARTON3, Giovanni GIANNOTTA3, Sergio ANGELI1
1
 Faculty of Science and Technology, Free University of Bozen-Bolzano, Italy
2
 ASTRA Innovazione e Sviluppo Test Facility, Faenza, Italy
3
 FOS S.p.A., Bolzano, Italy

Abstract

The effectiveness of insect pest management programs depends on the availability of reliable and updated information about the
pest infestation status. Action thresholds derived by captures in monitoring traps are a pillar of modern integrated pest management
programs to trigger and optimize the timing and usage of insecticide sprays. However, weekly trap inspections in field may lead to
a delayed intervention and imply a certain labour cost. Such issues have led to some early adoption of automatic trap-based moni-
toring exploiting new technology. This work aimed to develop an innovative ‘smart’ trap prototype capable to monitor by remot e
insect pests, selecting codling moth, Cydia pomonella (L.), in pome fruit crops as case study. Smart trap components (hardware)
were chosen considering the environmental sustainability and an economic evaluation of the trap prototype cost is provided together
with the cost-benefit analysis of the remote pest monitoring. A detection algorithm (software) to automatically identify and count
codling moth was developed by using open-source programs. The smart trap prototype was evaluated in field experiments. Quali-
tative parameters related to automatic pest identification such as accuracy, sensitivity and precision were calculated according to
both false positive and false negative counts. This work describes the different steps necessary to develop smart traps for insect
pests monitoring, showing the preliminary field results obtained with the proposed prototype. The smart trap efficiency in capturing
codling moth was similar to a standard monitoring trap and the pictures provided a sufficient resolution to manually validate moth
captures observing the images by remote. Nevertheless, the detection algorithm failed to automatically provide a trustworthy capture
count data by remote because, using deep learning technique, thousands of pictures are usually required for the algorithm training
towards the target species in order to reach a sufficient level of reliability. This work provides the basis for a further wider devel-
opment of such smart trap prototypes worldwide.

Key words: Cydia pomonella, codling moth, electronic trap, automatic trap, automatic pest detection.

Introduction properly and timely counteract the infestations, and usu-
 ally trap counts are used both to determine the need to
Among the insect species causing economic losses in spray and to optimize spray timings. In orchards not
pome fruit crops, codling moth Cydia pomonella (L.) treated with MD, the codlemone is usually applied alone
(Lepidoptera Tortricidae) is one of the major key pests. to track the males population and indirectly females and
In fact, if not properly managed with complementary and offspring information are calculated, exploiting phenol-
integrate practices including chemical, mechanical and ogy models (Jones et al., 2013). Nowadays a wide
(micro)biological control, together with population sup- knowledge has been achieved regarding codlemone usage
pression techniques such as mating disruption (MD) or for monitoring. For instance, recent studies evaluated the
sterile insect, codling moth infestations can severely im- behaviourally effective plume reach of a standard sex
pact pome fruit productions (Knight et al., 2019a; Kadoić pheromone-baited trap (< 5 m), the trapping area of a sin-
Balaško et al., 2020). According to its biological require- gle trap (ca. 21 ha) and provided data to convert relative
ments and to the climatic and environmental parameters pest captures into absolute pest densities (1 adult trap−1
reported in different geographical areas, it has been corresponds approximately to 5 adults ha−1) (Adam et al.,
demonstrated that all the continents (with the exception 2017). On the other hand, in orchards treated with the sex
of Antarctica) are suitable for codling moth development pheromone to perform MD, for monitoring purposes the
and its actual distribution covers the main pome fruit codlemone is usually combined with other attractive vol-
crops productive areas worldwide (Jiang et al., 2018). atile organic compounds acting as kairomones, to over-
The severity and global importance of this tortricid spe- come the MD interference. The major compound practi-
cies have driven uncountable research studies on its man- cally applied since its discovery is the pear-derived kair-
agement, with a turning point 50 years ago thanks to the omone (E,Z)-2,4-ethyl decadienoate (commonly known
identification of the major component of female codling as pear ester) (Light et al., 2001). Pear ester attracts both
moth sex pheromone, (E,E)-8,10-dodecadien-1-ol (com- codling moth sexes and the microbial volatile acetic acid
monly known as codlemone) (Roelofs et al., 1971). Now- proved to be a potent synergistic for moth attraction in
adays codlemone is largely utilized in orchards to: (i) rec- several studies (Knight et al., 2018). Therefore, to date
ord the male flight activity through monitoring trap cap- there are effective options to monitor this target pest, con-
tures; (ii) disrupt the adult behaviours by interfering with sidering both sexes and regardless the application of MD.
the frequency and timing of mating through the use of Nevertheless, a limit of the traditional insect pest mon-
MD (Witzgall et al., 2008; 2010). itoring is due to the low spatial and temporal resolution
 A reliable codling moth monitoring is essential to that is usually achieved with standard monitoring traps.
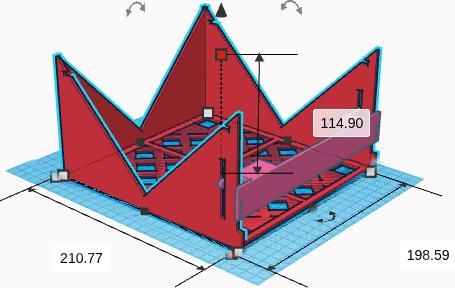
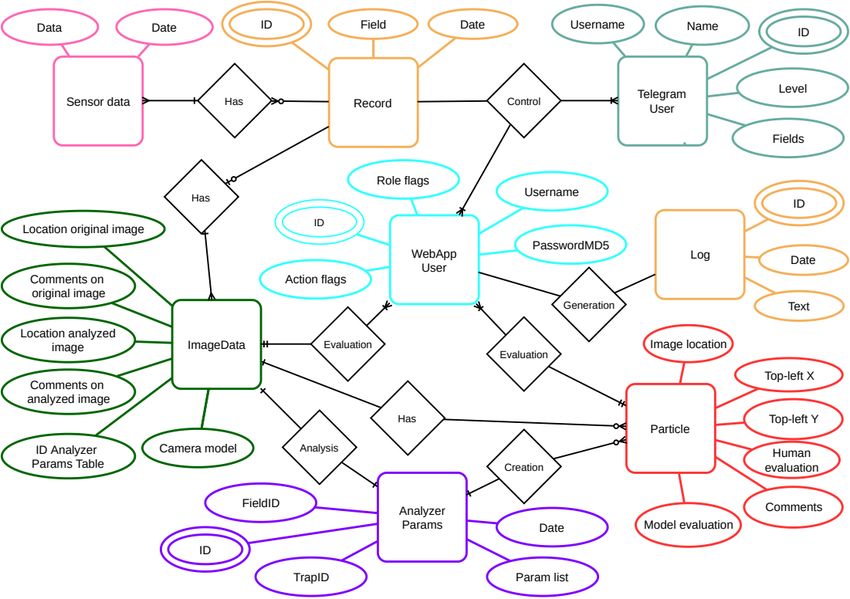
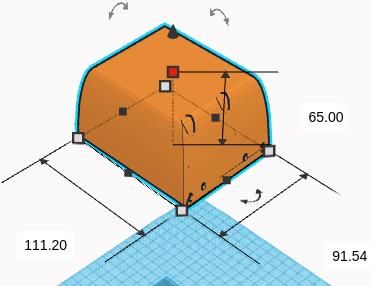
Due to labour cost issues and required field visits to check crops as ‘case study’. Assembling materials and elec-
insect pest captures, traps are usually deployed in acces- tronic components have been selected considering the en-
sible locations and in limited numbers. Thanks to the ad- vironmental sustainability and reporting the relevant eco-
vent of new technologies (including remote sensing, elec- nomic cost evaluations. A brand-new detection algorithm
tronics and informatics), the panorama of tools available for captures identification and count has been developed
has largely improved offering a variety of systems to au- and qualitative identification parameters such as accu-
tomatically detect and monitor insect pests (Cardim Fer- racy, precision and sensitivity have been considered for
reira Lima et al., 2020). Among such tools, a recent re- this smart trap prototype.
view by Preti et al. (2021a) extensively discusses the use
of camera-equipped traps for insect pest monitoring.
Smart traps that take pictures and exploit images to pro- Materials and methods
vide count data can be classified according to the level of
trap automatization in semi-automated or fully automated Construction of the smart trap prototype
systems, as described in Sciarretta and Calabrese (2019). The smart trap prototype developed was composed of a
Semi-automated traps require a manual count of the cap- hardware part, including the trap chassis, the power sup-
tures by human operator in remote, as reported in Guar- ply system, the sensors including the camera and any re-
nieri et al. (2011) for codling moth and in Ünlü et al. lated electronics (figure 1), and by a software to service
(2019) for European grapevine moth, Lobesia botrana the remote monitoring, including the image transmission,
(Denis et Schiffermuller). Automated traps can rely on the image analyser and the operator interfaces (figure 2).
detection algorithm capable of automatically identify and The chassis structure was composed of three major
count the captured insects by means of image processing parts: (i) the upper cap, which contained all electric and
analyses, as reported by Lucchi et al. (2018) for Euro- electronic parts; (ii) the brim, which was designed to of-
pean grapevine moth, by Doitsidis et al. (2017) for olive fer coverage and protection for the sticky liner and the
fruit fly, Bactrocera oleae (Rossi), and by Shaked et al. lure towards the atmospheric events; and (iii) the base,
(2018) for other fruit flies species. To date, these devices which included four columns and a removable bulkhead
are increasing in interest since they allow improving both used to place the sticky liner on the base (figure 3). The
spatial and temporal resolution in insect pest monitoring, upper cap box (111.2 mm of length × 91.5 mm of width
creating the condition for a digital implementation of the × 65.0 mm of height) was compact, resistant and water-
management programs within the Internet of Things and proof. The trap brim had a pyramid trunk shape and pre-
the Big Data framework (Preti et al., 2021a). sented holes for placing the anchoring systems to the
 This work aimed to develop an innovative smart trap plant and to the trap base. The base was rectangular-
prototype equipped with a camera to perform a remote shaped (210.8 mm × 198.6 mm) and had holes to drain the
pest monitoring, selecting codling moth in pome fruit water that may enter due to rain events. The trap chassis

Figure 1. Schematic diagram of the smart trap prototype main components: the trap chassis, the power supply system
 and the electronics and sensors, including the camera for picture acquisition, represent the hardware part of the trap.

148
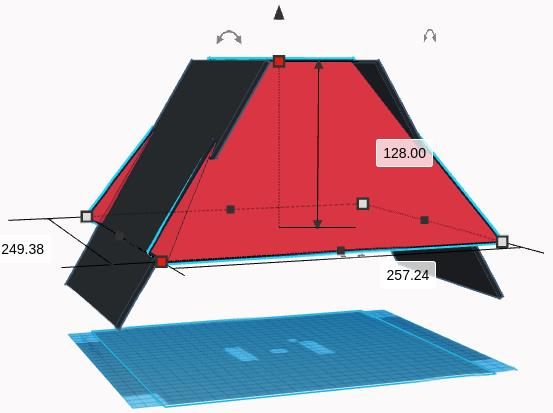
Figure 2. Schematic diagram of the software to service by remote the smart trap prototype: images transmission sys-
 tem, image analyser and operator interface.

 A B

 C D

Figure 3. Smart trap prototype design showing the chassis structure (measures in mm). A = trap brim (solar panels in
 black); B = trap base with the removable bulkhead to insert the sticky liner; C = upper cap containing the electronic
 box and the camera; D = trap prototype assembled.

construction material was polylactic acid (PLA), a poly- 653 g of PLA filament were used. A red PLA filament
ester bioplastic produced from renewable resources and was selected since this colour does not impact negatively
biodegradable (Su et al., 2019; Siakeng et al., 2019). Pol- the codling moth captures and has no or little effect on
ylactic acid has a better ecological impact than other the chromotropic attraction of beneficials and other non-
printable materials by using Fused Deposition Modeling targets (Clare et al., 2000; Knight and Miliczky, 2003;
(FDM) method (Faludi et al., 2015). A professional FDM Barros-Prada et al., 2013).
3D printer Ultimaker S5 was used to produce the trap The core of the electronic system was the ultra-low
structure using the PLA filament. Per each trap device, power EXPRESSIF microcontroller ESP 32, which

 149
managed all the peripherals and the power system. This one) and need 8 V of charging voltage. The solar power
microcontroller was a hybrid Wi-Fi & Bluetooth pro- was regulated by two monolithic integrated circuits
grammable chip with high level of integration; it man- LM2596 as step-down switching regulators (one per each
aged and provided a communication stack to the periph- voltage output). Since the battery temperature can increase
erals through its SPI/SDIO or I2C/UART interfaces; it due to external factors, such as the direct sun light over-
was based on Xtensa 32-bit LX6 microprocessor and the heat, or by charging cycle, the charging process was con-
model used had just one core to maximize the low energy trolled by a battery management system (BMS). The BMS
consumption. One of the relevant characteristics in the circuit helped the battery life as well. The two photovoltaic
electronic system is the ultra-low power co-processor, panels were installed directly on the trap brim (figure 3).
which allowed the Analogic and Digital signal Conver- A GSM SIM card was used for sending data to the server
sions (ADC), the computation and to manage the level by using GPRS connection. Pictures were univocally iden-
thresholds during the deep sleep mode; it was equipped tified by a title reporting relevant information: each file
by 448 MB of Read Only Memory (ROM) and 520 MB was associated with a string reporting the monitoring field
of Static Random Access Memory (SRAM). The activa- location and trap identification, and the day and time of
tion timing was managed by a Real-Time Clock (RTC) picture acquisition. The electronic system was set to go in
and needed 0.01 mA s−1 of current in deep sleep mode. deep sleep mode for 5 minutes when the picture transmis-
The connected photo camera was an Omnivision sion system failed to send images for three consecutive
OV5648 with a resolution of 5 Mpixel (retrieving up to times, and then it activates again to take another picture.
2592 pixel × 1944 pixels of resolution). The minimum This loop was set to be repeated twice and if picture send-
requirement of image sharpness for codling moth remote ing failure persisted due for instance to poor or unstable
identification was defined according to what reported in connection, the system was set to go in deep sleep mode
Guarnieri et al. (2011). In the present work, the requested until the next scheduled timing for picture acquisition.
focus distance of the camera from the trap base was 22 All acquired pictures were sent to the data server by us-
cm. The cone of vision covered an elliptic projection of ing Secure Shell (SSH), which is a cryptographic network
17 × 19 cm, overlapping completely the whole size of the protocol to secure the operating services on the network.
sticky liner (17 × 17 cm). In addition to the embedded In the data server, the pictures were stored in a protected
communication systems, a GSM module was connected image repository where the detection algorithm executed
by UART interface. The GSM component was the the image analysis process. At the end of the image anal-
SIMCom SIM800 chip. The electronic board needed to yses, all pictures information and analyses results were
be powered by 5 V of voltage and 300 mA of current, in stored permanently in the database (DB). The server appli-
full working status. cation was database centric (figure 4). Thus, the database
 Two photovoltaic modules (12 V, 2 W each) powered structure defined the subsystem working parameters and
the electronic components of the smart trap and in low so- behaviour. All software subsystems (trap, analyser,
lar energy conditions, the power was granted by two lith- webapp and Telegram bot) were dynamically driven by the
ium rechargeable graphene Panasonic NCR18650B batter- database structure, such as the storage of the capture data
ies, which were connected in series. These batteries can information (figure 5), and the analyser learning parame-
supply 3500 mA as maximum current at 7.2 V (3.6 V each ters. Human operator can visualize capture pictures in two

Figure 4. Data flow representation with the database as core part of the smart trap application architecture.

150
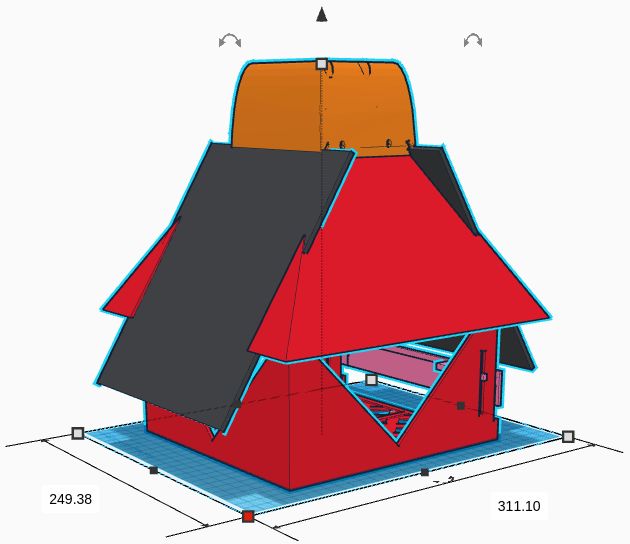
Figure 5. Data storage system of the smart trap prototype developed for codling moth remote monitoring.

forms: by using the Telegram bot in a smartphone and by Detection algorithm for automatic pest identification
using the webapp in a computer. The webapp used the and count
stored information to display images with a user-friendly Automatic pest detection is a complex process divided
interface to allow the manual picture evaluation by user. in two main parts: (i) a preliminary image analysis per-
 The software technologies used to develop the all server formed by an image analyser program; and (ii) a subse-
side components were based on both Java Development quent automatic pest classification performed by an arti-
Kit 1.8, which is the development environment for build- ficial intelligence algorithm.
ing applications, applets, and components using the Java The preliminary analyses of the images considered as
programming language, and Python as scripting program input the pictures of the insect captures originated di-
language (Java, 2020; Python, 2020). Java was used to de- rectly in field. After an image processing phase, the re-
velop the image analyser, webapp and Telegram bot soft- turn output was a list of regions of interest, one for each
ware, Python 2.7 for all scripts to manage the session and possible target pest (in this case codling moth) occurring
aggregation layers. The firmware on the trap was devel- within the picture. Since the original photo was required
oped by using C programming language. All data were to perform the human validation (checking for false neg-
stored in a MongoDB database system. MongoDB is a ative and false positive results) and because computation
document database that stores the data in JSON-like docu- and power resources on traps were limited, the analyses
ments (MongoDB, 2020). JSON (JavaScript Object Nota- run on the server duplicating the picture, in order to have
tion) is a lightweight data-interchange format. The webapp two adjacent and identical pictures: one unmodified and
was published on Internet by using Apache Tomcat® the other including the regions of interest marked by
(v8.5) web server. The Apache Tomcat® software is an squares. In this work the preliminary image analysis pro-
open source implementation of the Java Servlet, Ja- cess was based on ImageJ1, an open source image-pro-
vaServer Pages, Java Expression Language and Java Web- cessing program designed for scientific multidimensional
Socket technologies (Apache Tomcat, 2020). All software images, specifically integrated in the server to run as soon
were developed by using Eclipse platform, which is an ef- as a new image arrived on the server (Schneider et al.,
fective integrated development environment (desRivieres 2012; ImageJ, 2020). In order to reduce the effects of sun
and Wiegend, 2004). The Java project management and shadows and background interferences (in particular due
comprehension software tool Apache Maven (versions to the glue of the sticky liners), the MorphoLibJ plugin
2018 and 2019) was used as repository and build environ- was used for implementing a morphological filter (Mara-
ment for Java development (Apache Maven, 2020). gos, 2005; Legland et al., 2016). After the filtering, the

 151
images were analysed with ImageJ particles extractor to when new images validated by human operators will be
get the list of particles. The parameters of the extractor produced. At the time of this work, validated data were
were based on preliminary test images taken in different in the order of hundreds. To provide a stable model,
light conditions and on target pest morphological charac- which automatically learns from human validations with-
teristics provided by entomologist’s data, such as pest out overfitting, data in an order of thousand are required.
shape, minimum and maximum size and dominant col- Therefore, in this work the model was managed and mod-
our. These parameters depend not only on the type of pest ified directly by programmers due to the limited number
to be detected but also on trap configuration, in particular of samples.
the camera specification and the distance from the cam-
era to the sticky liner. When the regions of interest were Economic evaluations: trap prototype cost and cost-
found, a watershed tool based on circularity divided over- benefit analysis
lapping pests to get a particle per each individual recog- A trap cost estimation was calculated according to the
nized as target pest. In the webapp, the human operator actual expenses incurred to produce the smart trap proto-
could validate manually each particle automatically rec- type. The cost values, reported in euros, are referred to
ognized by the detection system within every single pic- the purchase of the various hardware components in Italy
ture derived by the smart trap. Per each particle of each and are updated to December 2020. Market value of such
picture, the user was asked to answer whether the marked technologies is subject to fluctuation according to avail-
item was or not the target pest, including possible com- ability and demand, and it can be different across years
ments. and locations. Only the actual costs to make the smart
 The output of this image analysis displayed on the web trap prototype as described in this work were considered,
interface for human validation was therefore used as in- without including the costs strictly related to a marketa-
put for the automatic pest classification. The labelled im- ble product. Specifically, hardware components such as
ages were used to create a Convolutional Neural Network the PLA material, the camera, the electronic components,
(CNN), which is a state of the art regarding artificial in- the power supply (batteries, solar panels and inverter),
telligence process for image classification (Taylor and and the SIM card were all included in the economic eval-
Nitschke, 2017; Ali et al., 2019). CNNs are inspired by uation, while other potential costs such as the fee to ac-
biological processes such as the neural connectivity and cess the web application and the data traffic consumption
they have the powerful feature to be independent from were not included. In fact, the latter aspects are not con-
prior knowledge, making them suitable for a large variety siderable during the prototypal phase and can be calcu-
of tasks. In this smart trap prototype, the development of lated only on a finished product ready to be put on the
the CNN model for pest classification is still in process, market. For the trap construction, a forfait labour cost of
since this kind of powerful artificial intelligence frame- 25.00 € was estimated for the components assemblage,
work requires many data to provide significant results. considering that this cost varies according to the number
For instance, for deep learning insect pest recognitions of devices produced simultaneously. In this study, it was
other authors report the usage of large scale datasets assumed that all the necessary hand tools needed for con-
with more than 75,000 images (Khalifa et al., 2020 and structing and assembling were freely available.
references therein). In order to maximize the use of data, Circumscribing the trap cost evaluation on the proto-
some data augmentation techniques were also used: start- type version reported in this study, a cost-benefit analysis
ing from a single image, eight different samples were cre- to monitor codling moth in pome fruit crops, in both ap-
ated using rotation and mirroring functions (Mikołajczyk ple and pear, by using either a conventional monitoring
and Grochowski, 2018). Tilted images, zoomed images trap or the smart trap prototype was also estimated. To
and cropped images were not used to preserve the pro- realize the cost-benefit analysis of the smart trap proto-
portion of the target pest. To implement this network and type, the following parameters were taken into account,
the data transformations, an open-source Java library, referring specifically to Italy.
DeepLearning4j, was used, providing the environment to Usually, in Italy, codling moth flights last from mid
create a CNN and providing mechanisms to augment the April until mid September and therefore it can be as-
data on the target pest. One of the features of DeepLearn- sumed that the duration of its monitoring should be 5
ing4j is that the data augmentation happens 'on the fly': months (from early April until the end of August) to
the different copies of the original classified image are cover the three flights in pear crop and 6 months (until
created during the model creation/update and are not the end of September) in apple crop. Therefore, a weekly
stored on disk. The classification model created by fol- trap check can imply 20 or 24 field visits in pear or apple
lowing this process was fixed and it was planned to up- crop, respectively. By using the smart trap, it was as-
date it manually with a new one tweaking the parameters sumed to perform a minimum of 4 field visits for servic-
as soon as new data validated by human operators were ing the traps: one for trap set up, two for lures and liners
classified and there was a significant change in the per- replacements and one at the end of the season. In addi-
formance. In this way, the improvements of the model tion, it was assumed not to have the sticky liners fre-
were controlled by programmers and not automatic, with quently saturated by captures or debris and realistically 2
the possibility to make changes among consecutive model supplementary field visits of the smart traps to replace
versions. As soon as the level of accuracy of the automatic sticky liners were also included, for an estimated total use
detection algorithm is considered sufficient and the version of five liners during the whole season. A distance of the
of the model is stable, the model parameters will be ad- monitoring site of 25 km from the office and a travelling
justed automatically by using Deeplearning4j functions costs of 0.40 € km−1 were considered, therefore each field

152
visit resulted to cost 20.00 €. In addition, the travel time experiments and liners were not replaced.
was estimated in 50 minutes roundtrip plus 10 minutes of To evaluate the smart trap prototype trapping effi-
trap check in situ, for a total of 1 hour of work. On the ciency, one trap comparison experiment was conducted
contrary, for the smart trap it was estimated to spend 10 in two pear orchards testing the automatic prototype and
minutes for the daily trap check in remote by using the a standard monitoring orange delta-shaped traps, Phero-
web interfaces and 6 checks per week were considered, con® VI (Trécé Inc.). In each location three pairs of traps
for a total of 1 hour of work per week. Using the remote (smart vs delta) were compared from July 21 until August
monitoring was considered to exploit the advantage of a 18 recording the total codling moth captures per trap.
more frequent trap check, increasing the time resolution To evaluate both the power autonomy and the detection
6-fold compared to the weekly trap check in situ and algorithm exactness, the same six smart trap prototypes
maintaining the same man-hour usage. The labour cost used for the trap comparison experiment were kept in the
was estimated in 10.00 € h−1 in all cases. Commercial field until September 14, for a total test duration of 55
standard monitoring traps, lures and liners costs were es- days (first monitoring period). A second experiment to
timated specifically for codlemone-baited traps as aver- evaluate trap operativity in field condition was then run
age purchase costs from two different retailers and con- from September 16 until October 19 (35 days of test du-
sidering three different suppliers. ration) in an apple orchard, with six replicates of the
 smart trap prototype (second monitoring period). Pictures
Field validation and data collection acquisition was set at two shoots per day, specifically at
 Preliminary checks of the smart trap operativity, in- 8:00 am and at 5:00 pm. Data on automatic counts (num-
cluding its resistance towards atmospheric events, the ber of particles provided automatically by the detection
power supply autonomy, the data acquisition and sending algorithm as codling moth counts), manual counts (real
efficiency by remote, and the visualization of pictures in number of codling moth captures provided by the human
the on-line repository have been tested outdoor over two operator observing the pictures and confirmed by the di-
consecutive seasons (2018 and 2019, data not shown) be- rect trap check in field), number of false positives (misi-
fore the final field validation performed in 2020 and re- dentifications of codling moth wrongly provided by the
ported in this work. Several prototype versions were re- detection algorithm) and number of false negatives
alized according to the need of improvements and adjust- (missed codling moth not recognized by the detection al-
ments to satisfy the requirements reported in Preti et al. gorithm) were recorded per each picture over the whole
(2021a). Therefore, the latest prototype version of the monitoring period. Other non-target insect species cap-
smart trap corresponded to the minimum qualitative con- tured, including for instance flies (Diptera Muscidae),
ditions defined prior to the trap development begin, spe- were also recorded both during picture validation and di-
cifically: (i) a compact, small-sized, robust and water- rect field observation of the sticky liners, and their impact
proof box containing all the electronics that work in au- on the false positive counts was evaluated. At the end of
tonomy and controlled by remote; (ii) a high resolution each monitoring period, flies size was also measured to
camera set at the proper distance from the sticky liner to categorize this non-target according to its body length.
obtain sharp pictures of the captures, with the target pest
clearly recognizable by remote; (iii) a sufficient power Capture data elaboration
supply to guarantee an operativity of the prototype for Exploiting the automatic count, manual count, and
more than 4 weeks; (iv) a data transmission system capa- number of false positive and false negative data per each
ble to automatically acquire, send, store and analyse pic- picture collected, the following parameters were calcu-
tures; and (v) a low environmental footprint, considering lated: (1) False positive (%); (2) False negative (%); (3)
low-cost recyclable assembling materials. Six identical Accuracy (%); (4) Sensitivity (%); and (5) Precision (%).
devices of such smart trap prototype version were there- The accuracy formula was adapted from Jiang et al.
fore produced for field evaluations. (2008 and 2013), while the sensitivity and precision for-
 Field experiments were conducted from July to October mulas were adapted from Wen et al. (2015) and Ding and
2020 in both pear and apple organic orchards located in Taylor (2016).
Emilia-Romagna Region (Italy) with known high infes-
tation levels of the target pest. Since the selected orchards (1) (%) =

 × 100

were treated with MD for codling moth, traps were baited
 (2) (%) = × 100
with pheromone-kairomone blends, using Pherocon®
CM‐DA Combo-P (Trécé Inc., Adair, OK, USA), a new (3) (%) =

 × 100
commercial binary lure comprised of a black PVC lure
loaded with codlemone and pear ester and a white mem- (4) (%) =

 × 100
brane cup loaded with acetic acid. This proprietary binary . + .

lure has been recently proved to enhance codling moth (5) (%) =

 × 100

captures in disrupted orchards due to its PVC formulation
in comparison to standard septa lure, both combined with Where the number of true positives is equal to the num-
an acetic acid membrane co-lure (Preti et al., 2021b). The ber of automatic counts minus the number of the false
lures were placed directly on the stick liner in all traps. positive counts.
Traps were installed at 3 m of height inside the crop can- Regarding the interpretation of the automatic detection
opy and were placed at minimum 25 m from the orchard algorithm parameters, the percentages of both false posi-
perimeter and apart. Traps were not rotated during field tive and false negative allow to evaluate the exactness of

 153
the system for the target pest automatic identification and from multcomp package).
count. The detection algorithm is more reliable when The effect of the flies captured on the number of parti-
both false positive and false negative percentages will be cles automatically detected was analysed by using a
close to zero. An accuracy equal to 100% means that the glmer with Poisson distribution. The number of true pos-
number of items marked and counted automatically by itive counts was added as controlling variable, while the
the recognition algorithm corresponded to the number of trap ID was included as random effect.
target pest individuals present in the sticky liner (to be Mean values are followed by Standard Error of the
noted that also in case of simultaneous presence of equal Mean (± SEM), unless otherwise specified.
numbers of false positive and false negative, the accuracy
would be 100%). An accuracy lower than 100% means
that there were target insects not recognized by the soft- Results
ware, therefore the automatic identification and count un-
derestimated the real pest occurrence. An accuracy The smart trap prototype developed in this study proved
higher than 100% means that there were non-target in- to be operative in field condition, with an external struc-
sects or other items counted as the target pest by the soft- ture robust and resistant to the atmospheric events. The
ware, therefore the automatic identification and count power autonomy varied among the tested devices, result-
overestimated the real pest occurrence (in this case, the ing in a variable number of pictures provided. In fact,
false positives impact the accuracy overrating the effec- some devices were still active sending pictures for a few
tive codling moth numbers). Both values of sensitivity days after the field experiments ceased, showing an op-
and precision can range between 0 and 100%. Values of eration lasting up to 8 consecutive weeks, while other de-
sensitivity close to 100% mean that the occurrence of vices interrupted the picture sending prior to the end of
false negative is very low and therefore all the target pest each experiment. The failure in sending pictures that oc-
individuals present are correctly detected by the auto- curred in some devices was likely due to connectivity is-
matic system (showing that the algorithm is sensible to- sues and in these cases the battery discharged rapidly, not
ward the target pest and it does not miss codling moths). allowing the remote validation of the captures for the
Values of precision close to 100% mean that the occur- whole monitoring period. During the first monitoring pe-
rence of false positive is very low and therefore the total riod (July-September), three out of six devices inter-
automatic detection corresponded to the correct codling rupted picture transmission after 5 days of operation or
moth detections (showing that the algorithm is precise less, and therefore were excluded from data analysis on
and it does not mark non-target insects or other items). the detection algorithm exactness due to the reduced sam-
 Regarding the non-targets, specifically for muscid flies, ples size. All six devices tested during this first monitor-
the percentage of flies counted as false positive was calcu- ing period were instead considered for capture data anal-
lated, together with the percentage of flies detected by the ysis since all traps captured codling moth. During the sec-
algorithm out of the total flies present in the sticky liners. ond monitoring period (September-October), all traps
 were operative for minimum 4 weeks.
Statistical analyses The smart traps trapping efficiency was comparable to
 Statistical analyses were performed with R software the one provided by standard monitoring delta-shaped
version 4.0.3 (R Core Team, 2020), including the pack- traps, with no significant effect of the trap design (df = 2,
ages lme4 (Bates et al., 2015) and multcomp (Hothorn et 9; F = 0.427; P = 0.665). Over the 4 weeks of field testing
al., 2008). AIC (Akaike's Information Criteria) parameter for trap design comparison, the smart traps captured on
and the residual distributions were considered to select average 17.7 ± 3.1 codling moth, while the standard delta
fitted models. In all the analyses, the level of significance traps captured 13.5 ± 3.4 codling moth.
was set at P = 0.05. The codling moth captures in the smart trap prototypes
 Captures data were found to fit normal distribution and were clearly recognizable by human operator due to the
therefore were analysed with a linear model (lm). In the high resolution of the camera (5 Mpixel) and the manual
trap comparison experiment, the two locations were con- check of the images allowed to describe the codling moth
sidered together since there was no significant effect of the capture trend by using the smart traps data, as exemplified
location on the moth captures (t value = 0.313; P = 0.761). in figure 6. However, the automatic counts provided by the
To highlight differences between the smart trap prototype detection algorithm did not match with the manual counts
and the standard monitoring delta-shaped trap in terms of provided by the human operator. Accuracy, precision and
trapping efficiency, an ANOVA test was performed. sensitivity of the detection algorithm under development
 To test differences among smart trap prototypes in are reported in table 1 for the two monitoring periods. All
terms of automatic pest detection, accuracy, sensitivity three parameters were significantly different (P < 0.001)
and precision data were analysed by using a generalized among traps in both monitoring periods. Accuracy was
linear mixed-effects model (glmer) from lme4 package, higher than 100%, overestimating 1.5-3-fold the real cap-
fitting a Poisson distribution. The trap ID was considered tures count. Sensitivity was inferior to 30%, showing that
as predictor, together with the number of real codling several codling moth captures were missed by the auto-
moth counts and the number of flies counted, both added matic pest detection system, while the low precision re-
as controlling variable. The number of real counts was flected the abundance of false positive misidentifications.
added as a model weight, while the trap ID was also in- During the first monitoring period, a total of 352 pic-
cluded as random effect. A multiple comparison post-hoc tures derived from three smart trap prototypes were
test was performed on the fitted model (glht function analysed. The average number of particles recognized

154
6
 A
 5
 Codling moth captured
 4

 3

 2

 1

 0
 20/7 27/7 3/8 10/8 17/8 24/8 31/8 7/9 14/9
 Day

 35

 30
 B
 Codling moth captured

 25

 20

 15

 10

 5

 0
 20/7 27/7 3/8 10/8 17/8 24/8 31/8 7/9 14/9
 Day
Figure 6. Codling moth captures reported as an example by one smart trap over the monitoring period July 21 - Sep-
 tember 14 in a pear organic orchard treated with mating disruption. A = new daily captures; B = cumulative captures.

Table 1. Exactness of the automatic detection algorithm at early stage development for codling moth. Accuracy, sen-
 sitivity and precision of the algorithm were calculated on a limited sample dataset (pictures number into brackets).
Monitoring period Mean values (± SEM)
(total number of analysed pictures) Accuracy (%) Sensitivity (%) Precision (%)
July-September a
 156.7 ± 6.2 28.1 ± 1.0 21.0 ± 0.7
(352)
September-October b
 302.2 ± 20.0 26.5 ± 2.8 9.4 ± 1.2
(332)
a
 Data resulting from three smart traps prototypes; b Data resulting from six smart trap prototypes.

Table 2. Major non-targets represented by flies (Diptera Muscidae) that impacted negatively the exactness of the
 automatic detection algorithm developed for codling moth.
 Mean values (± SEM)
Monitoring period Number of flies Flies counted False positive
 Number of flies
(total number of flies captured) counted out of the total represented by
 captured
 by the algorithm present (%) flies (%)
July-September a
 7.4 ± 0.3 4.2 ± 0.2 59.1 ± 1.7 30.6 ± 1.3
(38)
September-October b
 1.4 ± 0.1 0.8 ± 0.1 59.3 ± 2.8 33.7 ± 2.3
(34)
a
 Data resulting from three smart traps prototypes; b Data resulting from six smart trap prototypes.

 155
automatically by the detection algorithm was 17.0 ± 0.6, Table 3. Hardware components and labour costs to pro-
while the real codling moth counts were on average duce a smart trap prototype equipped with camera for
13.4 ± 0.5 per picture. The automatic counts included tortricid pests remote monitoring.
79.0% ± 0.7 of false positives, while the false negatives
were 72.2% ± 1.1. In the first period, over more than 6,000 Cost item Cost (€)
particles automatically marked and counted, about 4,600 Trap chassis a 50.00
particles were false positives. These misidentifications Controller board b 200.00
included a small portion (8.2%) of double counts, i.e., Power supply - 2 batteries 15.00
codling moth individuals counted twice due to wings ex- Power supply - 2 solar panels 30.00
panded. The rest of false positives were represented Power supply - 1 inverter 20.00
mainly by shadows in the sticky liners, in a few cases by Camera Omnivision OV5648 25.00
the lures, and by muscid flies. A total of 66 codling moth SIM card 10.00
individuals and 38 flies were caught in three smart Labour for construction c 25.00
traps during the first monitoring period. The non-tar- Total 375.00
 a
gets, measured to be classified according to their size, Trap chassis cost includes the plastic material used per
were mostly the same size of codling moth: 71.1% of one device (at 25.00 € kg−1 of PLA) and the 3D printing
captured flies had a body length comprised between 0.5 expenses; b The controller board includes all the elec-
and 1.0 cm, while 15.8% had a size smaller than 0.5 cm tronic components; c Forfait cost considering the com-
and 13.2% had a size comprised between 1.0 and 1.5 cm. ponents assemblage executed by a trained person.
On average, almost 60% of the flies captured in the smart
traps were misidentified as codling moth and flies repre-
sented about 30% of false positive counts (table 2). The economic evaluation of the smart trap prototype
 During the second monitoring period, a total of 332 pic- construction is reported in table 3, while the cost compar-
tures collected from 6 smart trap prototypes were analysed. ison of the classic monitoring with the remote monitoring
The detection algorithm automatically recognized on aver- is reported in table 4. The production of one smart trap
age 3.3 particles per picture, while there were on average prototype costed in total 375.00 €. When the smart trap is
0.9 ± 0.1 codling moth individuals per trap. False positive used in pear crop, monitoring codling moth for 5 months,
misidentifications accounted for 90.7% ± 1.2 of the auto- the overall remote monitoring cost estimated is 1.2-fold
matic counts, while the false negatives were 72.8% ± 2.9. higher compared to the classic monitoring in situ. When
In the second period, over about than 1,100 particles auto- the smart trap is used in apple crop, for a longer monitor-
matically marked and counted, about 1,000 particles were ing period (6 months), the cost of the remote monitoring
false positives. Similarly, to the first period, the majority of is 1.1-fold higher than the classic one. An even longer
misidentification were due to shadows and flies, while the monitoring period, increasing the number of field visits,
codling moths double counts were 2.4% of the false posi- can result in comparable costs. In both simulations, the
tive counts. In the second monitoring period, a total of 15 remote monitoring compared to the classic monitoring in
codling moth individuals and 34 flies were captured in the situ allows a 6-fold time resolution (i.e., 6 weekly data in
six smart traps. Flies body size was inferior to 0.5 cm for comparison to the single direct trap check data in field).
14.7% of the captured flies, while 64.7% had a size com-
prised between 0.5 and 1.0 cm and 20.6% had a size com-
prised between 1.0 and 1.5 cm. Percentages of flies misiden- Discussion and conclusions
tified were similar in the two monitoring periods (table 2).
The total number of flies captured had a significant effect Insect pest monitoring is crucial to predict when and
on the automatic counts both during the first and the second where an insect pest will cause damage to a crop in order
monitoring period (df = 348, z value = 11.95, P < 0.001 and to prevent and counteract the pest infestations. It needs to
df = 328, z value = 14.45, P < 0.001, respectively). be both efficient and reliable, and considering the limited

Table 4. Costs of codling moth remote monitoring in pome fruit crops by using a smart trap prototype in comparison
 to a standard monitoring trap to be checked weekly in field.
 Cost (€)
 Pear Apple
Cost item
 Smart trap Standard Smart trap Standard
 prototype monitoring trap prototype monitoring trap
Trap device 375.00 15.00 375.00 15.00
Lure and liners 15.00 15.00 15.00 15.00
Field visits a 180.00 600.00 180.00 720.00
Remote monitoring b 200.00 - 240.00 -
Total 770.00 630.00 810.00 750.00
a
 Trap set up, lures and liners replacements, trap removal at the end of the season, and all the trap checks in situ are
 included in this cost voice; b Six weekly checks by remote location for the whole codling moth flight season are
 considered in this cost voice.

156
resources available for direct field, scouting can be opti- Regarding the smart trap trapping efficiency, in a pre-
mized by using new technologies. The main advantages liminary 4-week duration trial the tested design was ca-
of using camera-equipped traps are the less time spent in pable of capturing the target pest codling moth in compa-
field and the possibility to obtain a higher temporal reso- rable numbers to standard monitoring traps. Extensive
lution data on the pest population dynamics. The remote field evaluations of the proposed prototype design are re-
monitoring offers the opportunity to avoid unnecessary quired to further demonstrate the consistency in captures
field visits, limiting them to locations and periods that of the smart trap in comparison to a standard monitoring
strictly require a direct scouting. In addition, it provides designs (usually the delta-shaped traps) to trigger control
precise information about the timing of insecticide appli- interventions at a given threshold. As reported in litera-
cations, delivering data on a daily basis in comparison to ture (Guarnieri et al., 2011; Knight and Light, 2005;
the weekly trap check, and allows to better exploit and Knight et al., 2019b), different factors can affect moth
implement the insect phenology forecasting models captures, including structural elements (such as trap
(Preti et al., 2021a). However, the remote monitoring shape and opening width, trapping surface size and adhe-
with smart traps cannot replace completely the in-field sive material) and operative decisions (such as trap posi-
scouting: a few field visits are required to install the smart tion within the canopy and its proximity to fruits). All
traps and service them, replacing for instance lures and these aspects need to be considered both for a further im-
liners. Growers can potentially implement their pest provement of the smart trap design and for a correct de-
monitoring and management programs by means of such ployment of the monitoring traps in field.
technologies. Nevertheless, an effort to promote the Despite the smart trap captured codling moth and pic-
smart traps development and adoption is required. In fact, tures collected provided a sufficiently high image resolu-
to date the costs and partial knowledge of the advantages tion to manually validated moth captures by remote, the
derived by the smart trap usage limit their potential use detection algorithm failed to automatically provide a
among growers. This work proposes the development of trustworthy capture data. Deep learning validation with
a brand-new smart trap prototype starting from the con- further pictures data is likely necessary to reach a suffi-
struction materials and considering both environmental cient level of reliability in the automatic detection and
and economic sustainability; open-source programs were count system. Similar studies on insect detection carried
used to develop the automatic detection algorithm; the on with the same deep learning approach exploiting the
first results of the trap prototype field validation were CNN algorithm and few hundreds of pictures in the da-
provided in the early stage of its development and a cost- taset concluded that one possible way to solve the target
benefit analysis was also considered to address the re- detection error was to augment the size of the dataset (Xia
mote monitoring cost matter. et al., 2018). In fact, a theoretical calculation proved that
 One issue encountered during the field validation was the error in the CNN algorithms class is correlated to the
the limited power autonomy of some devices due to re- dataset size (Du et al., 2018). This study considered three
peated failures in sending data. As reported in López et qualitative parameters related to pest identification exact-
al. (2012), the highest power consumption of a smart trap ness (i.e., accuracy, sensitivity and precision) in order to
is usually due to data transmission. In the present work, assess the status of the automatic detection algorithm.
the poor or unstable connection of some devices affected The obtained result were expected to be not satisfactory,
negatively the operational life, rapidly discharging the since the smart trap was evaluated in an early stage of its
battery due to multiple sending of pictures. However, in development and the algorithm still needs to be alimented
this study it was proved that with no data sending errors with more data to work properly. This evaluation basis
smart traps were operative for a minimum of 2 months. will be useful for further validation of this prototype in
The power issue was caused by both not good network the future and for comparison among prototypes and
coverage on the tested field locations by all Italian GSM commercial smart traps.
operators and not optimized cellular network technolo- The percentage of either false positive or false negative
gies for the Internet of Things (IoT) and Mobile Edge allows to evaluate the exactness of the system for codling
Computing (MEC) (Giannotta et al., 2019). IoT consists moth automatic identification and count. The detection
of smart devices that communicate with each other (Al- algorithm can be judged reliable when both false positive
Sarawi et al., 2017), while MEC is an emergent architec- and false negative percentages are close to zero. In fact,
ture, where cloud-computing services are extended to the the abundance of false positive implicates overestima-
edge of networks leveraging mobile base stations (Abbas tions of the real captures, triggering control actions when
et al., 2018). To reduce the encountered problems, a fea- not needed. On the contrary, the occurrence of false neg-
sible solution would be to implement an image compres- ative (i.e., underestimation of real pest pressure) can de-
sion algorithm that works on the very low power micro- lay or miss a necessary intervention involving a lower or
controller. Also increasing the energy power of the sys- lack of control. The algorithm outputs included a high
tem using very low-cost components (more accumulators number of both false positive and false negative counts,
and more performant solar panels) can be a practical and suggesting that adjustments of the detection algorithm
effective solution to ensure a longer operational life of are required. The flies automatically detected were simi-
the smart trap. In addition, the new 5G mobile technol- lar in size to codling moth, which has a forewing length
ogy, which is designed to support the IoT devices to be of 6.5-11.0 mm (TortAI, 2020). Therefore, additional pa-
permanently linked to the network with low energy con- rameters should be considered to better discriminate be-
sumption (Giannotta et al., 2019), could help to solve the tween codling moth and flies, such as an improved anal-
connectivity issues. ysis of the light conditions when the picture is taken. This

 157
is not a trivial process, as shadows and sunlight deeply with airborne techniques based on spectral features (Ri-
change the colour perception from a machine point of ley, 1989; Nansen and Elliott, 2016). Nevertheless, de-
view. To solve this issue, a build-it flash light could likely ploying smart traps in multiple locations to create a trap
be exploited to improve the standardization of light con- network (Potamitis et al., 2017), the remote monitoring
ditions during picture acquisition as successfully pro- with smart traps becomes area-wide and can be consid-
posed and adopted in previous related works (Selby et al., ered as a complementary approach to the remote sensing
2014; Rassati et al., 2016). provided by satellite and aerial images. Data derived
 Regarding the smart trap cost-benefit analysis, the eco- from both smart traps, placed locally in situ, and from
nomic calculation demonstrated that despite a slightly remote images covering wider geographical areas (Abd
higher cost (1.1-1.2-fold) of the remote monitoring com- El-Ghany et al., 2020) can be combined for a multidisci-
pared to the classic monitoring, it was possible to in- plinary detection, forecasting, and management of a
crease of 6-fold the time resolution, providing daily pic- number of insect pests and diseases in agricultural crops
tures of the pest captures. This aspect is not negligible and forestry.
since a better optimization of the management practices,
including a more efficient usage of insecticides, may im-
ply the grower incomes increase due to the reduced Acknowledgements
losses. Other authors described the convenience of smart
trap usage. For instance, Ünlü et al. (2019) reported that This study was partially funded by the Autonomous
the remote monitoring of tortricid pest in Turkish vine- Province of Bolzano (Italy) with the project ‘APFEL -
yards allowed to save money and time, with the smart Agricoltura di precisione con sistema di monitoraggio fi-
trap cost recovery by avoiding just two field visits in iso- topatologico esteso e per la localizzazione preventiva di
lated and distant locations (125 $ of weekly field survey attacchi parassitari’ No. 6/2016 - Administrative order
compared to 250 $ of smart trap production cost). Selby No. 3532 issued on March 2, 2017. The authors would
et al. (2014) demonstrated that the usage of a smart trap like to thank Elena Alina Ignatescu, for the technical con-
for research purposes to collect data on the daily insect tributions on the materials researches to construct the
pest activity over the 24 hours costed 78% less than em- smart trap prototype.
ploying a human observer and despite the initial cost of a
smart trap was more expensive, its usage over time would
amortize the cost compared to the man-powdered moni- References
toring. Also in the present study, a longer use of the smart
trap would widen the difference between the classic and ABBAS N., ZHANG Y., TAHERKORDI A., SKEIE T., 2018.- Mobile
remote monitoring, emphasizing the suitability of the lat- edge computing: a survey.- IEEE Internet of Things Journal,
ter one to reduce costs and improve quality. However, the 5 (1): 450-465.
cost-benefit analysis of this work considered a prototypal ABD EL-GHANY N. M., ABD EL-AZIZ S. E., MAREI S. S., 2020.-
trap cost. Usually, a commercialized product includes A review: application of remote sensing as a promising strat-
also other cost items, such as the fee that a company ap- egy for insect pests and diseases management.- Environmen-
plies for the access in the web application. In addition, a tal Science and Pollution Research, 27, 33503-33515.
prototype cost evaluation has not considered variable ADAMS C. G., SCHENKER J. H., MCGHEE P. S., G UT L. J., BRUN-
 NER J. F., MILLER J. R., 2017.- Maximizing information yield
costs depending on the data traffic consumption, the tech- from pheromone-baited monitoring traps: estimating plume
nical assistance and the training offered as services for a reach, trapping radius, and absolute density of Cydia pomo-
commercial smart trap, plus other extra features such as nella (Lepidoptera: Tortricidae) in Michigan apple.- Journal
the inclusion of weather sensors and weather data avail- of Economic Entomology, 110 (2): 305-318.
ability in the trap device. A future economic evaluation AL-SARAWI S., ANBAR M., ALIEYAN K., ALZUBAIDI M., 2017.-
including these parameters should consider commercial Internet of Things (IoT) communication protocols: review,
smart traps. In particular, considering either the purchase pp. 685-690. In: 8th international conference on information
of a smart trap or the seasonal rent of this service. technology (ICIT), 17-18 May 2017, Amman, Jordan.
 In conclusion, this study reports the process of a smart ALI S., SHAUKAT Z., AZEEM M., SAKHAWAT Z., MAHMOOD T.,
 UR REHMAN K., 2019.- An efficient and improved scheme for
trap prototype development using the most updated tech- handwritten digit recognition based on convolutional neural
nologies and including its preliminary field validation. A network.- SN Applied Sciences, 1 (9): 1125.
further improvement of such prototype needs to consider APACHE MAVEN, 2020.- Apache Maven website.- [online] URL:
both the optimization of the data transmission related to https://maven.apache.org/ (accessed December 16, 2020).
the power autonomy, to ensure a complete operability APACHE TOMCAT, 2020.- Apache Tomcat website.- [online]
over the entire monitoring season, and a refinement of the URL: https://tomcat.apache.org/ (accessed December 16,
automatic detection algorithm, in order to allow a reliable 2020).
machine-based count data delivery. In this case study it BARROS-PARADA W., KNIGHT A. L., BASOALTO E., FUENTES-
was proved that with a slight increase of the monitoring CONTRERAS E., 2013.- An evaluation of orange and clear
 traps with pear ester to monitor codling moth (Lepidoptera:
cost, the smart trap system was able to provide a consist- Tortricidae) in apple orchards.- Ciencia e Investigación
ently higher temporal resolution of the capture data infor- Agraria, 40 (2): 307-315.
mation compared to the standard monitoring. Camera- BATES D., MÄCHLER M., BOLKER B., WALKER S., 2015.- Fitting
based insect pest monitoring is a different discipline than linear mixed-effects models using lme4.- Journal of Statisti-
the area-wide remote sensing in entomology performed cal Software, 67 (1): 1-48.

158
You can also read