Development and application of a triplex TaqMan RT-PCR assay for simultaneous detection of Feline calicivirus, Feline Herpesvirus 1 and Feline ...
←
→
Page content transcription
If your browser does not render page correctly, please read the page content below
Development and application of a triplex TaqMan
RT-PCR assay for simultaneous detection of Feline
calicivirus, Feline Herpesvirus 1 and Feline
parvovirus
Xiyu Zhang
Nanjing Agricultural University - Weigang Campus: Nanjing Agricultural University
Zhihui Tang
Nanjing Agricultural University - Weigang Campus: Nanjing Agricultural University
Haoyan Niu
Nanjing Agricultural University - Weigang Campus: Nanjing Agricultural University
Liping Yan
Nanjing Agricultural University - Weigang Campus: Nanjing Agricultural University
suquan song ( suquan.song@njau.edu.cn )
Nanjing Agricultural University https://orcid.org/0000-0002-1350-3825
Original Article
Keywords: RT-PCR, FPV, FCV, FHV-1, Feline virus, Clinical detection
Posted Date: February 10th, 2021
DOI: https://doi.org/10.21203/rs.3.rs-205583/v1
License: This work is licensed under a Creative Commons Attribution 4.0 International License.
Read Full License
Page 1/19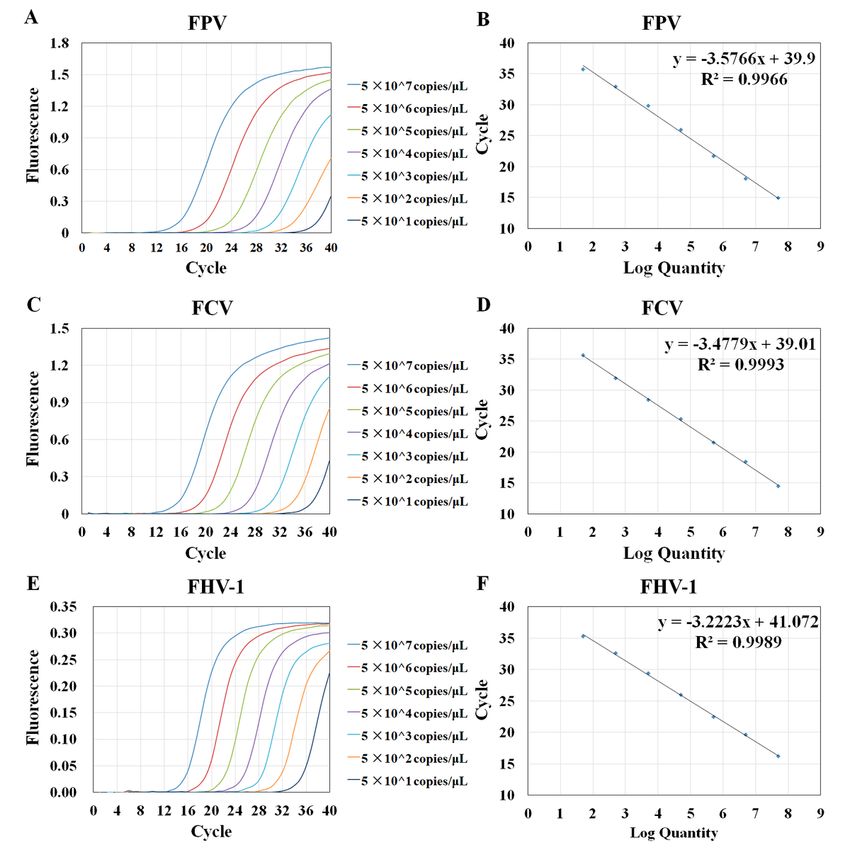
Abstract
The feline calicivirus (FCV), feline herspesvirus 1 (FHV-1) and feline panleukemia virus (FPV) are heavily
threaten the health of cats. In this study, a triplex TaqMan real-time polymerase chain reaction (RT-PCR)
assay (triplex assay) was developed to detect these viruses. The optimized concentration of primers was
0.5 µM of each, probes concentration was 0.1 µM for FCV and FHV-1, 0.05 µM for FPV. The annealing
temperature was set at 54 ℃. The triplex RT-PCR assay was carefully validated. The detection limit for
FPV, FCV, and FHV-1 was 5×101 copies/µL, which showed a 10-100-fold increase in the sensitivity
compared with the conventional PCR. The coefficients of variation (CV) of the intra-assay variability of
the test were < 1.86%, and that of inter-assay was < 3.19%, indicating excellent repeatability and
reproducibility of the triplex assay. Additionally, the assay has perfect specificity. In a pilot study, samples
from 48 cats were analyzed using the triplex RT-PCR method and the commercial kits, and further
confirmed by sequencing. The positive rates for the samples analyzed with these two methods were
70.83% and 62.5%, respectively, which demonstrated that the developed method was more accurate than
the commercial kits in clinical diagnosis.

Introduction
Cats have been regarded as members of our family and their health has received great attention.
However, in clinical practice, infectious diseases such as feline pan-leukemia virus (FPV), feline calicivirus
(FCV) and feline herpes virus 1 (FHV-1) are posing a huge threat to their health. More importantly, the
mixed infection of these three viruses often occurs in the clinic and sometimes has similar clinical
features [1]. As a member of Vesivirus of Calicivirdae, FCV is the most widespread feline virus, with
overall prevalence ranges from approximately 15–31% [2]. The morbidity of FCV can reach to 90% in
some colonies [3]. More importantly, the clinically recovered felines may become the virus carriers [4].
FHV-1 belongs to α-Herpesvirinae of Herpesviridae [1], which mainly infects the kittens aged 2–3 months
[5]. When the kittens are infected, secondary infections are likely to occur due to the reduced immunity,
and the final mortality rate can reach to 70% [6]. Panleukopenia, caused by FPV, a Parvovirus of
Parvoviridae, is another acute, highly contagious, and sometimes fatal feline viral disease, which is
widely distributed throughout the world [7].

Although vaccines can prevent virus infection, in some less developed part of the world, the vaccines
immunization is not universal, these viruses are still highly prevalent and cases of co-infection are often
found, especially in multi-cat households and stray catteries [8]. In another aspect, in the early stages of
these three virus infections, similar clinical symptoms often occur, such as mental illness, anorexia,
sneezing, diarrhea, conjunctival congestion, eye nose secretion, dyspnea, etc. [9–12], which make it
difficult to discriminate them from each other with the naked eye, and therefore miss the best treatment
time. Additionally, in physical examination, this virus infection is the required items for our cats.
Therefore, it is urgent to establish a timesaving, labor-saving, sensitive, and efficient detection method
that is suitable for simultaneous detection of these viruses. Current diagnostic methods for virus
infection includes serological testing, virus isolation and identification, immunoelectron microscopy,
                                                   Page 2/19
polymerase chain reaction (PCR) and so on. Serological diagnosis needs the development of high
specific antibody, while virus isolation and culture and electron microscopy cannot be widely used in
clinical diagnosis due to the high cost and time-consuming.

Nowadays, a second-generation PCR technology, RT-PCR, has been widely used in the field of scientific
research and clinical detection due to its characteristics of high specificity, high sensitivity and shorted
the detection time [13–16]. Although, several PCR methods have been reported for these virus detection
[5, 17–19], most of the methods have low sensitivity or tedious operation, and no method can be used to
detect three kinds of viruses quickly and efficiently at the same time. In this study, a triplex TaqMan RT-
PCR method for simultaneously detection of FCV, FHV-1, and FPV was developed, which can differentiate
these three viruses with high sensitivity, specificity, and reproducibility.

Materials And Methods
Pathogen and clinical samples
FCV(attenuated vaccine strain F9), FHV-1 (attenuated vaccine strain G2620A), FPV (attenuated vaccine
strain MW-1) were purchased from Intervet International B.V. The nucleic acids of Rabies virus (RV,
attenuated vaccine strain Pasteur RIV, from Intervet International B.V.), Pseudorabies virus (PRV,
attenuated vaccine strain HB-98, purchased from Wuhan Keqian Biology), Feline coronavirus (FCoV,
positive clinical samples) and Feline immunodeficiency virus (FIV, positive clinical samples) were used
for the specificity test. The complete gene of Feline leukemia virus (FeLV, AF052723) was synthesized by
Sangon Biotech (Shanghai, China).

An amount of 96 clinical samples from 48 cats (48 oral swabs and 48 rectal swabs) were collected in
Nanjing from February 2019 to December 2019. All samples were divided into two parts, one for the
triplex RT-PCR assay, and the other for commercial kits analysis. At the same time, 30 negative samples
(15 oral swabs and 15 rectal swabs), confirmed to be free of FCV, FHV-1, and FPV [5, 12, 20], were used in
the study. Methods for sample collection and storage were as described [21].
Primers and probes design
The published VP2 gene of FPV virus, ORF2 gene of FCV virus, and TK gene of FHV-1 virus were obtained
from GenBank and aligned by DNAMAN (LynnonBiosoft, USA) to find the conservative regions. Then six
pairs of specific primers and three specific probes were designed, and the specificity was confirmed using
BLAST in NCBI. Three pairs of longer fragments were used to construct plasmids, and three pairs of
shorter fragments and probes were used for fluorescence detection of three viruses. The three probes
were labelled with FAM/BHQ1, VIC/BHQ1, and Texas Red /BHQ2 at its 5’ and 3’ terminals, respectively.
The probes were purchased from Sangon Biotech (Shanghai, China) and the primers were purchased
from Nanjing Kingsley Biotechnology Co. Ltd, the details of these fragments are shown in Table 1.

                                                   Page 3/19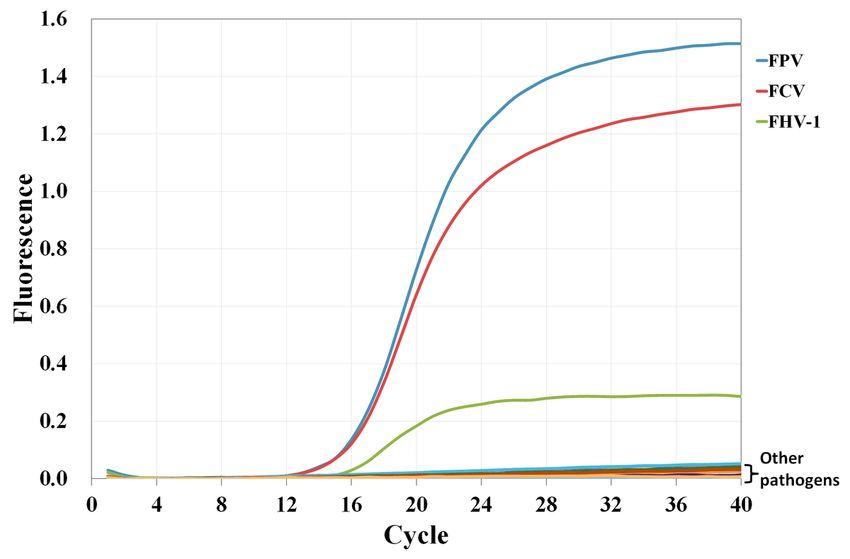
Table 1
                                            Primers and Probes.
 Name        Sequence (5′-3′) b                                           Target        Amplicon
 a                                                                        genes         size(bp)

 FPV-F       CGGGGGTGGTGGTGGTT                                            VP2           105 bp

 FPV-R       GCTTGAGTTTGCTGTGATTTCC

 FPV-P       6-FAM- CTGGGGGTGTGGGGATTTCTACG - BHQ1

 FCV-F       CACTGTGATGTGTTCGAAGTTTGAG                                    OFR2          140 bp

 FCV-R       GAAGCGGGGACTGGTTGC

 FCV -       5`VIC- CATGTGCTCAACCTGCGCTAACGTG - BHQ-1
 P

 FHV-        GATTTGCCGCACCATACCT                                          TK            142 bp
 1-F

 FHV-        GAGTGGGAAACAGACCAGAGAG
 1-R

 FHV-        5`Texas Red-
 1-P         TCTTTTACATTCCAGACTATCCACAATAACAGG - BHQ-2

 a   F: forward primer, R: reverse primer, P: TaqMan probe

 b
     FAM: 6-carboxy-fluorescein, VIC: 6-carboxy-rhodamine, BHQ: Black Hole Quencher

Nucleic acids extraction and standard plasmid preparation
The nucleic acids of FCV, FHV-1 and FPV were extracted by DNA/RNA Extraction kit (Sangon Biotech,
China). Reverse transcription was performed to synthesize viral cDNA following the manufacturer’s
instructions (Thermo Scientific, USA). The concentration and purity of the nucleic acid were determined
by measuring the absorbance at 260/280 nm with a NanoDrop2000c spectrophotometer (Thermo
Scientific, USA). All products were stored at -80 ℃ until use.

FPV, FHV-1, and FCV gene fragments were amplified by PCR. The PCR products were purified and
recovered using a DNA Gel Extraction Kit (Axygen, China). Then, these recovered fragments were cloned
to pMD18T vector (TaKaRa, China) to obtain the pMD18T-FCV, pMD18T-FHV, and pMD18T-FPV,
respectively. The positive plasmids were used as the standard and establish the standard curves. The
concentration of plasmids was calculated according to the absorbance measurement and the conversion
of the copy number of the plasmid has been described in the previous study [22].

Experimental design and RT-PCR
To obtain a more sensitive, stable, and easy PCR method, the annealing temperature, primer
concentration, and probes concentration for each target gene were carefully optimized. D-optimal design

                                                  Page 4/19
(MODDE 12.1 software) was carried out to comprehensively analyze the influence of these factors [23].
The experimental conditions with the highest fluorescence signal and the lowest Ct value were used as
the optimal reaction conditions.
The triplex RT-PCR assay was carried out in a final volume of 20.0 µL on a LightCycler 96 RT-PCR system
(Roche, Switzerland). The composition of the reaction mixture included 10.0 µL of Hieff Unicon® qPCR
TaqMan Probe Master Mix (Yeasen Biotech Co., Ltd), 1.0 µL of template, 0.5 µM of each primer, 0.1 µM of
the FPV probe, 0.05 µM of the FCV probe, 0.05 µM of the FHV-1 probe, and 3.6 µL of double-distilled water
(ddH2O). The thermocycling conditions included: 95 °C for 2 min, 40 cycles of 95 °C for 10 s, 54 °C for
30 s. The uniplex assays were conducted by using the same thermocycling conditions as the triplex
assay. The standard plasmid pMD18T-FCV, pMD18T-FHV, and pMD18T-FPV served as the positive control,
while ddH2O as the negative control.
Conventional PCR
Conventional PCR was performed with a standard program in 20 µL reaction volume on a PCR cycler
(Eppendorf, Germany). The composition of the reaction mixture contained 10.0 µL of 2×Hieff™ PCR
Master Mix with Dye (Yeasen Biotech Co., Ltd), 1.0 µL of template, 0.5 µM of each primer, and 8 µL of
ddH2O. Cycle times were as follows: 95 °C for 5 min (initial denaturation), 40 cycles of 95 °C for 30 s
(denaturation), 54 °C for 30 s (annealing), and 72 °C for 20 s (extension), followed by a final step of
10 min at 72 °C (extension). The PCR products were detected by 1.5% agarose gel electrophoresis. Three
standard plasmids were used as positive control and ddH2O played the role of the negative control.
Validation of the RT-PCR method
The specificity of the established RT-PCR method was confirmed using RV, PRV, FCoV, FIV, and FeLV. To
ascertain the detection limit and the linear range of the method, the plasmids containing the target genes
were diluted by 10 times gradient (from 5×10⁷ copies/µL to 5×100 copies/µL) and subjected to the RT-
PCR assay. The amplification efficiency (AE) and correlation coefficient (R2) were used as parameters to
evaluate the sensitivity of the triplex assay [24]. The repeatability of the method was tested using plasmid
as the templates at the concentrations of 5×10⁷, 5×10⁵, and 5×10³ copies/µL. Each independent
experiment was carried out in triplicate for the intra-assay repeatability test, and triplicate runs over three
days were performed by different operators for the inter-assay repeatability test.
A pilot study of the RT-PCR method
To ensure the reliability of the experiment, we conducted a co-infection experiment, in which three viral
plasmids were mixed in different combinations and proportions and then used for the triplex assay. Then
the method was used to analyze 96 collected clinical samples. In addition, we also compared the results
with the commercial kits. All positive samples were confirmed by sequencing.
Statistical analysis
Page 5/19Data generation and collection were carried out with LightCycler SW 1.1. Data management, analysis,
and graphics generation were performed using Microsoft Excel 2007 (Microsoft, USA) and MODDE 12.1
software (Umetrics, Sweden). Results are presented as mean value (average) ± standard deviation (SD).
The intra- and inter-assay variations were calculated from the mean Ct values and expressed as
coefficients of variation (CV).
Results And Discussion
Optimization of the triplex assay
Annealing temperature is an important factor affecting PCR specificity and amplification efficiency (14).
High annealing temperature will reduce the binding efficiency of primers to templates, and low annealing
temperature will lead to non-specific amplification. In addition, the concentration of primers and probes
also affect the PCR amplification reaction, with low concentration leading incomplete reaction while high
concentration inhibiting the reaction. Therefore, finding the optimal reaction conditions is important to
establish a PCR method. In this study, the D-optimal design consisting of 16 runs (in triplicate
measurements) was first adopted to explore the influence of probe concentrations, primer concentrations
and annealing temperature on RT-PCR. Taking FCV as an example, the three-dimension response surface
curves were shown in Fig. 1A. Red areas represented lower Ct value and blue areas represented higher Ct
value. The abscissa and ordinate of the lowest point were the optimal conditions. The 4D plots further
illustrated the interaction between the three factors (Fig. 1B). We found that when the primer
concentration was lower than 0.35 µM, the Ct value remained high regardless of the change in probe
concentration and annealing temperature. However, when the primer concentration was in the range of
0.4–0.6 µM, the Ct value was lower with a lower probe concentration and annealing temperature.
In addition, we optimized the fluorescence signal of the method (Fig. 2). The results showed the
fluorescence signal of FCV, FHV-1 and FPV was higher when the primer concentration was in the range of
0.5–0.6 µM (Fig. 2A, B, C). For FPV (Fig. 2D), the fluorescence signal of high concentration probes
(0.15 µM and 0.2 µM) is stronger than that of low concentration probes (0.05 µM). However, for FCV
(Fig. 2E) and FHV-1 (Fig. 2F), a low concentration probe (0.05 µM) can obtain a stronger fluorescence
signal. Annealing temperature had an obvious affection on fluorescence signal, that is, as the
temperature decreased, the fluorescence signal increased (Fig. 2G, H, I). Finally, as a compromise, the
optimized experimental conditions was set as follows: primer concentration at 0.5 µM for each virus,
probe concentration at 0.15 µM for FPV, 0.05 µM for FCV or FHV-1, and annealing temperature at 54 °C.
The cut-off for positivity was determined based on the Ct values of the negative samples, which exceeded
36. Once the Ct value of the sample exceeded 36, it was treated as a negative result.
Specificity and sensitivity
FPV, FCV, FHV-1, and other pathogens (including FIV, FeLV, FCoV, RV, PRV) were used for the specificity
test. The results showed that only FCV, FHV-1, and FPV showed specific amplification curves, and the Ct
Page 6/19values were all less than 36 (Fig. 3), while the fluorescence signals of other pathogens and negative
controls were below the baseline detection levels, indicating the triplex assay has high specificity.
The sensitivity test of RT-PCR and conventional PCR was performed with 10-fold serial dilution of
plasmids as the templates (from 5×10⁷ copies/µL to 5×101 copies/µL). Combined with the number of
cycles and the brightness of the gel electrophoresis, the sensitivity test of real-time PCR and conventional
PCR was performed. As shown in Table 2, the Ct value of real-time PCR remained positive and conformed
to the linear trend at 5×101 copies/µL for three viruses. But the sensitivity of conventional PCR was
between 5×10² -5×10³ copies/µL (Fig. 4), which demonstrated a 10-100-fold decrease in the sensitivity
than that of the triplex assay. Besides, the sensitivity of the triplex mixed system was the same as that of
the uniplex system, which was due to the excellent design of the primers and probes and the optimization
of reaction conditions (6).
Table 2
Sensitivity of the real-time PCR.
Number of DNA triplex real-time PCR Ct Value a Uniplex real-time PCR Ct Value b
copies
(mean ± SD) (mean ± SD)
(copies/µL)
FPV FCV FHV-1 FPV FCV FHV-1
5 ×10⁷ 14.39 ± 14.44 ± 16.17 ± 14.32 ± 14.81 ± 16.11 ±
0.25 0.01 0.11 0.25 0.15 0.23
5 ×10⁶ 18.02 ± 18.46 ± 19.62 ± 18.32 ± 18.18 ± 19.69 ±
0.45 0.05 0.22 0.05 0.25 0.07
5 ×10⁵ 21.73 ± 21.53 ± 22.47 ± 21.93 ± 21.37 ± 22.82 ±
0.16 0.22 0.36 0.02 0.03 0.10
5 ×10⁴ 25.93 ± 25.30 ± 25.98 ± 25.50 ± 24.86 ± 26.28 ±
0.06 0.02 0.01 0.66 0.03 0.12
5 ×10³ 29.84 ± 28.42 ± 29.40 ± 27.62 ± 28.07 ± 29.95 ±
0.13 0.03 0.06 0.16 0.52 0.03
5 ×10² 32.91 ± 31.94 ± 32.61 ± 31.76 ± 31.60 ± 32.98 ±
0.21 0.02 0.03 0.35 0.42 0.19
5 ×101 35.67 ± 35.62 ± 34.93 ± 34.08 ± 33.41 ± 35.25 ±
0.83 0.77 0.53 0.33 0.08 0.16
a
The result was considered positive if mean Ct value ≤ 36
b Each reaction was performed in triplicate and the results were shown as the mean ± SD.
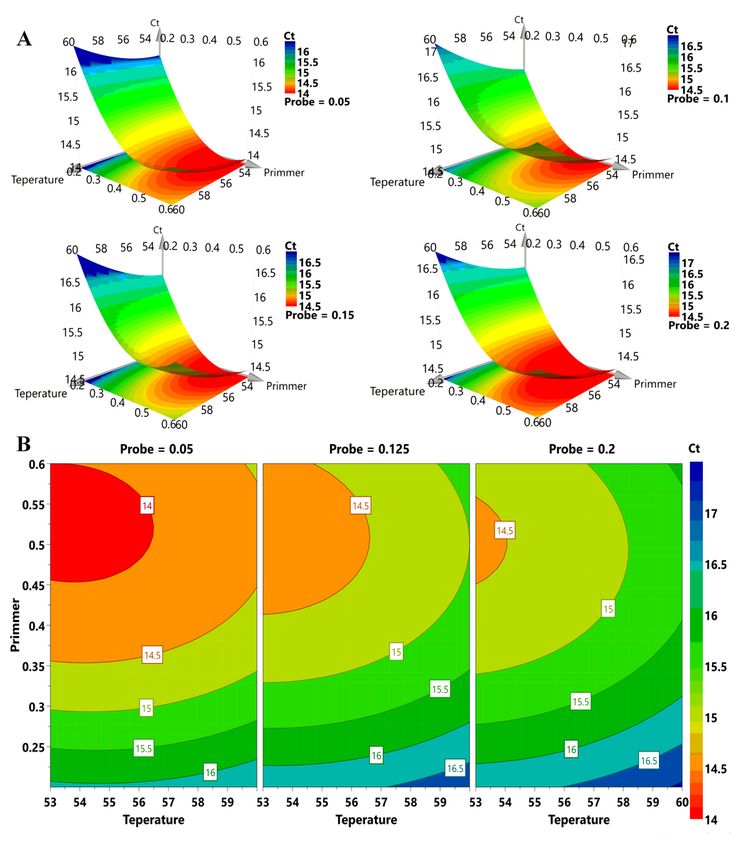
The standard curves of the triplex assay for these viruses were generated (Fig. 5). As shown in the figure,
the triplex assay was linear over a 5×10⁷-5×101 copies/µL range with an R2 value above 0.9966 for all
Page 7/19three viruses. Besides, the AE was 90.37% for FPV, 93.88% for FCV, and 104.19% for FHV-1. The above
results indicated that the assay has good sensitivity while maintaining good amplification efficiency.
The limit of detection (LOD) was determined by the serial dilutions of the recombinant plasmids that
corresponded to the lowest copy number that gave a probability of at least 95% of detecting a PCR
positive test result [25]. When the plasmids were diluted below 5×101 copies/µL, apparently randomly
distributed Ct values in the range of 36 to 38 were observed by the triplex assay [26, 27]. We speculated
that it might be caused by non-specific amplification. Therefore, we chose 5×101 copies/µL as the LOD of
the developed method.
Repeatability and reproducibility of the triplex assay
To assess the stability of the triplex assay, three different concentrations of plasmid were amplified for
the repeatability and reproducibility test of the established real-time PCR method. As shown in Table 3,
the intra- and inter-assay CVs for Ct values between 0.68–1.86%, and 0.85–3.19%, respectively, indicating
triplex assay is highly reliable and accurate.
Table 3
Intra- and Inter-assay reproducibility of the triplex assay
Name Number of DNA Intra-assay a Inter-assay a
Copies
Mean SD CV (%) Mean SD CV (%)
(copies/µL)
FPV 5×10⁷ 14.29 0.15 1.04 14.25 0.21 1.47
5×10⁵ 21.66 0.28 1.29 21.98 0.41 1.87
5×10³ 29.92 0.29 0.96 30.10 0.28 0.93
FCV 5×10⁷ 14.52 0.10 0.69 14.72 0.40 2.72
5×10⁵ 21.42 0.25 1.17 21.28 0.34 1.60
5×10³ 28.35 0.35 1.23 28.89 0.67 2.32
FHV-1 5×10⁷ 16.24 0.11 0.68 16.44 0.37 2.25
5×10⁵ 22.53 0.42 1.86 22.58 0.72 3.19
5×10³ 29.34 0.21 0.72 29.58 0.25 0.85
a
Bold refers the maximum and minimum value
Co-infection models and clinical sample detection
Page 8/19n clinical cases, viruses often infect felines with different combinations and concentrations, especially in
stray cats and kittens with weakened immunity. To simulate this situation, we created the co-infection
models for testing. As shown in Table 4, the method could detect three viruses at the combinations of
different concentrations, regardless of triplex infection or only duplex infections. Furthermore, the Ct value
of the co-infection experiment also satisfied the linear standard, indicating its applicability in virus
quantification during the co-infection. Finally, 96 clinical samples from 48 cats were examined using the
developed method (Table 5). The results demonstrated that 34 cats were infected with FPV, FCV, or FHV-1.
The positive rate for FPV, FCV, and FHV-1 was 29.17% (14/48), 50% (24/48), and 33.33% (16/48),
respectively. Simultaneously, these samples were also detected with commercial kits, which showed that
only 30 cats were infected with these pathogen, with a relatively low positive rate of 41.67%(20/48)for
FCV and 29.17%༈14/48༉for FHV-1. It is worth mentioning that all positive samples detected by
commercial kits were also tested positive by triplex assay. However, 4 cats that were recognized as FCV
positive with the triplex assay were negative detected by the commercial kits. More importantly, all
positive samples were confirmed by sequencing. Thus, the established RT-PCR method showed high
accuracy than commercial kits in clinical diagnosis.
Page 9/19Table 4
The detection of the co-infection models by triplex real-time PCR
Co-infection proportion Number of DNA copies Co-infection real-time PCR Ct Value
a
(copies/µL) (mean ± SD)
FPV FCV FHV-1 FPV FCV FHV-1
FPV:FCV:FHV-1 = 10:1:1 5× 10⁷ 5× 10⁶ 5× 10⁶ 14.50 ± 18.30 ± 0.27 19.65 ± 0.07
0.33
FPV:FCV:FHV-1 = 10:2:1 5× 1× 5× 14.32 ± 17.21 ± 0.12 19.43 ± 0.20
107 107 106 0.07
FPV:FCV:FHV-1 = 1:2:10 5× 1× 5× 18.25 ± 17.12 ± 0.08 16.04 ± 0.28
106 107 107 0.21
FPV:FCV = 1:1 5× 10⁷ 5× - 14.28 ± 14.52 ± 0.12 -
107 0.28
FPV:FCV = 10:1 5× 5× - 14.34 ± 18.58 ± -
107 106 0.09 0.06.
FPV:FCV = 100:1 5× 5× - 14.30 ± 21.71 ± 0.18 -
107 105 0.11
FPV:FHV-1 = 1:1 5× - 5× 14.16 ± - 16.08 ± 0.20
107 107 0.26
FPV:FHV-1 = 10:1 5× - 5× 14.41 ± - 19.79 ± 0.33
107 106 0.19
FPV:FHV-1 = 100:1 5× - 5× 14.26 ± - 22.43 ± 0.13
107 105 0.12
FCV:FHV-1 = 1:1 - 5× 5× - 14.58 ± 0.22 16.11 ± 0.16
107 107
FCV:FHV-1 = 10:1 - 5× 5× - 14.49 ± 0.19 19.49 ± 0.24
107 106
FCV:FHV-1 = 100:1 - 5× 5× - 14.54 ± 0.32 22.33 ± 0.23
107 105
a
Standard plasmids of different concentrations were mixed in corresponding proportions and used
as templates for real-time PCR.
Page 10/19Table 5
Clinical samples detected by triplex assay and commercial kits
Name Triplex assay Commercial kits
Positive rate(%) Positive rate(%)
FPV 6/48 12.50 6/48 12.50
FCV 8/48 16.67 6/48 12.50
FHV-1 2/48 4.17 2/48 4.17
FPV + FCV 4/48 8.33 4/48 8.33
FPV + FHV-1 2/48 4.17 2/48 4.17
FCV + FHV-1 10/48 20.83 8/48 16.67
FPV + FCV + FHV-1 2/48 4.17 2/48 4.17
Total 34/48 70.83 30/48 62.50
Furthermore, we found that the positive rate of FPV, FCV, and FHV-1 in this study was higher than
previous surveys, which might be due to clinical samples were obtained from diseased cats with clinical
symptoms. In addition, the mixed infection was common, most of which were co-infected with FCV and
FHV-1, with a ratio of 20.83% (10/48). It worth noting that, firstly, most of the co-infection cases were
stray cats or kittens within 3 months, which was consistent with the previous survey. The reason lies that,
firstly, cats aged 2–3 months are trapped in weaning and their immune system is not fully developed, and
therefore they are susceptible to viruses. Secondly, most of the stray cats are not vaccinated, which are
prone to carry the virus and spread it to domestic cats. Therefore, our research highlights the great need
for virus surveillance in stray cats.
Abbreviations
PCR: Polymerase chain reaction; FCV:Feline calicivirus; FHV-1:Feline herpesvirus 1; FPV:Feline
panleukemia virus; FCoV:Feline coronavirus; FIV:Feline immunodeficiency virus; FeLV:Feline leukemia
virus; RV:Rabies virus; PRV:Pseudorabies virus; ddH2O:Double distilled water; Ct:Cycle threshold;
SD:Standard deviation; R2:Correlation coefficient; AE:Amplification efficiency; CV:Coefficients of variation;
LOD:Limit of detection; TK:Thymidine kinase; VP:Viral structural protein; ORF:Open reading frame;
NC:Negative control; M:DL600 marker
Declarations
Conflicts of interest
Page 11/19The authors declare that they have no conflict interests.
Ethical approval
This study was performed in accordance with the recommendations in the Guide for the Care and Use of
Laboratory Animals of the Ministry of Health, China. All animal welfare and experimental procedures were
in accordance with the approval of the ethical regulations of Nanjing Agricultural University (Permission
Number: SYXK (Su) 2017-0007).
Funding
The study was supported by the National Key Research and Development Program (2016YFD0501009),
Forestry Science and Technology Innovation and Promotion Project of Jiangsu Province (LYKJ [2018]
22), the State Key Laboratory for Managing Biotic and Chemical Threats to the Safety of Agro-products
(KF20190109), and the Priority Academic Program Development of Jiangsu Higher Education
Institutions.
Authors’ contributions
LPY and SQS designed the study. SQS revised and approved the manuscript. XYZ developed the triplex
assay and drafted the manuscript. ZHT recorded, collated, and analyzed the data. HYN collected and
processed clinical samples. All authors read and approved the final manuscript.
References
1. Cohn LA (2011) Feline respiratory disease complex. Vet Clin North Am Small Anim Pract
41(6):1273–1289
2. Coutts AJ, Dawson S, Willoughby K, Gaskell RM (1994) Isolation of feline respiratory viruses from
clinically healthy cats at UK cat shows. Vet Rec 135(23):555–556
3. Coyne KP, Dawson S, Radford AD, Cripps PJ, Porter CJ, McCracken CM, Gaskell RM (2006) Long-term
analysis of feline calicivirus prevalence and viral shedding patterns in naturally infected colonies of
domestic cats. Vet Microbiol 118(1–2):12–25
4. Binns SH, Dawson S, Speakman AJ, Cuevas LE, Hart CA, Gaskell CJ, Morgan KL, Gaskell RM (2000)
A study of feline upper respiratory tract disease with reference to prevalence and risk factors for
infection with feline calicivirus and feline herpesvirus. J Feline Med Surg 2(3):123–133
5. Abd-Eldaim MM, Wilkes RP, Thomas KV, Kennedy MA (2009) Development and validation of a
TaqMan real-time reverse transcription-PCR for rapid detection of feline calicivirus. Arch Virol
154(4):555–560
Page 12/196. Maggs DJ, Lappin MR, Reif JS, Collins JK, Bruns C (1999) Evaluation of serologic and viral detection
methods for diagnosing feline herpesvirus-1 infection in cats with acute respiratory tract or chronic
ocular disease. J Am Vet Med Assoc 214(4):502–507
7. Stuetzer B, Hartmann K (2014) Feline parvovirus infection and associated diseases. Vet J
201(2):150–155
8. Camero M, Cavalli A, Bozzo G, Decaro N, Aliberti A, Martella V, Pratelli A, Buonavoglia C (2004) A
severe dual infection by feline panleukopenia virus and feline calicivirus in an adult cat. New
Microbiol 27(1):79–82
9. Radford AD, Coyne KP, Dawson S, Porter CJ, Gaskell RM (2007) Feline calicivirus. Vet Res 38(2):319–
335
10. Reubel GH, Hoffmann DE, Pedersen NC (1992) Acute and chronic faucitis of domestic cats. A feline
calicivirus-induced disease. Vet Clin North Am Small Anim Pract 22(6):1347–1360
11. Sjodahl-Essen T, Tidholm A, Thoren P, Persson-Wadman A, Bolske G, Aspan A, Berndtsson LT (2008)
Evaluation of different sampling methods and results of real-time PCR for detection of feline herpes
virus-1, Chlamydophila felis and Mycoplasma felis in cats. Vet Ophthalmol 11(6):375–380
12. Yao M, Zhang X, Gao Y, Song S, Xu D, Yan L (2019) Development and application of multiplex PCR
method for simultaneous detection of seven viruses in ducks. BMC Vet Res 15(1):103
13. Bustin SA, Benes V, Garson JA, Hellemans J, Huggett J, Kubista M, Mueller R, Nolan T, Pfaffl MW,
Shipley GL, Vandesompele J, Wittwer CT (2009) The MIQE guidelines: minimum information for
publication of quantitative real-time PCR experiments. Clinical chemistry 55(4):611–622
14. Ian MM (2002) Real-time PCR in virology. Nucleic acids research 6(30):1292–1305
15. Mackay IM (2004) Real-time PCR in the microbiology laboratory. Clin Microbiol Infect 10(3):190–212
16. Espy MJ, Uhl JR, Sloan LM, Buckwalter SP, Jones MF, Vetter EA, Yao JD, Wengenack NL, Rosenblatt
JE, Cockerill FR 3rd, Smith TF (2006) Real-time PCR in clinical microbiology: applications for routine
laboratory testing. Clin Microbiol Rev 19(1):165–256
17. Helps C, Reeves N, Egan K, Howard P, Harbour D (2003) Detection of Chlamydophila felis and feline
herpesvirus by multiplex real-time PCR analysis. J Clin Microbiol 41(6):2734–2736
18. Hussein IT, Field HJ (2008) Development of a quantitative real-time TaqMan PCR assay for testing
the susceptibility of feline herpesvirus-1 to antiviral compounds. J Virol Methods 152(1–2):85–90
19. Litster A, Wu CC, Leutenegger CM (2015) Detection of feline upper respiratory tract disease
pathogens using a commercially available real-time PCR test. Vet J 206(2):149–153
20. Sykes JE, Allen JL, Studdert VP, Browning GF (2001) Detection of feline calicivirus, feline herpesvirus
1 and Chlamydia psittaci mucosal swabs by multiplex RT-PCR/PCR. Vet Microbiol 81(2):95–108
21. Roelandt S, Outtrim L, Browning C, Alexander DJ, Brown IH, Irvine RM (2012) Evaluation of two
different swab transport systems in the detection of avian influenza virus excretion from infected
Pekin ducks (Anas platyrhynchos). J Virol Methods 184(1–2):8–14
Page 13/1922. Sykes JE (2014) Pediatric feline upper respiratory disease. Vet Clin North Am Small Anim Pract
44(2):331–342
23. Towe S, Kleineidam K, Schloter M (2010) Differences in amplification efficiency of standard curves in
quantitative real-time PCR assays and consequences for gene quantification in environmental
samples. J Microbiol Methods 82(3):338–341
24. Simmons M, Myers T, Guevara C, Jungkind D, Williams M, Houng HS (2016) Development and
Validation of a Quantitative, One-Step, Multiplex, Real-Time Reverse Transcriptase PCR Assay for
Detection of Dengue and Chikungunya Viruses. J Clin Microbiol 54(7):1766–1773
25. Burns M, Valdivia H (2008) Modelling the limit of detection in real-time quantitative PCR. European
Food Research Technology 226(6):1513–1524
26. Forootan A, Sjoback R, Bjorkman J, Sjogreen B, Linz L, Kubista M (2017) Methods to determine limit
of detection and limit of quantification in quantitative real-time PCR (qPCR). Biomol Detect Quantif
12:1–6
27. Angen O, Jensen J, Lavritsen DT (2001) Evaluation of 5' nuclease assay for detection of
Actinobacillus pleuropneumoniae. J Clin Microbiol 39(1):260–265
Figures
Page 14/19Figure 1
Response surface plots for FCV. A. 3D response graphs based on different combinations of primmer
concentration,probe concentration and annealing temperature generated by computer-aided exchange
procedure. B. Response surface graphs of primer concentration and annealing temperature at different
probe concentrations.
Page 15/19Figure 2
Effect of reaction conditions on fluorescence intensity. Effect of different primer concentrations (A, B, C),
probe concentrations (D, E, F), and annealing temperatures (G, H, I) on fluorescence signal.
Page 16/19Figure 3
Specificity of the triplex assay. FPV, FCV, FHV-1, and other animal pathogens (including FIV, FeLV, FCoV,
RV, PRV) were selected and tested using the triplex assay.
Page 17/19Figure 4
Detection limit of conventional PCR. Templates of pMD18T-FPV (A), pMD18T-FCV-1 (B), and pMD18T-
FHV-1 (C) were diluted by 10 times gradient to a dilution factor that could not be detected by conventional
PCR. The detection limit was 5×10³ copies/μL for FPV, 5×10² copies/μL for FCV and FHV-1. Template
amount for curves 2-8/lanes was: 5×10⁷-5×101 copies/μL, respectively. M, DL600 marker; NC, negative
control.
Page 18/19Figure 5
Amplification and standard curves of the triplex assay. Serially diluted plasmids were mixed at equal
concentration (from 5×10⁷ copies/μL to 5×101 copies/μL) and used as template for RT-PCR.
Amplification curves of the triplex assay for the detection of FPV (A), FCV (C), and FHV-1 (E). The
standard curves of FPV (B), FCV (D), and FHV-1 (F) were generated by plotting the Ct values (Y-axis)
against the logarithm of copy numbers of plasmids (X-axis).
Page 19/19You can also read