Development of a novel transcription factors related prognostic signature for serous ovarian cancer
←
→
Page content transcription
If your browser does not render page correctly, please read the page content below
www.nature.com/scientificreports
OPEN Development of a novel
transcription factors‑related
prognostic signature for serous
ovarian cancer
He Li1, Nayiyuan Wu1, Zhao‑Yi Liu1, Yong‑Chang Chen1, Quan Cheng2,3* & Jing Wang1,3*
Growing evidence suggest that transcription factors (TFs) play vital roles in serous ovarian cancer
(SOC). In the present study, TFs mRNA expression profiles of 564 SOC subjects in the TCGA database,
and 70 SOC subjects in the GEO database were screened. A 17-TFs related prognostic signature
was constructed using lasso cox regression and validated in the TCGA and GEO cohorts. Consensus
clustering analysis was applied to establish a cluster model. The 17-TFs related prognostic signature,
risk score and cluster models were effective at accurately distinguishing the overall survival of SOC.
Analysis of genomic alterations were used to elaborate on the association between the 17-TFs related
prognostic signature and genomic aberrations. The GSEA assay results suggested that there was a
significant difference in the inflammatory and immune response pathways between the high-risk
and low-risk score groups. The potential immune infiltration, immunotherapy, and chemotherapy
responses were analyzed due to the significant difference in the regulation of lymphocyte migration
and T cell-mediated cytotoxicity between the two groups. The results indicated that patients with
low-risk score were more likely to respond anti-PD-1, etoposide, paclitaxel, and veliparib but not to
gemcitabine, doxorubicin, docetaxel, and cisplatin. Also, the prognostic nomogram model revealed
that the risk score was a good prognostic indicator for SOC patients. In conclusion, we explored the
prognostic values of TFs in SOC and developed a 17-TFs related prognostic signature to predict the
survival of SOC patients.
Ovarian cancer (OC) is one of the most lethal gynecological cancer globally, with 295,414 new cases and 184,799
deaths in 2 0181. The disease encompasses a heterogeneous group of malignancies with epithelial ovarian cancer
(EOC) accounting for 90% of all cases. Based on tumor cell histology, EOC is classified as serous, endometrioid,
mucinous, clear cell, others, or unspecified. Data shows that more than 50% of EOC is serous ovarian cancer
(SOC)2. Approximately 60% of OC patients are diagnosed with late-stage disease, partly due to limited test meth-
ods. Platinum-based chemotherapy is the main treatment for OC patients; a high proportion of OC patients suffer
from platinum resistance, leading to insignificant improvement in the 5-year survival rate in the past d ecade3.
Multiple prognostic biomarkers have been discovered in O C4. For instance, CA125 was the firstly identi-
fied prognostic biomarker and is used clinically5,6. The mutation status of BRCA1/2 is proven to be associated
with patient prognosis and chemosensitivity7. Several promising prognostic OC biomarkers have been recently
discovered such as; VEGF, HE4, mesothelin, M-CSF, osteopontin, kallikrein(s), bikunin, EphA2, and soluble
EGF receptor4. With the development of multi-omics, numerous genomic variations, miRNAs, lncRNAs, and
metabolites have been suggested to serve as prognostic b iomarkers8–13.
eterogeneity14. Models integrating multiple
It is difficult to blame OC on a single specific issue due to its h
genes spring up in OC and other cancers as the global gene expression data becoming more feasible to use. So far,
autophagy, DNA repair pathway, and the Notch pathway-related prognostic signatures have been developed for
OC15–17. Gene methylation panel, miRNAs-based signature, miRNA-lncRNA signature were established because
of the vital role of epigenetics in OC p rognosis18–20. Recently, a novel and non-invasive radiomic prognostic
signature was derived based on computed tomography (CT) images, which significantly improved prognostic
methods and could be exploited to guide personalized therapy of O C21.
1
The Affiliated Cancer Hospital of Xiangya School of Medicine, Central South University/Hunan Cancer Hospital,
Changsha, Changsha 410008, Hunan, People’s Republic of China. 2Department of Neurosurgery, Xiangya Hospital,
Central South University, Changsha 410008, Hunan, People’s Republic of China. 3These authors contributed
equally: Quan Cheng and Jing Wang *email: chengquan@csu.edu.cn; wangjing0081@hnca.org.cn
Scientific Reports | (2021) 11:7207 | https://doi.org/10.1038/s41598-021-86294-z 1
Vol.:(0123456789)
www.nature.com/scientificreports/
Figure 1. The workflow of this study.
Transcription factors participate in various biological processes including cancer proliferation, invasion and
migration, cell cycle, apoptosis, EMT, differentiation, and drug resistance22; therefore, numerous TFs have been
suggested to be potential treatment targets and prognostic biomarkers in various c ancers22,23. However, it is not
clear whether TFs can be utilized to predict the prognosis of SOC. Therefore, we aimed to explore the prognostic
values of TFs in SOC and to identify a novel TFs related prognostic signature for SOC.
Results
Clinical characteristics of the study patients. The TFs mRNA expression profiles of 564 SOC sub-
jects in the TCGA database and 70 SOC subjects in the GEO database were screened. All patients from the
TCGA database were randomly separated into training (n = 282) and test (n = 282) cohorts and there was no
difference between two cohorts in age (p = 0.4104), FIGO stage (p = 0.6542), Grade (p = 0.6890) and living status
(p = 0.6393) (Supplement Table 2). Patients from the GEO database were used as the external validation cohort.
The workflow indicated in Fig. 1 shows the process of the study.
Construction and validation of TFs‑related risk signature for SOC. All the TFs derived from
MSigDB database were analyzed by using univariate cox regression analysis. 88 TFs associated with overall sur-
vival of SOC patients were selected (Supplement Table 3). To narrow down the panel and optimize gene assembly,
the 88 selected gene were employed in the LASSO cox regression model, in which we obtained 17 TFs (CBX5,
CREB3, FOXJ1, FOXK2, IRF4, LHX2, RB1, SPDEF, STAT2, TBX2, TEAD1, TFAM, TRIM38, ZHX3, ZNF124,
ZNF8 and ZXDB) (Fig. 2A,B). Their coefficients were listed in Fig. 2C and were substituted into formula to cal-
culated the risk score. Based on the median risk value as a cutoff point (cutoff = − 2.047), patients were divided
into high-risk and low-risk groups (Fig. 2D). There was a significant difference in prognosis between high-risk
group and low-risk group (Fig. 2E). The prediction feature was assessed by the ROC curve and the AUC value
of 0.803 (Fig. 2F). Similarly, patients with high-risk scores had a poor OS in the test cohort, sum cohort, and
external validation cohort (p < 0.0001, p < 0.0001, p = 0.031, respectively, Fig. 3A–I). It is worth mentioning that
there was a significant difference in OS rate between high- risk score group and low-risk score group in ICGC
cohort and Tothill cohort (p = 0.035, p = 0.005, respectively; Supplement Fig. 1A-1B). Moreover, the distribu-
tion of six molecular subtypes identified by Tothill et al., were different in high-risk group and low-risk group
(p < 0.001, Supplement Fig. 1C). All these findings indicated that there was a significant association between the
TFs-related risk signature and SOC patients’ prognosis and it might be used to accurately predict the outcome
of patients with SOC.
The association between the risk signature and various clinicopathologic features including grade, FIGO
stage, and residual tumor size was analyzed. The results showed that there was no difference in risk score among
different grades (p > 0.05, Supplement Fig. 2A). Patients with FIGO IV and III had higher risk scores compared
with patients with FIGO I and II, (p < 0.01, Supplement Fig. 2B). There was also a significant association between
residual tumor size and risk score (p < 0.001, Supplement Fig. 2C). A stratified analysis based on age, grade, FIGO
grade, and residual tumor size was constructed. The high-risk group had shorter OS than the low-risk group in
all these stratified cohorts, indicating that the TFs-related risk signature could be used to accurately distinguish
the prognosis of SOC patients, without considering the clinical parameters (p < 0.01, Fig. 4A–J).
Association between the TFs‑related risk signature and genetic alterations. Genetic alterations
including somatic mutations and SCNAs were identified in the lowest risk (1st) and highest risk (4th) groups.
Scientific Reports | (2021) 11:7207 | https://doi.org/10.1038/s41598-021-86294-z 2
Vol:.(1234567890)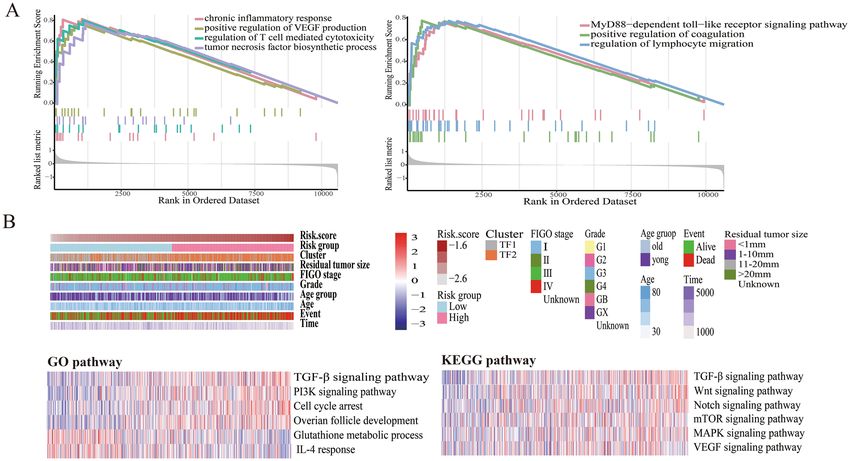
www.nature.com/scientificreports/

                                  Figure 2.  A 17-TFs related prognostic signature was established in TCGA training cohort. (A–C) The lasso
                                  coefficients of the 17 TFs for overall survival in TCGA training cohort; (D) The distribution of risk score and
                                  alive status in TCGA training cohort; (E,F) The 17-TF related prognostic signature predicts overall survival in
                                  SOC and the prediction performance was evaluated by calibration curve.

                                  There was no difference between the two groups in the mutation frequency of TP53, TIN, MUC16, DNH3,
                                  CSMD3, FAT3, FLG, and APOB (Fig. 5A,B). Patients in the lowest risk group had a higher probability of somatic
                                  mutation in the DNAH3 gene, while a higher mutation frequency of KMT2C and USH2A occurred in the high-
                                  est risk group (Fig. 5A,B). We also analyzed the SCNAs between both groups (Fig. 5C,D). The G values between
                                  the highest-risk and lowest risk groups were significantly different, although the amplification (including 19q.12,
                                  8q24.21, 3q36.2 and 11q14.1) and focal peaks (including 19p13.3, 22q13.32, 5q12.1, and 17q11.2) were detected
                                  in both groups. Additionally, several regions of amplifications harboring multiple oncogenes, such as 8q24.21
                                  (PTV1, MYC)19q13.2 (NFKBIB), 19p13.12 (NOTCH3) and 15q26.3 (IGF1R) were only detected in the high-
                                  est risk group. Moreover, focal deletion peaks were detected in the group with high-risk scores such as 9p21.3
                                  (CDKN2A, CDKN2B) and 10q23.31 (FAS) (Fig. 5C,D).

                                  Consensus clustering analysis to construct the cluster model. All SOC samples from the TCGA
                                  database were divided into different clusters using consensus clustering analysis; two was found to be the optimal
                                  number of clusters (Supplement Fig. 3A-2B). The principal component analysis (PCA) explored the significant
                                  difference in mRNA expression of the 17 TFs between the two clusters (TF1 vs. TF2) (Fig. 6A). There was a sig-

Scientific Reports |   (2021) 11:7207 |                https://doi.org/10.1038/s41598-021-86294-z                                                   3

                                                                                                                                              Vol.:(0123456789)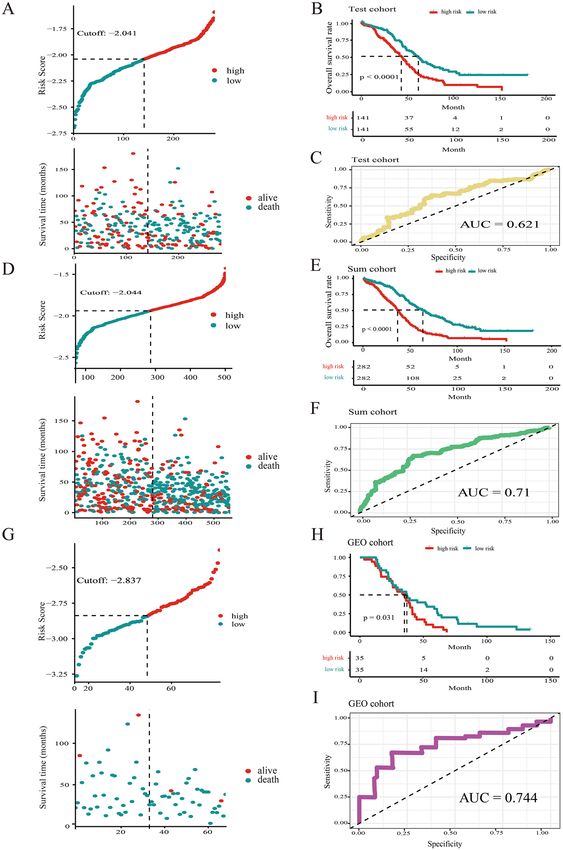
www.nature.com/scientificreports/

                                            Figure 3.  The 17-TFs related prognostic signature was verified in TCGA test cohort (A–C), TCGA sum cohort
                                            (D–F) and GEO cohort (G–I).

                                            nificant difference in OS between the two clusters (p = 0.00023, Fig. 6B). The TF1 cluster was related to a lower
                                            risk score, while it had no association with age, FIGO stage, grade, and residual tumor size (Fig. 6B,C).

                                            Pathways enrichment analysis to identify the biological function of TFs in SOC.                      First, GSEA
                                            analysis was performed to identify the differences in biology function among patients with high-risk and low-
                                            risk scores. The results indicated differences in several pathways including chronic inflammatory response, posi-
                                            tive regulation of vascular endothelial growth factor, regulation of T cell-mediated cytotoxicity, tumor necro-
                                            sis factor biosynthetic process, MyD88-dependent toll-like receptor signaling pathway, positive regulation of
                                            coagulation, and regulation of lymphocyte migration (Fig. 7A). Then, GSVA analysis was executed to reveal
                                            the functional enrichment status of the 17-TFs in SOC. Signal pathways with a high correlation coefficient
                                            and statistical significance were selected from GO gene sets and KEGG pathway analysis. The higher gene set

          Scientific Reports |   (2021) 11:7207 |               https://doi.org/10.1038/s41598-021-86294-z                                                 4

Vol:.(1234567890)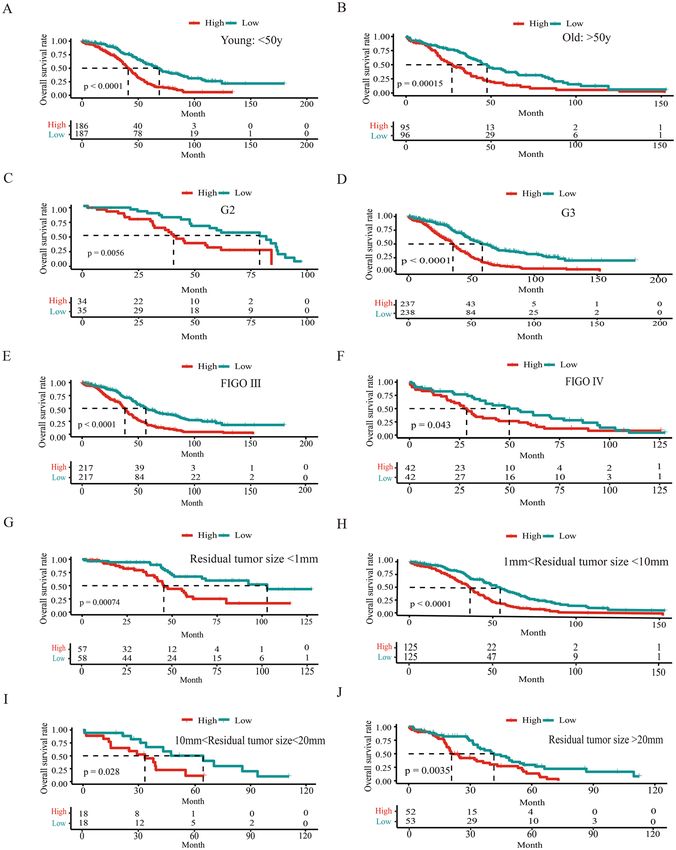
www.nature.com/scientificreports/

                                  Figure 4.  Construct a stratified analysis based on age (A,B), grade (C,D), FIGO grade (E,F) and residual
                                  resection status (G–J) to analyze the association between the TFs related prognostic signature and overall
                                  survival.

                                  enrichment scores of all the selected signaling pathways were associated with higher risk scores, except the
                                  glutathione metabolic process and IL-4 response pathways. Some pathways, including the TGF-β signaling and
                                  IL-4 response, were mainly related to the inflammatory response (Fig. 7B). Cell proliferation, invasion, and
                                  migration-related pathways including; PI3K signaling, cell cycle arrest, Wnt signaling, Notch signaling, mTOR
                                  signaling, MAPK signaling, and VEGF signaling, were also enhanced in the high-risk score group. The biological
                                  processes involved in each TF were also analyzed, indicating that they had different biological functions in SOC
                                  (supplement Fig. 4A-4B).

                                  Difference of the potential immune infiltration, immunotherapy and chemotherapy response
                                  between high‑risk score and low‑risk score groups. There was a significant difference between the
                                  high-risk and the low-risk score groups in the regulation of lymphocyte migration and T cell-mediated cytotox-
                                  icity. Therefore, the potential immune infiltration, immunotherapy, and chemotherapy responses were analyzed.
                                  Data showed that the distribution of aDC, B cells, NK CD56bright cells, NK CD56dim cells, T cells, TFH and
                                  Th2 cells was lower in the high-risk than the low-risk score group, whereas mast cells, NK cells, and Tcm cells
                                  infiltration was higher in the high-risk than the low-risk score group (Fig. 8A). The difference in immune infil-

Scientific Reports |   (2021) 11:7207 |               https://doi.org/10.1038/s41598-021-86294-z                                                    5

                                                                                                                                               Vol.:(0123456789)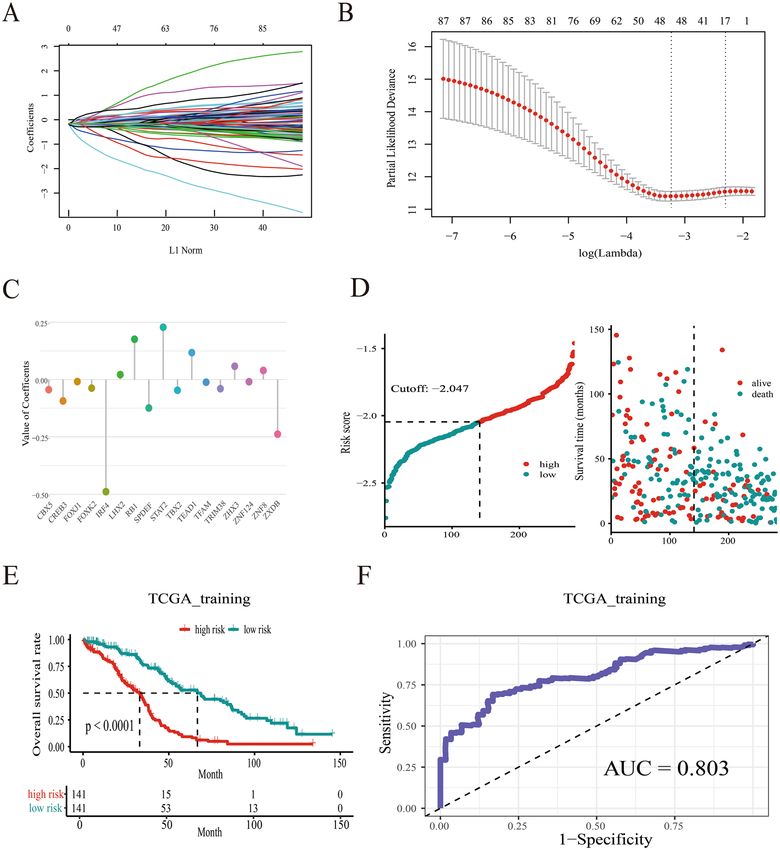
www.nature.com/scientificreports/
Figure 5. Genetic alterations including somatic mutations (A,B) and SCNAs (C,D) assigned to high-risk group
(A,C) and low-risk group (B,D); The green line represents the significance threshold (q value = 0.25).
tration between two clusters (TF1 vs. TF2) was also determined (supplement Fig. 5). The potential response to
immunotherapy for each patient was assessed using the TIDE algorithm. The results suggest that patients with
low-risk scores are more sensitive to immunotherapy than those with high-risk scores (p = 0.0003, Fig. 8B). Sub-
sequently, the response of anti-CTL4 and anti-PD-1 therapy were explored; patients in the low-risk score group
were more likely to respond to anti-PD-1 therapy (p = 0.01, Fig. 8C).
Chemotherapy is the main treatment method for SOC and it plays a key role in patients’ survival. The dif-
ferent response to chemotherapy between the high-risk and low-risk score groups was noted. The cell line data
obtained from GDSC database were used to train the predictive model and the IC50 values for a total of 137 com-
monly used anti-tumor drugs were determined; the values were calculated by the predictive model. The results
indicated that there was a significant difference in the estimated IC50 of twenty-one dugs between the high-risk
and low-risk score groups (Supplement Table 4). Patients with low-risk scores showed better response to etopo-
side, paclitaxel, and veliparib (p = 3.33e − 6; p = 0.003; p = 0.040, respectively, Fig. 8D). However, the response to
gemcitabine, doxorubicin, docetaxel, and cisplatin was similar for patients in the two groups (p = 0.077, p = 0.131,
p = 0.169, p = 0.182, respectively; Supplement Fig. 6). The different response to all the 137 drugs commonly used
to treating cancers in high risk and low risk group were listed in Supplement Table 4.
Modeling prognostic nomogram for overall survival. Due to the loss of clinical data, only 503 SOC
patients were included in modeling prognostic nomogram for overall survival. First, the independent prognos-
tic factors were identified using univariate and multivariant cox regression (Table 1). The results indicated that
risk score (p < 0.001, HR = 10.0841), residual tumor size (1–10 mm: p < 0.01, HR = 1.5889; 10–20 mm: p = 0.008,
HR = 2.0247; > 20 mm: p < 0.001, HR = 2.0447), and age (p = 0.02, HR = 0.7586) were all independent prognostic
factor for 5-year overall survival. The FIGO stage was adopted as one of the independent factors given that
the FIGO III + IV parameters were statistically significant in univariant cox regression (p = 0.03, HR = 2.884),
and showed marginal statistical difference in multivariant cox regression (p = 0.133, HR = 1.7485). There was no
association between grade, stage, and 5-year overall survival of patients. Therefore, risk score, residual disease,
age, and FIGO stage were used to construct the nomogram, and each variable was assigned a score on the cor-
responding axis. The probabilities of the outcomes were determined by the location of the total score on the
survival axes, which was calculated by adding up all the variables (Fig. 9A). The nomogram-predicted 5-year
overall survival closely corresponded with the observations (Fig. 9B). Calibration curves were used to evaluate
the accuracy of the nomogram with an AUC value of 0.736 (Fig. 9C). The prognostic model value was calculated
according to prognostic factors and regression coefficient. Patients were divided into two groups by setting the
Scientific Reports | (2021) 11:7207 | https://doi.org/10.1038/s41598-021-86294-z 6
Vol:.(1234567890)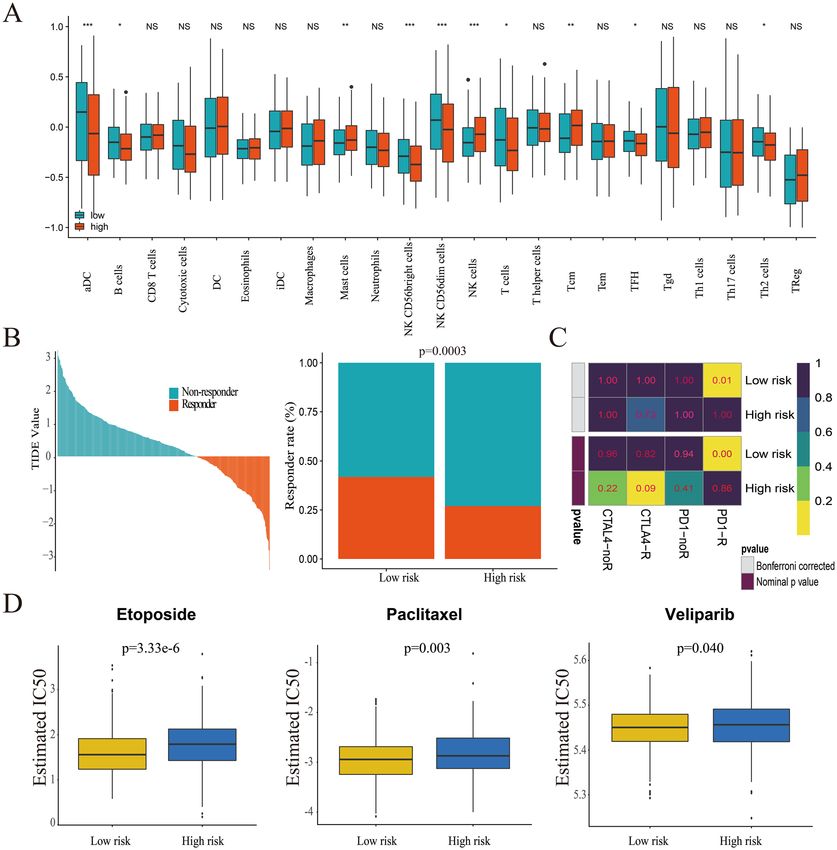
www.nature.com/scientificreports/

                                  Figure 6.  The significant difference of the mRNA expression of the 17 TFs (A) and overall survival (B) between
                                  the two clusters (TF1 vs. TF2); (C) The relationship among TFs mRNA expression, risk score, alive status,
                                  overall survival, age, FIGO sage, Grade and residual resection status.

                                  median prognostic value as cutoff; there was a significant difference in the 5-year overall survival rate between
                                  the groups (p < 0.001, Fig. 9D).

                                  Discussion
                                  Ovarian cancer has the highest mortality rate among gynecological cancers. It is reported that more than 90%
                                  of OC patients suffer from the EOC subtype. Based on tumor cell histology, EOC is classified as serous (> 50%
                                  of cases), endometrioid, mucinous, clear cell, and others or unspecified. Approximately 60% of OC patients are
                                  diagnosed with late-stage disease due to the lack of early and effective test methods, leading to poor clinical
                                  outcomes. Moreover, the 5-year survival rate has marginally improved in the past decade. Transcription factors
                                  play vital roles in various biological processes including tumorigenesis and drug resistance, and may serve as
                                  biomarkers to predict the prognosis of SOC.
                                      In this study, a 17-TFs related prognostic signature and cluster model was introduced to predict the clinical
                                  outcome of SOC. In detail, 564 SOC patients from the TCGA database were randomly divided into the training
                                  and test cohorts. The 70 SOC patients from GEO were deemed as the external validation set. A 17-TFs related
                                  prognostic signature was obtained in the training cohort by successively performing univariant cox regression
                                  and Lasso cox regression. The 5-year overall survival rate was significantly different between the high-risk and
                                  low-risk score groups. The 17-TFs related prognostic signature showed high prediction performance with a
                                  high AUC value (AUC = 0.803), and this was validated in the test, sum, and GEO cohorts. Genomic alterations

Scientific Reports |   (2021) 11:7207 |               https://doi.org/10.1038/s41598-021-86294-z                                                 7

                                                                                                                                            Vol.:(0123456789)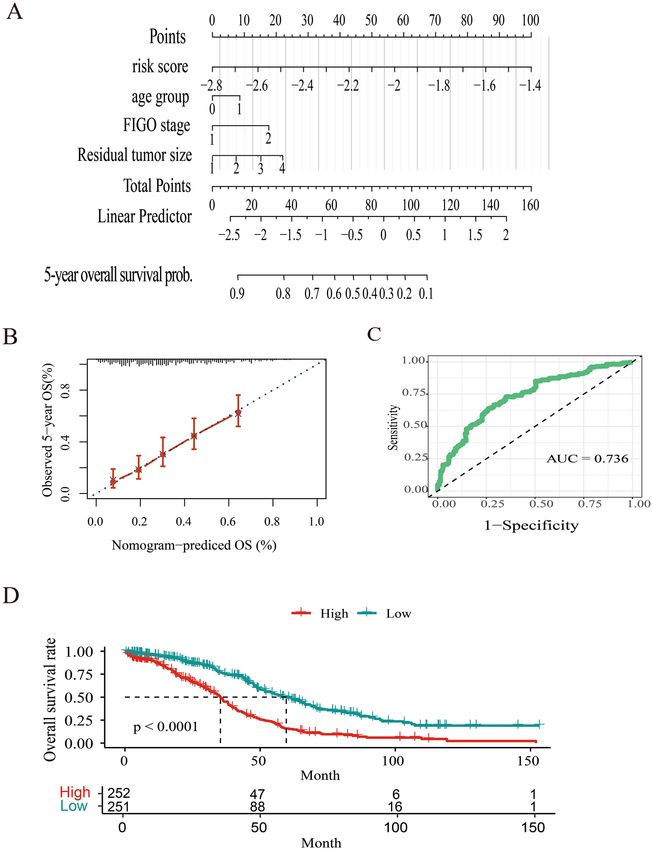
www.nature.com/scientificreports/
Figure 7. Functional annotation of TFs related prognostic signature. (A) GSEA assay to identify the different
pathways between high-risk score group and low-risk score group; (B) GSVA assay to explore the distribution of
risk scores and clinical features (upper), and gene set enrichment of different pathways in GO terms and KEGG
pathways (lower).
assay results showed that the risk score of SOC patients was associated with genomic aberrations. Besides, the
cluster model was constructed using consensus clustering analysis. Consensus clustering analysis is a method
for evaluating two questions: how many groups are present in a dataset, and what is the confidence in the num-
ber of groups and the group memberships. It provides quantitative and visual ‘stability’ evidence derived from
repeated subsampling and clustering and is popular in cancer research. It can not only used in class discovery
but also in identification of disease subtype, immune subtype and molecular subtype. What’s more, it might also
be used in identify new therapeutic targets of disease. It is worth mentioning that consensus clustering analysis
is commonly used in processing single-cell RNA-seq data.
Function annotation was performed using GSEA and GSVA analysis. The GSVA results revealed that the
prognostic TFs were mainly related to the TGF-β, PI3K, mTOR, MAPK, VEGF and Wnt signaling pathways,
which played important roles in cell proliferation, invasion, and migration. The TGF-β signaling pathway, which
participates in immune response, was screened from both GO gene sets and the KEGG pathway. The GSEA
results indicated that there were significant differences in the chronic inflammatory and immune responses
between the high-risk and low-risk score groups. The difference of potential lymphocyte migration, immune
infiltration, immunotherapy, and chemotherapy response between the high-risk score and low-risk score groups
were explored due to the big difference in regulating T cell-mediated cytotoxicity. The distribution of several
immune cells including T cells, B cells, and NK cells were found to be different between the two groups. Moreo-
ver, patients with low-risk scores showed higher response to immunotherapy, especially anti-PD-1 therapy, and
chemotherapy drugs including etoposide, paclitaxel, and veliparib. Finally, a nomogram model was constructed
combined with clinical data and risk scores. The prediction utility was very high with an AUC value of 0.71 in
the TCGA cohort and an AUC value of 0.744 in the GEO cohort. Multiple gene signatures have been developed
to predict overall survival, recurrence, and platinum sensitivity in OC. Some gene signatures were also used to
predict the overall survival outcome in SOC15,24,25. Liu et al. developed a seven gene-based novel signature to
predict clinical outcomes of High-Grade IIIc Serous Ovarian Carcinoma with an AUC of 0.715 in the TCGA
cohort24. A genomic rearrangement signature was constructed in High-Grade Serous Ovarian Cancer (HGSOC)
with an AUC of 0.63 in the TCGA c ohort25. A novel autophagy-related prognostic signature was exploited for
SOC with an AUC of 0.70315. Compared with the mentioned gene signatures, the 17-TFs related prognostic
signature showed basically consistent prediction capacities.
TFs play important roles in various biological processes including cancer proliferation, invasion and migra-
tion, cell cycle, apoptosis, EMT, differentiation, and drug resistance in OC. The 17 TFs, except FOXK2, LHX2,
SPDEF, TRIM38, ZHX3, and ZXDB, were reported to be involved in the malignant phenotype of OC. The CBX5,
a member of chromobox (CBX) family, was suggested to function as a prognostic biomarker and potential target
for various cancers; including gastric cancer, breast cancer, and lung c ancer26–29. The expression of CBX5 was
elevated in gastric cancer tumor tissues and it promoted cell proliferation, migration, and invasion27. It was
highly expressed in breast cancer tissues and correlated to relapse-free survival (RFS) for the patients28. Besides,
Scientific Reports | (2021) 11:7207 | https://doi.org/10.1038/s41598-021-86294-z 8
Vol:.(1234567890)www.nature.com/scientificreports/
Figure 8. Difference between high-risk score group and low-risk score group in immune infiltration,
immunotherapy and chemotherapy response prediction. (A) immune infiltration proportion of TIICs between
high-risk score group and low-risk score group (*p < 0.05; **p < 0.01; ***p < 0.001); (B) the TIDE value and
response to immunotherapy of patients with SOC; (C) the response to anti-CTAL4 and anti-PD-1 therapy
of patients with SOC in both groups; (D) Estimated IC50 values indicate the efficiency of chemotherapy by
etoposide, paclitaxel and veliparib in both groups.
CBX5 was identified as a potential target in regulating lung cancer survival and the stem-like properties of lung
CD133+-tumor stem-like cells (TSLCs)29. It was reported that BRD4 suppression enhanced the cytotoxicity of
CHK1 inhibition in HGSOC, which was mediated by the increased expression of C BX530. The CREB3 marker was
identified as an oncogene that plays an important role in tumor metastasis in various cancers; including prostate
steosarcoma31–33. It is reported that the CREB3 antigen may serve as an effective
cancer, breast cancer, and o
biomarker with high diagnostic sensitivity and specificity in OC, although its prognostic role is u nclear34. The
FOXK2 and FOXJ1 are members of the forkhead box (FOX) transcription factors. Growing evidence shows that
FOXK2 participates in a range of key processes in cancer cells, such as cell proliferation, invasion and migration,
DNA damage, and a utophagy35. The function of FOXK2 is context and tumor-specific, and it might serve as an
oncogene and tumor suppressor in different c ancers36. It was reported that FOXK2 inhibited cell proliferation
and invasion in breast cancer, non-small cell lung cancer (NSCLC), clear-cell renal cell carcinoma, gastric cancer,
Scientific Reports | (2021) 11:7207 | https://doi.org/10.1038/s41598-021-86294-z 9
Vol.:(0123456789)www.nature.com/scientificreports/
Figure 9. Prognostic nomogram for predicting the 5-year overall survival of SOC patients. (A) Prognostic
nomogram for glioma patients was created based on clinical risk factors; For age group, 0 means < 50 years
old and 1 means > 50 years old. For FIGO stage, 1 means FIGO I + II and 2 means FIGO III + IV. For residual
tumor size, 1 means residual tumor size < 1 mm; 2 means 1 mm < residual tumor size < 10 mm; 3 means
10 mm < residual tumor size < 20 mm and 4 means residual tumor size > 20 mm. (B) The calibration curve of
5-year overall survival. The predicted probability of overall survival is plotted on the x-axis and the observed
OS is plotted on the y-axis; (C) ROC curve from the nomogram of 5-year overall survival; (D) Comparison of
overall survival between two groups divided by the median value of the prognostic model (Low vs. High).
and indicated favorable p rognosis37–40. However, it promoted cell growth and indicated unfavorable prognosis in
colorectal cancer and hepatocellular c arcinoma41,42. The role of FOXK2 in OC is currently unknown. Meanwhile,
FOXJ1, negatively regulated by NANOG, exerts anti-cancer proliferation, migration, and invasion activity in
OC43. Mainly expressed in plasma cells, IRF4 was reported to be associated with tumor stage, histological grade,
and completeness of c hemotherapy44. Multiple evidence has shown that TEAD1 and TFAM are oncogenes in OC,
which is concordant with our r esults45,46. The role of ZNF124 in OC is little known, but it was found to inhibit
apoptotic death and function as an oncogene in hematopoietic c ells47. The pRB protein, coded by the RB1 gene,
is a famed tumor suppressor in OC, which is similar to our results, and was related to acquired chemotherapy
resistance and OC recurrence48,49. The ectopic expression of TBX2 is associated with conferred resistance to
Scientific Reports | (2021) 11:7207 | https://doi.org/10.1038/s41598-021-86294-z 10
Vol:.(1234567890)www.nature.com/scientificreports/
Univariable analysis Multivariate analysis
Variables HR (95% CI) p value HR (95% CI) p value
Risk score 13.895 (7.637–25.281) < 0.001*** 10.0841 (5.4247–18.7454) < 0.001***
Residual disease (1–10 mm) 2.069 (1.471–2.912) < 0.001*** 1.5889 (1.1173–2.2596) < 0.01**
Residual disease (10–20 mm) 2.3 (1.389–3.809) < 0.001*** 2.0247 (1.2066–3.3974) 0.008**
Residual disease (> 20 mm) 2.829 (1.925–4.157) < 0.001*** 2.0447 (1.3745–3.0415) < 0.001***
Age (< 50 year) 0.646 (0.514–0.813) < 0.001*** 0.7586 (0.6009–0.9578) 0.020*
FIGO stage (III + IV) 2.884 (1.428–5.823) 0.003** 1.7485 (0.8437–3.6237) 0.133
Grade stage (III + IV) 1.297 (0.929–1.81) 0.126 1.0583 (0.7465–1.5003) 0.750
Table 1. Univariable and multivariate cox regression analysis of factors affecting overall survival of SOC
patients. HR, Hazard Ratio; CI, Confidence Interval. * p < 0.05; **p < 0.01; ***p < 0.001.
platinum-based chemotherapy, indicating that it may serve as a predictive marker of the efficacy of platinum-
based chemotherapy for patients with O C50. Recently, STAT2 was identified to be highly expressed in OC, and
the patients involved had poor OS and PFS. It was reported that STAT2 functions as an oncogene by increasing
the expression of EGFR51. Although single biomarker for prognosis has been widely reported, it is difficult to
accurately predict the prognosis of OC patients due to its heterogeneity. As regards the prognostic signature
or nomogram, if we can put it into clinical practice in the future, we may be able to identify SOC patients with
high-risk of cancer-related death before treatment, and recommend a more aggressive therapeutic strategies
with dynamic surveillance.
This study has some limitations: (1) Venous and lymphatic invasion were not considered because the data was
missing for most patients. (2) The sample size in the external validation set was small and the predictive ability
of the 17-TFs related prognostic signature was not validated in the samples.
In conclusion, we obtained a TFs related prognostic signature and constructed a clinical model for predict-
ing prognosis of SOC patients, which was able to effectively distinguish high-risk populations from the TCGA
and GEO datasets.
Methods
Datasets and preprocessing. Gene expression profiles and corresponding clinical information were
downloaded from the TCGA data source (https://xena.ucsc.edu) and the GEO data portal (https://www.ncbi.
nlm.nih.gov/geo/). All TCGA samples were randomly divided into two equal cohort: training cohort (n = 282)
and validation cohort (n = 282). The total TCGA data (n = 564) were used to validate as sum cohort. The GEO
cohort (n = 70) was used as the external validation set. The patients in ICGC cohort (https://daco.icgc.org/)
(n = 115) and Tothill cohort (GSE9899, n = 278) were utilized to explore the association between OS rate and risk
score. The clinical characteristics of all subjects in TCGA database were listed in Supplement Table 1. All eukary-
otic TFs were downloaded from MSigDB (http://software.broadinstitute.org/gsea/msigdb/genefamilies.jsp).
L1‑penalized (Lasso) cox regression. A robust likelihood-based survival modeling was applied to
reduce the dimension and obtain robust survival-associated TFs. The Lasso regression was used to identify the
TFs with independent prognostic value. Through 5000 cross-validations, a set of prognostic genes and their
LASSO coefficients were obtained according to the highest lambda value, using the Lasso method (lambda 1st)
with tenfold cross-validation. Based on the LASSO coefficients, we established a TFs-related prognostics risk
score model52. The association between risk score, TFs expression and clinical characters was illustrated by heat
maps.
Time‑dependent Receiver operating characteristic (ROC). Time-dependent ROC curve and area
under the curve (AUC) were applied to evaluate the prediction accuracy of the five-year prognostic model in
the training, test, sum, and GEO cohorts. Besides, it was also used to estimate the prediction performance of the
nomogram. All the time-dependent ROC curves were calculated by SurvivalROC package and drew by ggplot2
package.
Overall survival analysis. The SOC patients were divided into high-risk and low-risk score groups accord-
ing to the median TFs related prognostic signature or median TFs mRNA expression. Survival curves were illus-
trated by the Kaplan–Meier method with the long-rank test. The overall survival rate of high and low clusters was
also calculated. Furthermore, stratified survival analyses were performed based on different ages, FIGO stage,
tumor grade, and residual tumor size.
Genetic alterations analysis. Genetic alterations including somatic mutations and somatic copy number
alterations (SCNAs) were investigated. All the samples obtained from the TCGA database were divided into
four groups based on the values of the TFs-related prognostic signature and risk score. The Top 20 genes with
the highest mutation frequency in the lowest and highest group were selected. The SCNAs of both groups were
identified using the Genomic Identification of Significant Targets in Cancer 2.0 (GISTIC)53.
Scientific Reports | (2021) 11:7207 | https://doi.org/10.1038/s41598-021-86294-z 11
Vol.:(0123456789)www.nature.com/scientificreports/
Gene set enrichment analysis (GSEA). The GSEA annotation was adopted using the “clusterProfiler”
package, to identify potential differences in biological function between SOC patients with high-risk and low-
risk scores54.
Consensus clustering analysis. Samples were divided into different clusters using consensus clustering
analysis with the R package “ConsensusClusterPlus”55. The subsampling parameter was 80% with 1000 times and
k (the number of clusters) ranged from 2 to 10. The optimal number of clusters was selected based on cumulative
distribution function plots and consensus m atrices56. Clinical features and different expressions of TFs between
clusters were visualized by heat maps.
Gene set variation analysis (GSVA). The 17-TFs signature for each SOC sample was established using
gene sets enrichment analysis (GSVA). The heat map was used to illustrate the correlation between the 17-TFs,
their mRNA expression and the clinical features of SOC. The GSVA package was utilized to reveal the func-
tional enrichment status of these TFs in SOC. The cutoff of the Correlation coefficient was set as 0.5 (p < 0.05)57.
Gene Ontology (GO) terms, Kyoto Encyclopedia of Genes and Genomes (KEGG) pathways were obtained from
MSigDB58.
Immune infiltration, immunotherapy and chemotherapy response prediction. The infiltration
of 22 subtypes of tumor-infiltrating immune cells (TIICs) was calculated by CIBERSORT algorithm (http://ciber
sort.stanford.edu/), which is a method for characterizing cell composition of complex tissues from their gene
expression profiles59.
Tumor Immune Disfunction and Exclusion (TIDE) algorithm (http://tide.dfci.harvard.edu/) is a computa-
tional method to accurately outcome of patients treating with immune checkpoint blockade (ICB)60. To better
understand the immune response function of TFs in SOC, TIDE was employed to estimate the individual likeli-
hood of responding to immunotherapy. There are currently no approved immune therapies for ovarian cancer.
Therefore, the response to anti-CTAL-4 or anti-PD-1 therapy was analyzed based on the treatment results of
melanoma patients in the subclass mapping method (SubMap, http://www.broad.mit.edu/genepattern/) 61.
The chemotherapy response of each patient was evaluated using the Genomics of Drug Sensitivity in Can-
cer database (GDSC, https://www.cancerrxgene.org). Drugs that are used for SOC treatment were selected for
assessment. The half-maximal inhibitory concentration (IC50) was calculated and represented the drug response.
The R package ‘pRRopheticRredic’ was used with tenfold cross-validation and other parameters by d efault62.
Prognostic Model construction based on clinical features and risk score. Univariate cox pro-
portional hazard regression analysis was performed to select risk factors (p < 0.05). A multivariate COX model
based on the selected features and the nomogram chart was constructed using the “RMS” in R software to pre-
dict 5-year overall survival63. The accuracy of the risk model was assessed using the calibration curve and AUC.
Finally, the risk score value was calculated according to the formula, risk score = β1X1 + β2X2 + ⋯ + βnXn (β,
regression coefficient; X, prognostic factors).
Statistical analysis. All statistical analyses were performed using R software (version 3·5·3). Significant
quantitative differences between groups were analyzed using the two‐tailed Students’ t-test, whereas differences
among groups were analyzed using the one‐way ANOVA. The chi-square test was used to analyze the clinical
features of different cohorts. Kaplan–Meier method with log-rank test was used to calculate the overall sur-
vival rate of SOC patients. Univariate and multivariate Cox regression analyses were performed to evaluate the
prognostic value of the risk score and clinical features. The partition around medoids (PAM) algorithm was
conducted in the consensus clustering analysis. The correlation between two variables was analyzed with Spear-
man rank (p < 0.05).
Received: 15 October 2020; Accepted: 12 March 2021
References
1. Miller, K. D. et al. Cancer treatment and survivorship statistics, 2019. CA Cancer J. Clin. 69, 363–385. https://d oi.o
rg/1 0.3 322/c aac.
21565 (2019).
2. Torre, L. A. et al. Ovarian cancer statistics, 2018. CA Cancer J. Clin. 68, 284–296. https://doi.org/10.3322/caac.21456 (2018).
3. Holmes, D. The problem with platinum. Nature 527, S218-219. https://doi.org/10.1038/527S218a (2015).
4. Huang, J., Hu, W. & Sood, A. K. Prognostic biomarkers in ovarian cancer. Cancer Biomark. Sect. A Dis. Mark. 8, 231–251. https://
doi.org/10.3233/cbm-2011-0212 (2010).
5. Makar, A. P. et al. Prognostic value of pre- and postoperative serum CA 125 levels in ovarian cancer: new aspects and multivariate
analysis. Obstet. Gynecol. 79, 1002–1010 (1992).
6. Han, L. Y. et al. Doubling time of serum CA125 is an independent prognostic factor for survival in patients with ovarian cancer
relapsing after first-line chemotherapy. Eur. J. Cancer (Oxford, England: 1990) 46, 1359–1364. https://doi.org/10.1016/j.ejca.2010.
02.012 (2010).
7. Ben David, Y. et al. Effect of BRCA mutations on the length of survival in epithelial ovarian tumors. J. Clin. Oncol. Off. J. Am. Soc.
Clin. Oncol. 20, 463–466. https://doi.org/10.1200/jco.2002.20.2.463 (2002).
8. Krzystyniak, J., Ceppi, L., Dizon, D. S. & Birrer, M. J. Epithelial ovarian cancer: the molecular genetics of epithelial ovarian cancer.
Ann. Oncol. 27(Suppl 1), i4–i10. https://doi.org/10.1093/annonc/mdw083 (2016).
Scientific Reports | (2021) 11:7207 | https://doi.org/10.1038/s41598-021-86294-z 12
Vol:.(1234567890)www.nature.com/scientificreports/
9. Hentze, J. L., Høgdall, C. K. & Høgdall, E. V. Methylation and ovarian cancer: can DNA methylation be of diagnostic use?. Mol.
Clin. Oncol. 10, 323–330. https://doi.org/10.3892/mco.2019.1800 (2019).
10. Singh, A., Gupta, S. & Sachan, M. Epigenetic biomarkers in the management of ovarian cancer: current prospectives. Front. Cell
Dev. Biol. 7, 182. https://doi.org/10.3389/fcell.2019.00182 (2019).
11. Llauradó, M. et al. MicroRNAs as prognostic markers in ovarian cancer. Mol. Cell. Endocrinol. 390, 73–84. https://doi.org/10.
1016/j.mce.2014.03.006 (2014).
12. Luo, P. et al. Prognostic value of abnormally expressed lncRNAs in ovarian carcinoma: a systematic review and meta-analysis.
Oncotarget 8, 23927–23936. https://doi.org/10.18632/oncotarget.14760 (2017).
13. Wheeler, L. J. et al. Multi-omic approaches identify metabolic and autophagy regulators important in ovarian cancer dissemination.
iScience 19, 474–491. https://doi.org/10.1016/j.isci.2019.07.049 (2019).
14. Kossaï, M., Leary, A., Scoazec, J. Y. & Genestie, C. Ovarian cancer: a heterogeneous disease. Pathobiol. J. Immunopathol. Mol. Cell.
Biol. 85, 41–49. https://doi.org/10.1159/000479006 (2018).
15. An, Y., Bi, F., You, Y., Liu, X. & Yang, Q. Development of a novel autophagy-related prognostic signature for serous ovarian cancer.
J. Cancer 9, 4058–4071. https://doi.org/10.7150/jca.25587 (2018).
16. Sun, H. et al. Identification of a prognostic signature associated with DNA repair genes in ovarian cancer. Front. Genet. 10, 839.
https://doi.org/10.3389/fgene.2019.00839 (2019).
17. Chen, F. & Liu, N. A 10-gene expression signature of Notch pathway predicts recurrence in ovarian carcinoma. Oncol. Lett. 10,
1704–1708. https://doi.org/10.3892/ol.2015.3382 (2015).
18. Guo, W. et al. A five-DNA methylation signature act as a novel prognostic biomarker in patients with ovarian serous cystadeno-
carcinoma. Clin. Epigenet. 10, 142. https://doi.org/10.1186/s13148-018-0574-0 (2018).
19. Li, L. et al. Integrative network analysis reveals a MicroRNA-based signature for prognosis prediction of epithelial ovarian cancer.
Biomed. Res. Int. 2019, 1056431. https://doi.org/10.1155/2019/1056431 (2019).
20. Zhang, Y. et al. Recurrence-associated multi-RNA signature to predict disease-free survival for ovarian cancer patients. Biomed.
Res. Int. 2020, 1618527. https://doi.org/10.1155/2020/1618527 (2020).
21. Wei, W. et al. A computed tomography-based radiomic prognostic marker of advanced high-grade serous ovarian cancer recur-
rence: a multicenter study. Front. Oncol. 9, 255. https://doi.org/10.3389/fonc.2019.00255 (2019).
22. Sirotkin, A. V. Transcription factors and ovarian functions. J. Cell. Physiol. 225, 20–26. https://doi.org/10.1002/jcp.22248 (2010).
23. Safe, S., Abbruzzese, J., Abdelrahim, M. & Hedrick, E. Specificity protein transcription factors and cancer: opportunities for drug
development. Cancer Prev. Res. (Philadelphia, Pa) 11, 371–382. https://doi.org/10.1158/1940-6207.capr-17-0407 (2018).
24. Liu, G. et al. Seven genes based novel signature predicts clinical outcome and platinum sensitivity of high grade IIIc serous ovarian
carcinoma. Int. J. Biol. Sci. 14, 2012–2022. https://doi.org/10.7150/ijbs.28249 (2018).
25. Hillman, R. T., Chisholm, G. B., Lu, K. H. & Futreal, P. A. Genomic rearrangement signatures and clinical outcomes in high-grade
serous ovarian cancer. J. Natl. Cancer Inst. 110, 265–272. https://doi.org/10.1093/jnci/djx176 (2018).
26. Claerhout, S. et al. Gene expression signature analysis identifies vorinostat as a candidate therapy for gastric cancer. PLoS ONE 6,
e24662. https://doi.org/10.1371/journal.pone.0024662 (2011).
27. Guo, J., Zhang, Z., Pan, L. & Zhou, Y. Identification of miR-758-3p as potential modulator of CBX5 expression in gastric cancer.
Technol. Cancer Res. Treat. 17, 1533033818816061. https://doi.org/10.1177/1533033818816061 (2018).
28. Liang, Y. K., Lin, H. Y., Chen, C. F. & Zeng, D. Prognostic values of distinct CBX family members in breast cancer. Oncotarget 8,
92375–92387. https://doi.org/10.18632/oncotarget.21325 (2017).
29. Yu, Y. H. et al. Network biology of tumor stem-like cells identified a regulatory role of CBX5 in lung cancer. Sci. Rep. 2, 584. https://
doi.org/10.1038/srep00584 (2012).
30. Pongas, G. et al. BRD4 facilitates DNA damage response and represses CBX5/heterochromatin protein 1 (HP1). Oncotarget 8,
51402–51415. https://doi.org/10.18632/oncotarget.17572 (2017).
31. Kim, Y., Kim, J., Jang, S. W. & Ko, J. The role of sLZIP in cyclin D3-mediated negative regulation of androgen receptor transactiva-
tion and its involvement in prostate cancer. Oncogene 34, 226–236. https://doi.org/10.1038/onc.2013.538 (2015).
32. Howley, B. V., Link, L. A., Grelet, S., El-Sabban, M. & Howe, P. H. A CREB3-regulated ER-Golgi trafficking signature promotes
metastatic progression in breast cancer. Oncogene 37, 1308–1325. https://doi.org/10.1038/s41388-017-0023-0 (2018).
33. Wu, Y. et al. Circular RNA circTADA2A promotes osteosarcoma progression and metastasis by sponging miR-203a-3p and regu-
lating CREB3 expression. Mol. Cancer 18, 73. https://doi.org/10.1186/s12943-019-1007-1 (2019).
34. Antony, F. et al. High-throughput assessment of the antibody profile in ovarian cancer ascitic fluids. Oncoimmunology 8, e1614856.
https://doi.org/10.1080/2162402x.2019.1614856 (2019).
35. Chen, Y. et al. CHK2-FOXK axis promotes transcriptional control of autophagy programs. Sci. Adv. 6, eaax5819. https://doi.org/
10.1126/sciadv.aax5819 (2020).
36. Nestal de Moraes, G., Carneiro, L. D. T., Maia, R. C., Lam, E. W. & Sharrocks, A. D. FOXK2 transcription factor and its emerging
roles in cancer. Cancers https://doi.org/10.3390/cancers11030393 (2019).
37. Shan, L. et al. FOXK2 elicits massive transcription repression and suppresses the hypoxic response and breast cancer carcinogenesis.
Cancer Cell 30, 708–722. https://doi.org/10.1016/j.ccell.2016.09.010 (2016).
38. Chen, S. et al. Foxk2 inhibits non-small cell lung cancer epithelial-mesenchymal transition and proliferation through the repres-
sion of different key target genes. Oncol. Rep. 37, 2335–2347. https://doi.org/10.3892/or.2017.5461 (2017).
39. Zhang, F. et al. FOXK2 suppresses the malignant phenotype and induces apoptosis through inhibition of EGFR in clear-cell renal
cell carcinoma. Int. J. Cancer 142, 2543–2557. https://doi.org/10.1002/ijc.31278 (2018).
40. Liu, X. et al. Downregulation of FOXK2 is associated with poor prognosis in patients with gastric cancer. Mol. Med. Rep. 18,
4356–4364. https://doi.org/10.3892/mmr.2018.9466 (2018).
41. Du, F. et al. Forkhead box K2 promotes human colorectal cancer metastasis by upregulating ZEB1 and EGFR. Theranostics 9,
3879–3902. https://doi.org/10.7150/thno.31716 (2019).
42. Lin, M. F. et al. FOXK2, regulted by miR-1271-5p, promotes cell growth and indicates unfavorable prognosis in hepatocellular
carcinoma. Int. J. Biochem. Cell Biol. 88, 155–161. https://doi.org/10.1016/j.biocel.2017.05.019 (2017).
43. Siu, M. K. et al. Stem cell transcription factor NANOG controls cell migration and invasion via dysregulation of E-cadherin and
FoxJ1 and contributes to adverse clinical outcome in ovarian cancers. Oncogene 32, 3500–3509. https://doi.org/10.1038/onc.2012.
363 (2013).
44. Heimes, A. S. et al. A retrospective analysis of immunohistochemically determined IRF4 (interferon regulating factor 4) expression
in a consecutive cohort of 114 ovarian cancer patients. Arch. Gynecol. Obstet. 299, 239–246. https://doi.org/10.1007/s00404-018-
4941-z (2019).
45. Zhou, Y. et al. The TEAD family and its oncogenic role in promoting tumorigenesis. Int. J. Mol. Sci. https://doi.org/10.3390/ijms1
7010138 (2016).
46. Signorile, A. et al. Human ovarian cancer tissue exhibits increase of mitochondrial biogenesis and cristae remodeling. Cancers
https://doi.org/10.3390/cancers11091350 (2019).
47. Kuramoto, K. et al. ZK7, a novel zinc finger gene, is induced by vascular endothelial growth factor and inhibits apoptotic death in
hematopoietic cells. Can. Res. 60, 425–430 (2000).
48. Patch, A. M. et al. Whole-genome characterization of chemoresistant ovarian cancer. Nature 521, 489–494. https://doi.org/10.
1038/nature14410 (2015).
Scientific Reports | (2021) 11:7207 | https://doi.org/10.1038/s41598-021-86294-z 13
Vol.:(0123456789)www.nature.com/scientificreports/
49. Du, Z. H., Bi, F. F., Wang, L. & Yang, Q. Next-generation sequencing unravels extensive genetic alteration in recurrent ovarian
cancer and unique genetic changes in drug-resistant recurrent ovarian cancer. Mol. Genet. Genom. Med. 6, 638–647. https://doi.
org/10.1002/mgg3.414 (2018).
50. Tasaka, R. et al. TBX2 expression is associated with platinum-sensitivity of ovarian serous carcinoma. Oncol. Lett. 15, 3085–3090.
https://doi.org/10.3892/ol.2017.7719 (2018).
51. Chen, X., Huang, J. & Lü, Y. High expression of STAT2 in ovarian cancer and its effect on metastasis of ovarian cancer cells. Nan
fang yi ke da xue xue bao J. Southern Med. Univ. 40, 34–41. https://doi.org/10.12122/j.issn.1673-4254.2020.01.06 (2020).
52. Goeman, J. J. L1 penalized estimation in the Cox proportional hazards model. Biomet. J. Biomet. Z. 52, 70–84. https://doi.org/10.
1002/bimj.200900028 (2010).
53. Mermel, C. H. et al. GISTIC2.0 facilitates sensitive and confident localization of the targets of focal somatic copy-number alteration
in human cancers. Genome Biol. 12, 41. https://doi.org/10.1186/gb-2011-12-4-r41 (2011).
54. Subramanian, A. et al. Gene set enrichment analysis: a knowledge-based approach for interpreting genome-wide expression
profiles. Proc. Natl. Acad. Sci. USA 102, 15545–15550. https://doi.org/10.1073/pnas.0506580102 (2005).
55. Wilkerson, M. D. & Hayes, D. N. ConsensusClusterPlus: a class discovery tool with confidence assessments and item tracking.
Bioinformatics (Oxford, England) 26, 1572–1573. https://doi.org/10.1093/bioinformatics/btq170 (2010).
56. Datta, S. & Datta, S. Comparisons and validation of statistical clustering techniques for microarray gene expression data. Bioin-
formatics (Oxford, England) 19, 459–466. https://doi.org/10.1093/bioinformatics/btg025 (2003).
57. Hanzelmann, S., Castelo, R. & Guinney, J. GSVA: gene set variation analysis for microarray and RNA-seq data. BMC Bioinform.
14, 7. https://doi.org/10.1186/1471-2105-14-7 (2013).
58. Liberzon, A. et al. The molecular signatures database (MSigDB) hallmark gene set collection. Cell Syst. 1, 417–425. https://doi.
org/10.1016/j.cels.2015.12.004 (2015).
59. Newman, A. M. et al. Robust enumeration of cell subsets from tissue expression profiles. Nat. Methods 12, 453–457. https://doi.
org/10.1038/nmeth.3337 (2015).
60. Jiang, P. et al. Signatures of T cell dysfunction and exclusion predict cancer immunotherapy response. Nat. Med. 24, 1550–1558.
https://doi.org/10.1038/s41591-018-0136-1 (2018).
61. Roh, W. et al. Integrated molecular analysis of tumor biopsies on sequential CTLA-4 and PD-1 blockade reveals markers of response
and resistance. Sci. Transl. Med. https://doi.org/10.1126/scitranslmed.aah3560 (2017).
62. Geeleher, P., Cox, N. J. & Huang, R. S. Clinical drug response can be predicted using baseline gene expression levels and in vitro
drug sensitivity in cell lines. Genome Biol. 15, R47. https://doi.org/10.1186/gb-2014-15-3-r47 (2014).
63. Nick, T. G. & Hardin, J. M. Regression modeling strategies: an illustrative case study from medical rehabilitation outcomes research.
Am. J. Occup. Therapy Off. Publ. Am. Occup. Therapy Assoc. 53, 459–470. https://doi.org/10.5014/ajot.53.5.459 (1999).
Acknowledgements
We would like to thank Dr. Quan Cheng for the bioinformatics technology support.
Author contributions
H.L., Q.C. and J.W. designed the idea and wrote the manuscript. N.Y.Y.W., Z.Y.L. and Y.C.C. contributed the data
collection and analysis. Q.C. provided analysis tools. All authors revised the manuscript and gave approval for
the version of the manuscript to be published.
Funding
This research was supported by the National Natural Science Foundation of China (NO.81972836) and National
Key R&D Program (2016YFC1303703).
Competing interests
The authors declare no competing interests.
Additional information
Supplementary Information The online version contains supplementary material available at https://doi.org/
10.1038/s41598-021-86294-z.
Correspondence and requests for materials should be addressed to Q.C. or J.W.
Reprints and permissions information is available at www.nature.com/reprints.
Publisher’s note Springer Nature remains neutral with regard to jurisdictional claims in published maps and
institutional affiliations.
Open Access This article is licensed under a Creative Commons Attribution 4.0 International
License, which permits use, sharing, adaptation, distribution and reproduction in any medium or
format, as long as you give appropriate credit to the original author(s) and the source, provide a link to the
Creative Commons licence, and indicate if changes were made. The images or other third party material in this
article are included in the article’s Creative Commons licence, unless indicated otherwise in a credit line to the
material. If material is not included in the article’s Creative Commons licence and your intended use is not
permitted by statutory regulation or exceeds the permitted use, you will need to obtain permission directly from
the copyright holder. To view a copy of this licence, visit http://creativecommons.org/licenses/by/4.0/.
© The Author(s) 2021
Scientific Reports | (2021) 11:7207 | https://doi.org/10.1038/s41598-021-86294-z 14
Vol:.(1234567890)You can also read