DireXeno - an apparatus for measuring correlated scintillation signatures in Liquid Xenon
←
→
Page content transcription
If your browser does not render page correctly, please read the page content below
Prepared for submission to JINST

                                                  DireXeno - an apparatus for measuring
                                                  correlated scintillation signatures in Liquid
                                                  Xenon

                                                  R. Itay,a,b,1 P. Z. Szabo,a G. Koltman,a M.M. Devi,a,c M. Shutman,a H. Landsman,a R.
                                                  Budnika,d
arXiv:1909.08197v2 [physics.ins-det] 1 Jun 2020

                                                  a Department   of Particle Physics and Astrophysics Weizmann Institute of Science,
                                                    Herzel St. Rehovot, 7610001, Israel
                                                  b SLAC National Accelerator Laboratory,

                                                    Sand Hill Rd. Menlo Park, Ca, 94025, USA
                                                  c Department of Physics, Tezpur University,

                                                    Tezpur University Rd., Assam, 784028, India
                                                  d Department of Physics and Astronomy, Simons Centnter for Geometry and Physics and C. M.

                                                    Yang Institute for theoretical physics. Stony Brook NY, 11794, USA
                                                   E-mail: ranitay@stanford.edu

                                                  Abstract: We present a detector apparatus, DireXeno (DIREctional XENOn), designed
                                                  to measure the spatial and temporal properties of scintillation in liquid xenon to very
                                                  high accuracy. The properties of scintillation are of primary importance for dark matter
                                                  and neutrinoless double beta decay experiments; however the complicated microphysics
                                                  involved limits theoretical predictions. We will explore the possibility that scintillation
                                                  emission exhibits spatial correlations such as super-radiance which manifests in temporal
                                                  and spatial structure, depending on the interaction type. Such properties of scintillation light
                                                  may open a new window for background rejection as well as directionality measurements.
                                                  We present the apparatus’ technical design and the concepts driving it. We demonstrate
                                                  that for an energy deposition of ∼ 2.5 keV (∼ 7.5 keV) electron (nuclear) recoil the detector
                                                  is sensitive to an anisotropy fraction of as little as ∼ 20% of the total photons emitted over
                                                  a solid angle of ∼ 0.85 steradian or less. We show results from commissioning runs in
                                                  which the detector operated with 17 PMTs for over 44 days in stable conditions. The time
                                                  resolution for individual photons in different PMTs was measured to be . 1.4 ns full-width
                                                  at half-maximum

                                                  Keywords: Cryogenic detectors, Ionization and excitation processes, Liquid detectors,
                                                  Noble liquid detectors (scintillation, ionization, double-phase), Dark Matter detectors,
                                                  Scintillators, scintillation and light emission processes (solid, gas and liquid scintillators)

                                                     1Corresponding author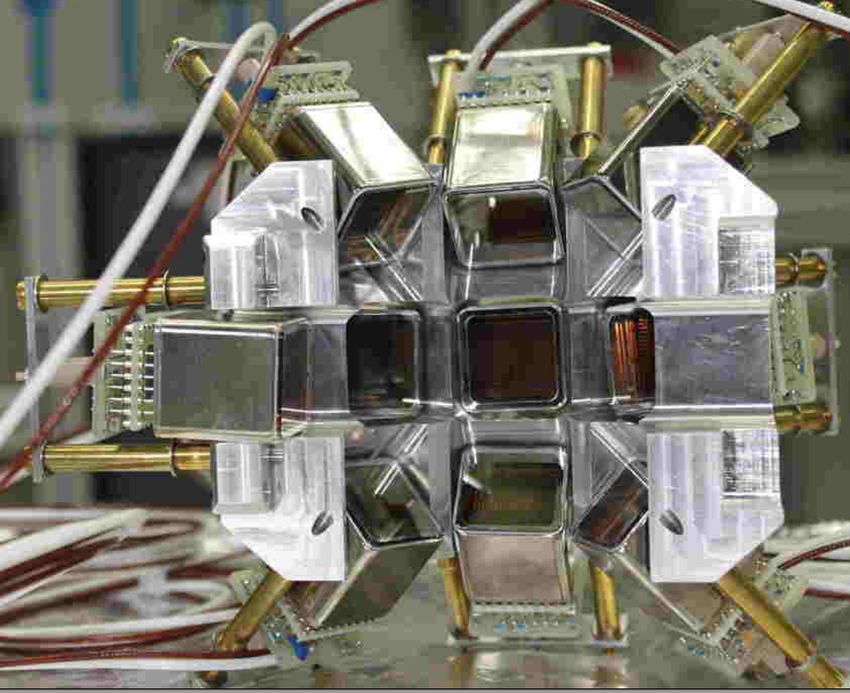
Contents
1   Introduction                                                                            1

2   Experiment Setup                                                                        3
    2.1 Gas Handling                                                                        4
    2.2 Cryogenics                                                                          5
    2.3 The Detector                                                                        7
    2.4 Data Acquisition                                                                   10
    2.5 Slow Control                                                                       11

3   Optical Properties of the Sphere                                                       12

4   Detector Sensitivity                                                                   13

5   Experiment Operation                                                                   16
    5.1 Operation Cycle                                                                    16
    5.2 Cryogenic Stability                                                                16

6   First Measurements                                                                     17
    6.1 Basic Analysis                                                                     18
    6.2 Gain Calibration                                                                   19
    6.3 Temporal Calibration & Resolution                                                  20
    6.4 Scintillation Spectrum & Light Yield                                               20

7   Summary                                                                                22

8   Acknowledgment                                                                         23

1   Introduction
Noble-Liquid detectors have gained popularity over the past decades. Specifically, liquid
xenon (LXe) is widely used as the target material in dark matter (DM) direct detection
and neutrino-less double beta-decay (0ν ββ) experiments. The scintillation light and the
ionization electrons produced in an interaction are used to reconstruct the recoil energy, the
interaction location, and to discriminate between nuclear recoils (NR) and electron recoils
(ER) [1–5]. Some experiments use a dual phase time projection chamber (TPC) based
detector that measures both the xenon ionization and scintillation signals, and may thus
provides better location reconstruction and ER/NR discrimination.

                                            –1–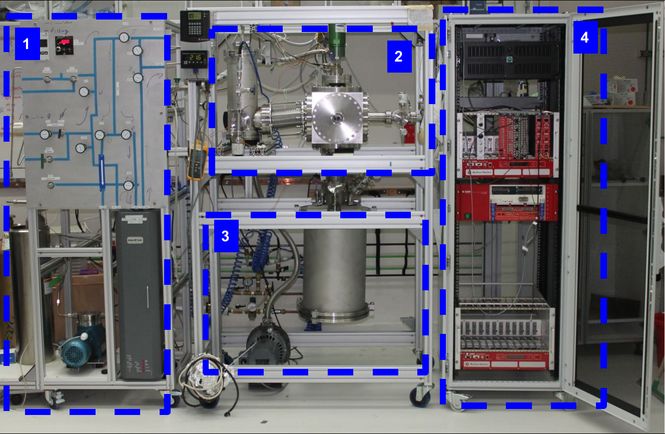
The current primary backgrounds in LXe TPCs are ERs from γ and β emission by
residual radioactivity in the detector and its environment. This includes both impurities
in the LXe and radioactive isotopes in the material that constructs the detector. The next
generation of DM experiments is planned to be sensitive enough to reach the neutrino floor
[6, 7], where neutrinos from various sources produce a substantial rate of irreducible NR
background with respect to the expected signal rate.
     When a particle interacts with the LXe it produces a recoil electron or nucleus. The
recoiling particle forms a set of excited xenon atoms (Xe∗ , exciton) and electron-ion pairs
(Xe+ + e− ). Excitons form excited dimer states (Xe∗2 , excimer) through interaction with
neighbouring xenon atoms, and these excimers emit VUV light (hν) when they decay from
the lowest excited molecular state to the dissociative ground state,

                              Xe∗ + Xe → Xe∗2 → 2Xe + hν.                               (1.1)

Some of the ionized atoms and free electrons recombine to form excitons,

                              Xe+ + Xe → Xe+2
                              Xe+2 + e− → Xe∗∗
                                                                                        (1.2)
                              Xe∗∗ → Xe∗ + heat
                              Xe∗ + Xe → Xe∗2 → 2Xe + hν,

and the decay of the resulting excimers also contributes to the VUV emission [8].
     The scintillation spectrum has a Gaussian shape centered at a wavelength of 175 nm
with a 10 nm full-width at half-maximum (FWHM) [9]. The excimers have two decay
components with different temporal structure, one from the singlet and the other from the
triplet state. In the absence of an external electric field, ER induced excimer production by
recombination (eq. 1.2) dominates over the singlet and triplet emission with a decay time
of ∼ 45 ns. For NRs the recombination process is very fast, less then 1 ns, and both the
singlet and triplet components can be observed. The singlet state decay time is ∼(2 - 4) ns,
and the triplet state decay time is ∼(24 -27) ns [10].
     The phenomenon of spontaneous phase-locking of atomic dipoles in an excited sample,
known as super-radiance (SR) [11], opens new prospects for background rejection in liquid
xenon detectors. SR occurs when the excited sample size is smaller than the radiation
wavelength, such that the photon emission cannot be assigned to a specific emitter in the
sample. In ordinary radiance from an excited sample of atoms the emission pattern is
isotropic, the decay time is exponential with a characteristic time τR , and the intensity is
proportional to the number of emitters (IR ∼ N); in SR the excited sample radiates coherently
(ISR ∼ N2 ) much faster (τSR ∼ τR /N) and the radiation is enhanced in the direction of the
longest dimension of the sample. It has been shown by simulations that the typical size
of NR events is O(100 nm) [12] which is smaller than the xenon radiation wavelength
(∼175 nm). The expected size of the excimer cloud for ER is ∼700 nm [13]; moreover,
in the absence of external electric field the ER emission time structure is dominated by

                                           –2–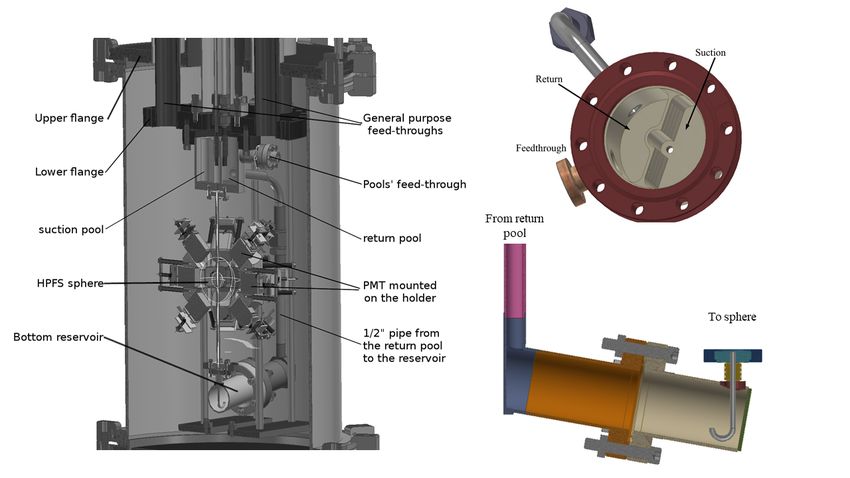
recombination which further reduces the probability for SR and thus SR may be an identifier
of NR.
The directionality of the SR emission holds a potential for the rejection of the ir-
reducible neutrino background, which poses a challenge for future experiments. The
directions of the NRs induced by solar neutrinos are peaked in the direction away from the
Sun, while the diffuse Supernovae and atmospheric neutrinos NRs are isotropic [14, 15].
The directions of DM induced NRs are peaked opposite to the direction of the solar sys-
tem velocity vector around the center of the Milky Way and result in a forward-backward
asymmetry in the recoil rates in the Galactic reference frame [16]. No known background
can mimic this signal, and the directional signal is widely held to be the cleanest expected
signature of Galactic DM.
Early studies of macroscopic ionization using high energy-density electron beams
showed that scintillation from LXe produces a coherent amplification of light [17]. How-
ever, SR emission from a sample excited by a single particle is yet to be explored. In this
paper we present the set-up of an experiment called DireXeno (DIREctional XENOn),
specifically designed to measure the spatial and temporal distribution of LXe scintillation
light from a localized event.
2 Experiment Setup
In the heart of DireXeno lies a small spherical cavity inside a thick sphere made of high
purity fused silica (HPFS). LXe is circulated through the cavity and serves as a uniform
excitation-target. The sphere is surrounded by 20 photomultiplier tubes (PMTs) facing its
center, allowing spatial and temporal measurements of individual photons. The geometry
of the detector approximates a point source of scintillation photons, so detailed vertex
reconstruction inside the LXe is unnecessary. A schematic view of this system is shown in
figure 1.
The system is designed to achieve ∼ 1 ns synchronization between PMTs, and ∼ 0.5 sr
angular resolution. Since the nature and magnitude of SR in LXe are yet unknown, the
guiding principles of the design were flexibility and versatility. Any part of the system can
be redesigned or upgraded to fulfill future experimental requirements without changing
the rest of the system. The modular design also allows fast and easy recovery in case
components malfunction.
DireXeno is made of five main building blocks: (i) the gas handling system provides
a xenon filling and recovery port, circulates the xenon and purifies it; (ii) the cryogenic
system liquefies the xenon and delivers it to the detector; (iii) the detector assembly holds
the HPFS sphere and the PMTs around it; (iv) the data acquisition system (DAQ) supplies
high voltage to the PMTs and handles triggering and digitization of data; and (v) the slow
control system (SC) monitors the condition of the experiment using various sensors and
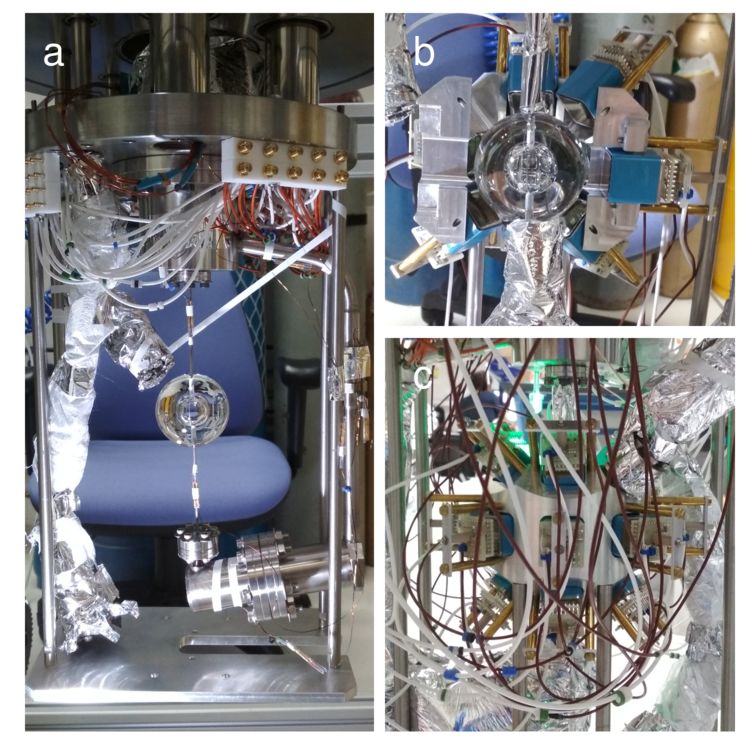
gauges. The entire assembly is held on three separate racks as shown in figure 2.
–3–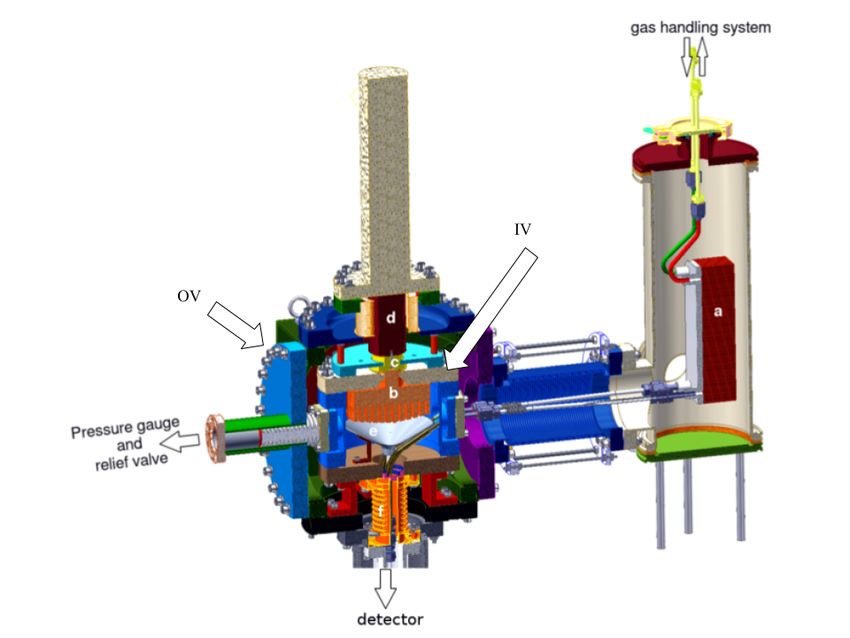
Figure 1. A schematic view of DireXeno. The slow control parts are distributed around all
subsystems

2.1     Gas Handling

In LXe detectors which measure the ionization electrons the desired level of impurity
concentration is 1 ppb O2 equivalent or better [1, 18]. In order for the LXe to reach
this level of purity, continuous purification is required. In DireXeno only the prompt
scintillation is measured, so such a high level of purification is not necessary. Nonetheless,
this capability along with filling, circulation and recovery of xenon is provided by the gas
handling system.
     During purification, a circulation pump1 extracts LXe from the detector assembly
through a heat exchanger2, where it is heated and vaporized. The xenon then passes
through a Mass Flow Controller3 (MFC) that can regulate the heat flux into the system
and pumped into a hot getter4 that removes residual carbon, nitrogen, water and other
oxygen based impurities to the level of < 1 ppb (according to product specifications). Once

      1KNF N143 SN.12E diaphragm-gas sampling pump.
      2GEA GBS100M 24 plate heat-exchanger.
      3MKS mass flow controller 1179A00614CR1BM TBD
      4SAES MonoTorr PS4-MT15-R-2 heated getter purifier.

                                                –4–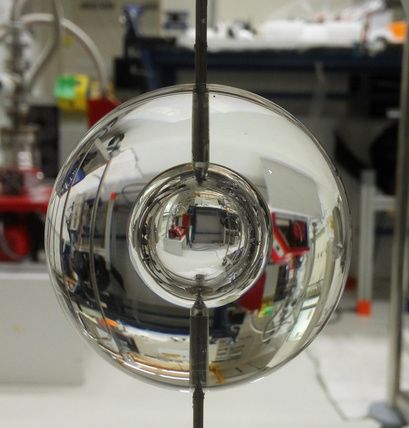
Figure 2. DireXeno mounted on the three racks: (1) the gas handling system; (2) the cryogenic
system, including the heat-exchanger; (3) the detector assembly; and (4) the data acquisition system.
The slow-control is distributed around all three racks.

purified, the gaseous xenon (GXe) is delivered back to the cryogenic system via the heat
exchanger, where it is liquefied and directed into the detector assembly. A schematic of
this system is shown in figure 3.

2.2   Cryogenics

Remote cooling is commonly used in LXe experiments, assisting in reduction in background
radiation and acoustic noise from the cooler to the detector, and also providing design
flexibility. The cryogenic system is connected to the gas handling system on one side and
to the detector assembly on the other, and built such that replacing the cryo-cooler (e.g., to
a pulse tube refrigerator) requires just an adapter at the top flange.
     The cryogenic system is divided into an outer vessel (OV) which holds the insulation
vacuum, and an inner vessel (IV) which holds the xenon. In addition to the vacuum jacket
that minimizes diffusive and convective heat leaks, the IV is fully covered with a multi-layer
aluminized mylar to reduce radiative heating.
     The OV is made of a 10" ConFlat (CF) cube, with ports on all six faces, interfacing
the gas handling system and the detector assembly, and bearing various service ports (e.g.,
feed-throughs, pumping ports, view ports). The OV is connected to the detector assembly
via a 6" CF flexible bellows, providing a shared vacuum jacket.

                                               –5–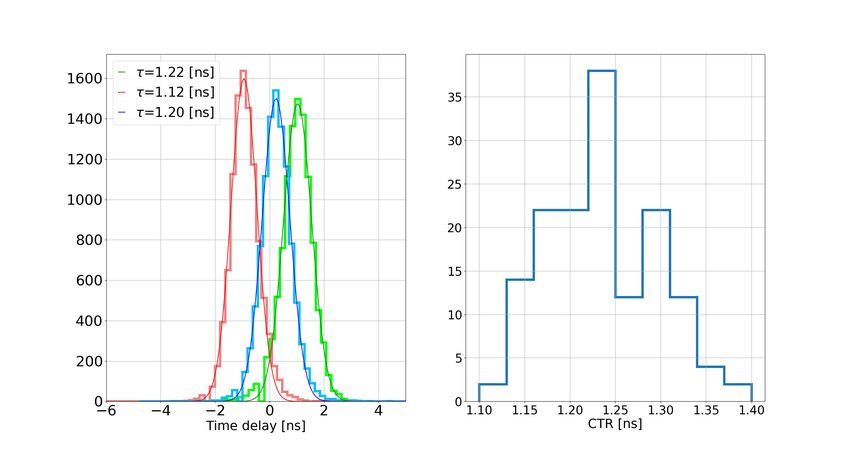
Figure 3. Gas handling system piping and instrumentation diagram. Arched taps indicate high-
pressure valves and arrows indicates needle valves

     The IV is made of an 8" CF nipple with a 6" length. A 120 mm diameter oxygen-free,
high thermal-conductivity (OFHC) copper cold finger is welded to its top flange with a
design similar to the one in [19]. The inner part of the cold finger, which is in contact with
the xenon, has long fins to maximize its surface area and hence its heat-transport flux. The
upper part of the cold finger is in thermal contact with the bottom part of a cryo-cooler1 via
a copper adapter. A cartridge heater inside the copper adapter can be used for emergency
heating in case xenon freezes on the cold finger. The cryo-cooler itself is mounted on a
4 1/2" feed-through on the OV top flange. It is controlled by a drive electronics unit2 that
allows setting the target cooling temperature and maintaining it stable to . 0.2◦ C by a
PID control loop. This system has the advantage that, unlike many other LXe experiments
which use a heater to regulate the temperature, this controller regulates the output power
of the cryo-cooler (up to a maximum of about 70 W cooling power) to maintain the desired
temperature in varying conditions.
     A custom-made 0.6 mm thick stainless steel (SS) funnel is installed on the inner side

   1QDrive 2S132K-22690-A.
   2Allen-Bradley 20BB9P6A3-AYNBNC0 with an integrated OMEGA temperature control unit.

                                            –6–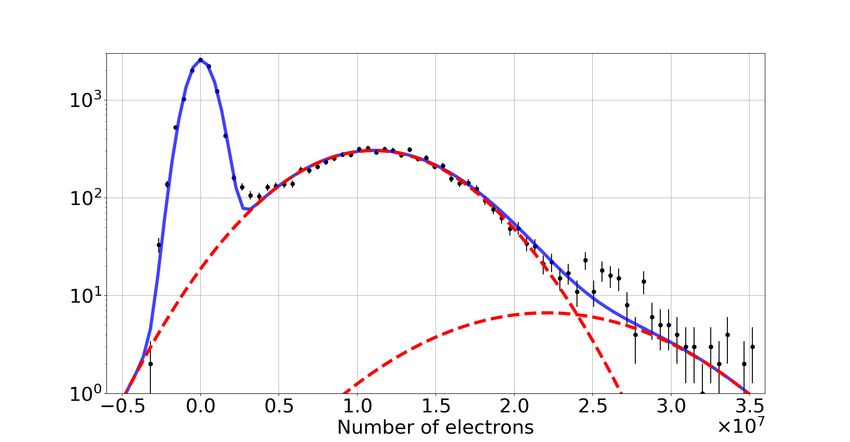
Figure 4. CAD view of the cryogenic system. The interfaces to the detector part, the gas handling
system and the relief valves are indicated by the arrows as well as the outer vessel (OV) and inner
vessel (IV). The parts are: a) heat exchanger, b) cold finger, c) copper adapter thermally connecting
the cold finger to the cryo-cooler, d) cryo-cooler, e) funnel, f) bellows to detector part.

of the IV lower flange, collecting LXe drops from the cold finger and delivering them to
the detector. The IV lower flange is attached to the detector assembly via a 3 3/8 " flexible
bellows, creating a continuous volume that allows the GXe evaporated in the detector to
reach the cold finger and recondense. The bellows also hosts three pipes: the suction and
return pipes from the gas handling system, and the pipe coming from the funnel.
     The purified LXe from the gas handling system and the less pure LXe (from the cold
finger) run in separate pipes, and can be delivered to different parts of the detector. The
CAD view of the cryogenic system design is shown in figure 4.

2.3   The Detector
The detector assembly is a vacuum chamber with an inner assembly consisting of the HPFS
sphere, the PMT sensors observing it and their accessories. This chamber is placed below
the cryogenic system and can be seen in figure 5.
     The interface unit to the cryogenic system consists of two flanges welded together via
seven tubes, which serve as general purpose service ports, four ports with a 2 3/4" CF flange,

                                               –7–
Figure 5. (Left) A CAD view of the detector assembly. (Right top) Top view of the upper pools
(Right bottom) The bottom LXe reservoir
and three with a 1 1/3" CF flange (mini-CF). The upper flange (NW320 ISO-LF) shares the
cryogenic system’s OV insulation vacuum, while the lower one (10" CF) is part of the IV
and can hold a full size LXe vessel in a future detector upgrade. The lower flange of the
interface unit (see figure 5) is also adapted to fit a smaller 4 5⁄8" CF flange, which is used
in the current detector configuration to connect the pools assembly (described below), see
figure 5.
The vacuum chamber is made of an NW320 ISO-LF nipple closed with a blank flange
from below, and connected to the upper interface flange from above. The length of the
nipple is designed to be 50 cm. The height of the setup is less than 190 cm, allowing
transporting the experiment for irradiation.
The 4 5/8" CF adaptation of the interface unit’s lower flange holds a split vessel with
two pools (see figure 5) that serves as a LXe reservoir. One pool (suction) is connected
to the top port of the HPFS sphere, and the other (return) to its bottom. The circulation
path is such that LXe coming from the funnel, or directly from the gas handling system,
drips into the return pool, flows through a 1/2" pipe down to a bottom reservoir, then up
through the sphere and into the suction pool. From the suction pool it is pumped back to
the gas handling system. This creates a buffer that maintains the sphere constantly filled
with LXe, and ensures that the flow and the convection in the LXe are in the same direction.
Each pool is equipped with two temperature sensors1 for liquid level monitoring (see also
section 2.5). The wires of the sensors are connected through a mini-CF feed-through to
1Lakeshore PT111.
–8–the OV (see figure 5).
The bottom LXe reservoir (see figure 5) is connected below the sphere and serves as
a xenon phase-separator and a thermal buffer. Its inclined design prevents bubbles that
form inside it from mixing into the up-flowing fluid. These bubbles accumulate in the top
part of the reservoir and eventually float back to the return pool through the 1/2" input pipe
(see figure 5) rather than through the sphere. The inner pipe feeding the sphere from the
liquid phase inside the reservoir is curved upwards, so bubbles that form below its opening
will not reach the sphere. This way only a single-phase fluid flows through the sphere and
scintillation light is not refracted by liquid-gas boundary layers inside it.
The sphere is a custom-designed hollow shell made of Corning HPFS 8655 with high
transmittance to VUV. Invar tubes with SS mini-CF flanges are connected to the sphere on
both sides, serving as input / output ports (see figure 6). The tubes are glued into the two
holes in the sphere using a low out-gassing, cryogenic epoxy resin1. The bottom flange of
the sphere assembly is connected to the lower thermal bath via a small flexible bellows in
order to prevent torque on the glued ports and to absorb vibrations. The optical properties
of the sphere are further discussed in section 3.
Figure 6. (Left) The technical design of the HPFS shell with Invar tubing and mini CF flanges.
(Right) The industrially manufactured HPFS shell.
Photons emitted from the LXe in the sphere are detected by 20 PMTs2. The PMTs were
tested by the manufacturer in room temperature to have a quantum efficiency (QE) ≥ 30%,
which implies a QE ≥ 33% at 170 K [20] at a wavelength of 178 nm. A positive voltage
divider3 is used to provide high voltage to the PMTs, in the range of 700–900 V.
The PMTs are held with a custom-designed aluminum holder. The holder is made
of two hemispheres hosting the PMTs in 3 rows, all of them pointing to the center of the
sphere. The PMTs are attached to the holder by their voltage–divider bases using M2
1Master Bond EP29LPSP
2Hamamatsu R8520-406 1" PMT, active area 20.5 mm × 20.5 mm
3Hamamatsu E13416 MOD.
–9–PEEK screws. In figure 7 the PMT assembly (holder and PMTs) is presented as well as the
bottom reservoir, pools part, and the sphere.
In some of the initial tests a USB snake camera was inserted into the system for
monitoring the xenon in the sphere. The camera was inserted through a mini-CF port
connected to a 1⁄4" flexible tube with a viewport on its other side. Thus the camera was
never in vacuum or exposed to cold temperatures.
Finally, an optical fiber with a diameter of 1000 µm and numerical aperture of 0.22,
leads 900 ps long (FWHM) light pulses with a wavelength of 365 nm from an outer pulsed-
LED light source1 to the vicinity of the sphere. Along with the light pulse itself, the LED
driver-circuitry also sends a synchronized trigger signal to the data acquisition system.
These two outputs are used for gain and timing calibrations (see sections 6.2 and 6.3).
Figure 7. (Left) One hemisphere of the PMT holder. Two identical such hemispheres are used to
hold the PMTS around the sphere. (Right) photos of the detector assembly without the PMT holder
(a), with partial installation of the PMTs (b), and complete with PMTs installed (c)
2.4 Data Acquisition
The DAQ system uses both NIM and VME electronic modules. The data are read out
through a PCIe card2, which is connected by an optical link to a VME controller3. A
schematic layout of the DAQ system is shown in figure 8.
The PMTs are ramped up to their individual working voltage using a VME high
voltage distributor module4. The raw pulses from the PMTs are split by a NIM fan-in
fan-out (FIFO) module5 before they are processed by the NIM logic and digitized. One of
1Edinburgh Instruments EPLED-365
2CAEN A3818 PCIe card.
3CAEN V2718 VME controller.
4Iseg VDS18130p 24 independent channels positive polarity voltage distributor.
5CAEN N625/N454/N405 FIFO/Logic units.
– 10 –the outputs is sent to a waveform digitizer ADC1, and the other is fed to a discriminator2
which produces a trigger signal to the ADC when a predefined number of PMTs cross a
threshold in an adjustable time window. This discriminator is also connected to a scaler
module3 to monitor the individual PMT trigger rate (see section 2.5).
HV - VDS18130p Fan In/out - N625 CAEN
20 high
20 analog
voltage
PMT signals
lines
20 PMTs -
ADC - V1742 Discriminator
R8520 Hamamatsu
Trigger
CAEN - V895 CAEN
Digital PMT 20 logic
data signals
PCI Card - Controller - Scaler - V830
PC Optical link Individual PMT
A3818 CAEN V2718 CAEN CAEN
bridge trigger rate
Figure 8. The schematic of the data acquisition system of DireXeno. The signal coming from 20
PMTs and the subsequent electronic channels to record the events once triggered.
The ADC is a 32 channel, 12 bit waveform digitizer based on switched capacitor
arrays. It has a maximum sampling rate of 5GS/s, a bandwidth of 600 MHz, an input range
of 1V peak-to-peak with an adjustable offset, and a maximum event record length of 1024
samples. After the waveforms are digitized they are stored as binary files on a local drive
and backed up on a network drive.
2.5 Slow Control
A variety of sensors are used to collect information from the experiment’s subsystems.
This information is monitored to ensure the stability and well-being of the system as well
as to understand the xenon flow conditions. A time-series server was built specifically for
handling time-stamped events and measurements, based on influxdb [21]. Grafana [22],
an open-source software, is used for monitoring and visualization. The monitored data is
streamed to the database using the influxdb API, which is integrated using python control
scripts.
Ten temperature sensors continuously monitor the temperature of different components
in the experiment: two4 in the copper adapter above the cold finger, four5 in the upper
pools for liquid level monitoring and another four6 on the IV tubes of the detector. These
1CAEN ADC V1742 switched capacitor digitizer.
2CAEN V895 16 channel leading edge discriminator.
3CAEN V830 16 channel scaler.
4LakeShore PT-111
5Cryocon GP-100.
6Cryocon XP-100.
– 11 –sensors are connected to a reader1 that provides both display and data connectivity to the SC
computer. The vacuum in the inner and outer vessels is measured by two vacuum gauges2.
The gas pressure in the IV is monitored by a manometer3 connected to a readout and
control unit4. If the IV pressure exceeds the HPFS sphere’s specifications (maximal inner
pressure of 3 bar gauge) a pressure relief system reduces the inner pressure by releasing
xenon to the room, until pressure reaches the desired level.
Four thermistor sensors monitor the inlet and outlet ports of the cooling-water, the
cryo-cooler’s compressor tank and the ambient air temperature. They are read using an
arduino board with an accuracy of ∼ 1◦ C. The total amount of xenon in the system is
monitored using the MFC. The voltage, the current and the trigger-rate of the PMTs are
monitored and streamed to the SC database as well.
A 1/4" vacuum-tight bellows enters the OV through a mini-CF service port, with
an optical view-port at its end. It holds a commercial USB endoscope camera, placed
instead of one of the upper-row PMTs such that it points at the sphere. This camera
allows a continuous on-the-fly visual inspection of the xenon phases inside the sphere. A
simple and fast image processing algorithm constantly monitors the difference between
two consecutive camera snapshots which is then streamed to the SC database.
Finally, the database is continuously checked for missing information, which may
occur in case of gauges failure, connection errors or power failures. It is also checked
for abnormal working conditions, such as excessive pressure and temperatures. An alarm
message is sent in each of these cases, via emails and SMS.
3 Optical Properties of the Sphere
The central component of the experiment is the HPFS sphere, which holds the LXe target,
located in the center of the detector assembly. In order to allow the measurement of the
original direction of photons emitted by the LXe, it is important to reduce the deflection
and absorption of photons on their path from the LXe to the PMTs.
The HPFS transparency to VUV photons is a crucial parameter for setting the di-
mensions of the sphere (inner and outer radii). Therefore, the transmittance of an HPFS
sample was measured using a VUV monochromator5. A deuterium VUV light-source6
was set facing a vacuum chamber with a PMT inside, and an HPFS sample was placed in
front of the PMT window. The light intensity was measured by the PMT with and without
the HPFS sample, and the HPFS transmittance was calculated from the ratio of the two
measurements taking into account the Fresnel reflections on both sides of the sample. The
1Cryocon 18i cryogenic temperature monitor.
2Pfeiffer Vacuum PKR 251, FPM Sealed, DN 40 ISO-KF.
3MKS 722B Baratron transducer.
4MKS PDR2000.
5McPherson 234/302VM.
6McPherson 632.
– 12 –Figure 9. Corning HPFS-8655 characteristics. The internal transmittance Ti measured on an
HPFS sample (left); and the refractive index, as measured by the manufacturer, with a 3rd-order
polynomial fit (right) The relevant wavelength for LXe is ∼ 178 nm.
transmittance as a function of wavelength is shown in figure 9 (left), and is ∼ 98.7% per
cm at 178 nm.
The HPFS refractive index at 178 nm is 1.6 which matches the refractive index of LXe
at 178 nm, 1.56 -1.69 [23–25]. The refractive index at various wavelengths was provided
by the manufacturer and is presented in figure 9 (right).
The sphere’s inner (rin ) and outer (rout ) radii were designed to minimize the deflection
of photons (higher rout /rin ) and for minimal losses (lower rout − rin ). GEANT4-based
simulations assisted in the choice of rin = 1 cm and rout = 3 cm. The relevant geometrical
and optical parameters, which are used in the simulation, are listed in table 1.
4 Detector Sensitivity
In this section we estimate the sensitivity to the emission anisotropy level. The sensitivity of
the detector is defined by its ability to identify an anisotropic component in the scintillation
photons emission pattern on top of the isotropic one. The photon emission pattern is
modeled using a single gaussian beam on top of an isotropic component :
– 13 –F (θ, φ) = (1 − Raniso ) · fiso + Raniso · fG (µ(θ 0, φ0 ), σ), (4.1)
where fiso is the Probability Density Function (PDF) of an isotropic emission, fG is a
PDF of a Gaussian distribution with a mean µ and a half-width at half-maximum (HWHM)
of σ, Raniso is the anisotropic emission fraction. The beam direction (θ 0, φ0 ) is random and
each pattern is characterized by Raniso and σ. These types of variations are selected as light
from SR is expected to be focused along the long symmetry axes of the excimers cloud.
In each simulation event, photons are generated at the center of the LXe sphere, and
propagated through the detector until they hit a PMT or escape the system. The number of
generated photons for each event is a random number drawn from a Poisson distribution
with a mean of 60, which implies an energy deposition of ∼ 2.5 keV (∼ 7.5 keV) for ER
(NR). The photon initial direction is randomly drawn from eq. 4.1. The QE at 170 K is
taken to be 33% (see section 2.3). The first dynode collection efficiency (CE) is taken to
be 81% [26]. The R8520 PMTs have a 20% probability for double photo electron (DPE)
emission on conversion of 178 nm photons [27], which is included in the simulation.
Hence a photon reaching the PMT has a 27% probability to be detected, 53% probability
to be absorbed and 20% probability to be specularly reflected. Taking into account these
probabilities as well as the geometrical properties of the system (see section 2.3); on average
only 7 photons are detected out of the initial 60 photons produced. The DPE effect can
artificially mimic a jet–like component in a purely isotropic sample, especially in events
with a few detected photons, which is the case in our study.
For each event, the angles between all possible pairs of PMTs are calculated and
weighted according to the number of observed hits. This correlation pattern is then
summed over many events, thus disregarding the jet’s main direction (θ 0 , φ0 ) which can
vary between events. In order to quantify the anisotropy of the emission, the angle
correlation distribution is compared to that of an isotropic pattern using a χ2 test. It was
verified that this null hypothesis follows a χ2 distribution.
Table 1. The parameters used in simulation
Parameter Value Parameter Value
LXe absorption length 100 cm HPFS shell inner radius 1cm
LXe scattering length 35 cm HPFS shell thickness 2 cm
LXe refractive index 1.61 PMT efficiency 27%
LXe Scintillation wavelength 178 nm PMT distance from center 40 mm
HPFS absorption length 100 cm Number of PMT 20
HPFS refractive index 1.57 PMT active area 20.5mm × 20.5mm
HPFS scattering length ∞ Invar tube diameter 2 mm
DPE fraction 0.2
To assess the exposure required to identify an anisotropic emission, data sets for
– 14 –different values of the anisotropy fraction (Raniso ) and of the beam HWHM (σ) are generated
and tested against the null hypothesis. This is repeated 20 times for increasing number of
events between 1 − 5000. The χ2 ranges obtained for the selected Raniso and σ variations
are shown in figure 10.
It is clear that . 5 × 10³ events are enough to distinguish anisotropic emission of as
little as Raniso = 0.2 for beams with HWHM as large as 30◦ , over an isotropic emission
pattern that contains the DPE contamination (see figure 10 left). As expected, wider jets
are harder to identify over the isotropic component, while below a width of ∼ 5◦ the jet’s
inner structure is no longer resolvable (for Raniso = 0.2 and 60 initial photons, see figure 10
right).
The simplified statistical model presented here only provides a rough estimation of the
expected sensitivity. We are now developing a more complete statistical model that will
also include temporal anisotropy, treat the isotropic-DPE pattern as the null hypothesis,
and address the challenge of separating DPE events which have a jet-like structure.
Figure 10. (Left) χν2 of anisotropic emissions with beam width of 5◦ HWHM and various Raniso
(Right) χν2 of anisotropic emissions with Raniso = 0.2 and various beam widths (HWHM). In both
plots the grey band is for isotropic emission and no DPE and magenta band is for isotropic emission
with DPE=20%.
We simulate two common used sources that emit isotropically, a 10 µCi 137 Cs, and a 2.7
µCi 241 AmBe, and apply an energy selection criterion which corresponds to the simulated
number of photons/events ±20% (60 ± 12), this translates into an energy deposition of
(2.5 ± 0.5) keV (ER) and (7 ± 1.4) keV (NR). The rate of events satisfying these selection
criterion is found to be 625 events/day for ER and 1.25 × 10⁴ events/day for NR. Given
these rates, a system that can operate stably for a few weeks could determine differences
between ER events and NR events with the sort of anisotropies discussed above. When
taking data of 241 AmBe, the source will be shielded to reduce the level of gammas that will
be introduced to the system.
– 15 –5 Experiment Operation
The system was tested in a series of commissioning runs that included a full cycle of oper-
ation: (a) system evacuation; (b) xenon gas filling and liquefaction; (c) xenon circulation
and purification; (d) detector operation; and (e) xenon recovery. The slow-control readings
for a typical operation cycle are shown in figure 11.
5.1 Operation Cycle
The IV is evacuated to reach a pressure of ∼ 5 × 10⁻⁶ mbar and the OV is pumped to better
than 10−4 mbar, when cooling of the cold finger and filling of xenon is started. Cool-down
of the IV takes a few hours, but it takes several days for the LXe filled detector to reach
a thermodynamic steady-state since elements of the detector that are not in direct contact
with LXe, such as the PMT assembly, cool mainly by radiation, which is considerably less
efficient than conduction in this case. As described in section 5.2, the system eventually
reaches a state suitable for experimental-data acquisition. In the end of the run the xenon
is cryo-pumped from the IV to the liquid-nitrogen-cooled reservoir tank.
5.2 Cryogenic Stability
In order to have a reliable measurement of the temporal and spatial properties of the scintil-
lation process, the LXe target region must be hydrodynamically and thermally stable. Phase
transitions or turbulent flows in the xenon inside the sphere may create inhomogeneities
in the refractive index and damage correlation studies. Hence, the foremost milestone of
DireXeno commissioning was to demonstrate that LXe can be stably maintained in the
sphere as a single-phase fluid under laminar flow.
During the commissioning we have identified two dominant sources of thermodynamic
disturbances that send GXe bubbles through the sphere when the system is filled with LXe.
One is radiation from the OV that directly heats both the sphere and the LXe inside it, and
the other is GXe bubbles that form inside the bottom reservoir and float up through the
sphere to the LXe surface in the upper pools. Even though all the xenon containing parts
of the detector are directly covered with ten-layered super-insulation (in addition to the
super-insulation bag that covers the entire detector assembly), the sphere itself is exposed,
and hence susceptible to radiative heating from the non-cold parts of the detector, such as
the PMT assembly. This assembly is thermally disconnected from the IV and therefore
cools very slowly. The steady-state temperature measured on the PMT assembly never
goes below −30◦ C. Nevertheless, the sphere itself, once cold, is massive enough to serve
as a thermal buffer that prevents LXe from boiling inside it. Indeed, for a well isolated IV,
this boiling inside the sphere stops several hours after its cool-down. The second source
of bubbles that float through the sphere is eliminated by the special design of the bottom
reservoir, which serves as a phase-separator and prevents bubbles from mixing into the
up-flowing fluid when it is sufficiently cold (see section 2.3).
– 16 –Figure 11. Sphere temperature and GXe pressure during the commissioning run. The cryo-cooler
was turned on at Time = 0, when the system was already filled with ∼ 1900 mbar GXe at room
temperature. More GXe was added after about a day of initial cooling (top left). Stable and
calm conditions in the sphere were reached after about 15 days (bottom). Large pressure spikes
between days 2–14 are due to circulation pump turning on and off. Small hour-scale pressure
spikes throughout the run are due to ambient air-conditioning controller algorithm, and they did not
compromise the sphere’s tranquility. After 43 days the cryo-cooler was turned off and the Xe inside
was recuperated (top right).
In a final commissioning run that extended over 44 days of continuous operation,
we have shown that stable conditions with no visible bubbles inside the sphere can be
reached within two weeks of cooling, and maintained for at least another 30 days. The SC
parameters for this run are shown in figure 11 and demonstrate that the stability of the LXe
inside the sphere is not compromised by ambient temperature fluctuations. After reaching
the 30-day stability milestone, the system was shut down for upgrades and preparation for
science runs.
6 First Measurements
The results reported here were collected in two commissioning runs. The setup included
the fully assembled detector with 19 PMTs, and the optical USB camera in place of the
20th PMT. Out of these, only 13 (17) PMTs were operational during the first (second) run
– 17 –due to connection and cabling issues inside the OV. The trigger condition is a user-defined
combination of PMT signal thresholds and their multiplicities. The events presented in
this section were triggered by the crossing of a 100 mV threshold in at least three of the
PMTs. In this trigger configuration the detector is not sensitive to low energy interactions,
and for physics runs the trigger should be optimized. Some recorded waveforms are shown
in figure 12.
Data were collected in several setups: (a) background, without any external source;
(b) gain calibration with short UV-light pulses; (c) 57 Co γ source exposure; and (d) 137 Cs
γ source exposure.
Figure 12. Waveforms examples of one PE (top left), few PEs, (bottom left) and multiple PEs
(right).
6.1 Basic Analysis
The collected waveforms were analyzed offline to find their morphological and statistical
features. These features were then used for event classification and rate calculations.
Most notably, the baseline and the peaks were established. Since the anode rise time
of the PMTs is 1.8 ns, actual PEs can only create peaks wider than 3.6 ns (FWHM). We
therefore convolve the waveforms with a 2 ns wide blackman filter, to smooth-out narrow
noise-related features before applying the peak detection algorithm.
– 18 –6.2 Gain Calibration
The PMT gains were measured in a designated gain calibration campaign which was
performed before data acquisition of Background, 57 Co, and 137 Cs.
The UV pulsed-LED described in section 2.3 was set to generate a fast (. 1 ns) and
faint calibration signal (365 nm) for the PMTs. For each PMT a sample of 105 such events
was used to produce the one PE area spectrum, which was then fitted by an empirical
distribution model. Assuming normal underlying PE distributions, the combined model
can be written as
q
g(x) = A0 G (x; µ0, σ0 ) +A1 G x; µ0 + µ1, + σ02 σ12
q , (6.1)
+A2 G x; µ0 + 2µ1, σ02 + 2σ12
where G(x; µ, σ) = exp(−(x − µ)2 / 2σ 2 ) is a Gaussian shape function. The first term
represents the pedestal, which is mainly due to electronic noise. The second and third
terms are the one and two PE charge distributions, respectively. The effects of higher
order terms as well as DPE (at λ = 365 nm) are negligible with respect to the one PE and
therefore not considered. An example of a typical spectrum with its fit is given in figure 13.
The charge resolution (σ1 /µ1 ) of the active PMTs is 0.48 with a spread of (std) 0.08.
Figure 13. Charge spectrum of a typical PMT at 850 V under pulsed-LED illumination (black
crosses) and a combined fit (blue) of the pedestal, one PE and two PE components. Gain is
∼ 11 × 106 .
– 19 –6.3 Temporal Calibration & Resolution
The temporal response of each data channel in the detector, from incident photons at the
PMT window to the digitizer output, depends on the internal response of the PMT itself
and on the electronic noise and latency fluctuation introduced by the DAQ components.
Calibration of the relative delay between the channels is therefore necessary for a correct
temporal analysis of events.
In each of the PMTs, when the photocathode is illuminated with photons over its entire
area, the transit time of a PE pulse inside the PMT has a fluctuation, a transit-time spread
or jitter, which is inversely proportional both to the square root of the PE number, and to
the square root of the operation voltage [28]. The manufacturer reports an intrinsic jitter of
0.8 ns (FWHM) at 800 V for our PMTs, to which the channel electronic fluctuation should
be added.
When two PMTs record photons that were emitted simultaneously from the center of
the detector (i.e., at equal photon time-of-flight), the time delay between the two sets of
readings at the DAQ is expected to be normally distributed, and the width of the distribution
is the detector’s (pairwise) uncertainty in timing. This is also known as the coincidence
time resolution (CTR), and is given by
2
τ12 = τ12 + τ22, (6.2)
where τ1 and τ2 are the overall jitters of the two PMTs. Due to the intrinsic jitter of the
PMTs, we expect τ12 & 1.13 ns (FWHM).
We used high occupancy (> 2000 PEs per waveform) ER events generated by 137 Cs
γ radiation to estimate the CTR of the detector. These events can be considered as point
sources with nearly spherically symmetric emission. The first light of each waveform in
each event was timed at the point it reached 10% of the pulse maximum amplitude, relative
to the baseline, and the times were used to find the pairwise-delay distributions of the
PMTs. The delay distributions of three typical PMT pairs and the distribution of the CTR
between all pairs of PMTs are shown in figure 14. The time uncertainty of the detector is
taken to be the largest CTR (i.e., the worse resolution). In these conditions it was found
to be . 1.4 ns (FWHM), which is sufficient for measuring the temporal structure of LXe
scintillation and detecting superradiance (possibly a sub-ns process).
6.4 Scintillation Spectrum & Light Yield
The 57 Co scintillation light spectrum is shown in figure 15 (top). A Gaussian fit to the
dominant peak of 122 keV γ-rays gives (805 ± 71) PE. These results correspond to a light
yield of Ly = (6.6 ± 0.6) PE / keV and an energy resolution of 9%. Hence, for the full
experiment setup with 20 PMTs (which was not tested in this run), a light yield of about
Ly ∼ (7 ± 1) PE / keV is expected. The light collection efficiency (LCE), defined as the
ratio between the number of photons reaching the PMT photocathode to the number of
– 20 –Figure 14. The delay distribution between three pairs of PMTs with a Gaussian fit; τ is the FWHM
taken from the fit (left). The distribution of the CTR (τ) from all pairs of PMTs (right).
photons emitted, is given by
NPE ()
Lc = , (6.3)
Nγ () · PMTeff · PDPE
where Nγ is the absolute scintillation light yield for incident particles of energy , NPE is
the number of PEs measured by the PMTs per scintillation event, PMTeff is the PMT total
efficiency which accounts both for the QE and CE, and PDPE is the probability for DPE
production (20%). For QE = 0.33, CE=0.81(see section 4), and Nγ = 65 ± 2 Photons / keV
[29, 30] (with zero electric field), the LCE of the tested detector configuration is Lc =
(0.31 ± 0.04). For comparison, the geometrical coverage of 17 PMTs gives ∼ 0.35. The
difference between these two values can be attributed to waveform tails not included in
the digitization window and to the absorption of photons in the sphere (∼ 2%) and LXe
(∼ 0.5%).
Table 2 shows a summary of the light yield and energy resolution for 57 Co and 137 Cs
sources (see spectrum in figure 15 bottom).
Table 2. Light yield and energy resolution for different γ-ray sources with 17 PMTs.
Energy resolution
Source Energy [keV] Light yield [PE / keV]
(σE / E) [%]
57 Co 122 6.6 ± 0.6 9
137 Cs 662 5.3 ± 0.7 13
– 21 –Figure 15. (top) Scintillation spectrum of 57 Co and background. The full absorption peak is
measured to be (806 ± 71) PE. (bottom) The spectrum of 137 Cs, the peak seen at ∼ 1200PE is the
Compton shoulder whereas the one at (3503 ± 441) PE is the full absorption. The background data
set is identical in both cases and is taken from the “background only” run.
7 Summary
We have constructed the setup of DireXeno, an apparatus designed to measure the spatial
and temporal distributions of LXe scintillation and demonstrated the sensitivity of the
detector to non isotropic emission in the form of a beam with as little as Raniso & 20%
and HWHM as large as θ . 30◦ . A run–time of several weeks is required if using typical
radioactive sources. The detector has shown stable conditions for a run–time of 44 days.
The time resolution on calibration events was measured to be . 1.4 ns (implying . 0.55 ns
1σ) and the energy resolution at 122 keV was measured to be 9%. These values are
sufficient to measure effects like super-radiance or other non-linear scintillation processes.
Once we will improve the data quality from the detector by utilizing all 20 PMTs and
better understanding the detector response, we will collect data from the same γ sources in
addition to a neutron source.
The impact of the discovery of an anisotropy or other new behavior in the emission
of scintillation on, for example, dark matter searches, will depend on the nature and
observability of the new phenomenon. Searches for effects of this kind have not been
reported by previous experiments. The performance of the current setup is designed to
– 22 –give optimal sensitivity to correlation in time and space among scintillation photons.
8 Acknowledgment
The authors thank A. Breskin, V. Chepel, L. Arazi and D. Vartsky for useful discussions,
and S. Shchemelinin for assistance with transparency measurements. The authors thank
the Weizmann Institute for the generous support. This work was supported by a Pazy-
Vatat grant for young scientists and by the I-CORE Program of the Planning Budgeting
Committee and the Israel Science Foundation (grant No. 1937/12). RB is the incumbent
of the Arye and Ido Dissentshik Career Development Chair.
References
[1] XENON collaboration, E. Aprile et al., The XENON1T Dark Matter Experiment, Eur. Phys.
J. C77 (2017) 881, [1708.07051].
[2] LUX collaboration, D. S. Akerib et al., Results from a search for dark matter in the complete
LUX exposure, Phys. Rev. Lett. 118 (2017) 021303, [1608.07648].
[3] PandaX-II collaboration, X. Cui, A. Abdukerim, W. Chen, X. Chen, Y. Chen, B. Dong et al.,
Dark matter results from 54-ton-day exposure of pandax-ii experiment, Phys. Rev. Lett. 119
(Oct, 2017) 181302.
[4] XMASS 3 collaboration, K. Abe, K. Hiraide, K. Ichimura, Y. Kishimoto, K. Kobayashi,
M. Kobayashi et al., Direct dark matter search by annual modulation with 2.7 years of
xmass-i data, Phys. Rev. D 97 (May, 2018) 102006.
[5] M. Auger, D. J. Auty, P. S. Barbeau, L. Bartoszek, E. Baussan, E. Beauchamp et al., The
EXO-200 detector, part i: detector design and construction, Journal of Instrumentation 7
(May, 2012) P05010–P05010.
[6] J. Billard, L. Strigari and E. Figueroa-Feliciano, Implication of neutrino backgrounds on the
reach of next generation dark matter direct detection experiments, Phys. Rev. D89 (2014)
023524, [1307.5458].
[7] DARWIN collaboration, J. Aalbers et al., DARWIN: towards the ultimate dark matter
detector, JCAP 1611 (2016) 017, [1606.07001].
[8] T. Doke, Fundamental Properties of Liquid Argon, Krypton and Xenon as Radiation
Detector Media, Portugal. Phys. 12 (1981) 9–48.
[9] K. Fujii, Y. Endo, Y. Torigoe, S. Nakamura, T. Haruyama, K. Kasami et al., High-accuracy
measurement of the emission spectrum of liquid xenon in the vacuum ultraviolet region,
Nuclear Instruments and Methods in Physics Research Section A: Accelerators,
Spectrometers, Detectors and Associated Equipment 795 (2015) 293 – 297.
[10] T. Doke, Scintillation of liquid xenon and its application to nuclear radiation detectors,
IEEE Transactions on Dielectrics and Electrical Insulation 13 (June, 2006) 640–649.
– 23 –[11] M. Gross and S. Haroche, Superradiance: An essay on the theory of collective spontaneous
emission, Physics Reports 93 (1982) 301 – 396.
[12] V. Chepel and H. Araujo, Liquid noble gas detectors for low energy particle physics, JINST
8 (2013) R04001, [1207.2292].
[13] E. Aprile, C. E. Dahl, L. DeViveiros, R. Gaitskell, K. L. Giboni, J. Kwong et al.,
Simultaneous measurement of ionization and scintillation from nuclear recoils in liquid
xenon as target for a dark matter experiment, Phys. Rev. Lett. 97 (2006) 081302,
[astro-ph/0601552].
[14] J. Billard, L. Strigari and E. Figueroa-Feliciano, Implication of neutrino backgrounds on the
reach of next generation dark matter direct detection experiments, Phys. Rev. D89 (2014)
023524, [1307.5458].
[15] J. F. Beacom, The Diffuse Supernova Neutrino Background, Ann. Rev. Nucl. Part. Sci. 60
(2010) 439–462, [1004.3311].
[16] D. N. Spergel, Motion of the earth and the detection of weakly interacting massive particles,
Phys. Rev. D 37 (Mar, 1988) 1353–1355.
[17] N. G. Basov, V. A. Danilychev and Y. M. Popov, Stimulated emission in the vacuum
ultraviolet region, Soviet Journal of Quantum Electronics 1 (Jan, 1971) 18–22.
[18] LUX collaboration, D. S. Akerib et al., The Large Underground Xenon (LUX) Experiment,
Nucl. Instrum. Meth. A704 (2013) 111–126, [1211.3788].
[19] Xenon100 Collaboration, E. Aprile, K. Arisaka, F. Arneodo, A. Askin, L. Baudis et al., The
XENON100 dark matter experiment, Astroparticle Physics 35 (Apr., 2012) 573–590,
[1107.2155].
[20] E. Aprile et al., Measurement of the Quantum Efficiency of Hamamatsu R8520
Photomultipliers at Liquid Xenon Temperature, JINST 7 (2012) P10005, [1207.5432].
[21] InfluxData Inc. influxDB v1.5.0 https://www.influxdata.com.
[22] Grafana v5.0.3, Grafana Labs. https://grafana.com.
[23] V. N. Solovov, V. Chepel, M. I. Lopes and A. Hitachi, Measurement of the refractive index
and attenuation length of liquid xenon for its scintillation light, Nucl. Instrum. Meth. A516
(2004) 462–474, [physics/0307044].
[24] L. M. Barkov, A. A. Grebenyuk, N. M. Ryskulov, P. Yu. Stepanov and S. G. Zverev,
Measurement of the refractive index of liquid xenon for intrinsic scintillation light, Nucl.
Instrum. Meth. A379 (1996) 482–483.
[25] J. L. Subtil, P. Laporte, R. Reininger and V. Saile, Vuv optical constants of liquid and solid
xenon at the triple point, physica status solidi (b) 143 (1987) 783–793,
[https://onlinelibrary.wiley.com/doi/pdf/10.1002/pssb.2221430239].
[26] L. Arazi. private communication, Jan. 10, 2020.
[27] C. H. Faham, V. M. Gehman, A. Currie, A. Dobi, P. Sorensen and R. J. Gaitskell,
– 24 –Measurements of wavelength-dependent double photoelectron emission from single photons
in VUV-sensitive photomultiplier tubes, JINST 10 (2015) P09010, [1506.08748].
[28] Photomultiplier Tubes: Basics and Applications. Hamamatsu Photonics K. K., 3 ed., 2007.
[29] M. Szydagis et al., Noble element simulation technique v2.0,
2018,https://zenodo.org/badge/latestdoi/96344242.
[30] M. Szydagis, N. Barry, K. Kazkaz, J. Mock, D. Stolp, M. Sweany et al., NEST: A
Comprehensive Model for Scintillation Yield in Liquid Xenon, JINST 6 (2011) P10002,
[1106.1613].
– 25 –You can also read