DISCUSSION PAPER SERIES - Social Gaps, Perceived Inequality and Protests IZA DP No. 17769 - Institute of Labor Economics
←
→
Page content transcription
If your browser does not render page correctly, please read the page content below
DISCUSSION PAPER SERIES

IZA DP No. 17769

Social Gaps, Perceived Inequality
and Protests

Olivier Bargain
H. Xavier Jara
David Rivera

MARCH 2025
DISCUSSION PAPER SERIES

IZA DP No. 17769

Social Gaps, Perceived Inequality
and Protests

Olivier Bargain
Bordeaux School of Economics, Princeton University, Institut Universitaire de France
and IZA
H. Xavier Jara
LSE
David Rivera
Bordeaux University

MARCH 2025

Any opinions expressed in this paper are those of the author(s) and not those of IZA. Research published in this series may
include views on policy, but IZA takes no institutional policy positions. The IZA research network is committed to the IZA
Guiding Principles of Research Integrity.
The IZA Institute of Labor Economics is an independent economic research institute that conducts research in labor economics
and offers evidence-based policy advice on labor market issues. Supported by the Deutsche Post Foundation, IZA runs the
world’s largest network of economists, whose research aims to provide answers to the global labor market challenges of our
time. Our key objective is to build bridges between academic research, policymakers and society.
IZA Discussion Papers often represent preliminary work and are circulated to encourage discussion. Citation of such a paper
should account for its provisional character. A revised version may be available directly from the author.

 ISSN: 2365-9793

 IZA – Institute of Labor Economics
Schaumburg-Lippe-Straße 5–9 Phone: +49-228-3894-0
53113 Bonn, Germany Email: publications@iza.org www.iza.org
IZA DP No. 17769 MARCH 2025

 ABSTRACT
 Social Gaps, Perceived Inequality
 and Protests*
 Latent feelings of economic vulnerability and social stagnation may have catalyzed the
 unprecedented uprisings that shook Latin America and other parts of the world in 2018-
 2019. We document this process in the context of Chile, leveraging survey data on protest
 participation and its potential determinants. Specifically, we construct a “social gap” index,
 measuring the disconnect between objective and perceived social status. Our findings
 suggest that this social gap predicts protest involvement beyond factors such as perceived
 living costs, the subjective value of public services, peer influence, or political demands.
 Notably, it complements broader feelings of anger toward inequalities in explaining
 protests.

 Keywords: protests, social gap, perceived inequality, social status

 Corresponding author:
 Olivier Bargain
 Bordeaux School of Economics
 Bordeaux University
 Rue L. Duguit
 33608 Pessac
 France
 E-mail: olivier.bargain@u-bordeaux.fr

 * This study has received financial support from the French State in the framework of the Investments for the
 Future program IdEx université de Bordeaux / GPR HOPE. We are grateful to Mathieu Bourret-Soto, Frank Cowell,
 Francisco Ferreira, Andrés Irarrázaval, Francesco Lissoni, Maria Lo Bue, Quentin Stoeffler, and participants at seminars
 and workshops (Bordeaux School of Economics, London School of Economics, LACEA conference, Welfare & Policy
 conference) for their valuable suggestions. The usual disclaimer applies.
1. Introduction
Feelings of social stagnation and economic insecurity have played a crucial role in recent
political shifts, particularly in bolstering support for radical and populist movements in
Western countries. Research has extensively documented how economic downgrading and
insecurity—whether caused by globalization (Autor et al., 2020), austerity policies (Fetzer,
2019; Baccini and Sattler, 2024; Justino et al., 2023), or a combination of both (Algan et al.,
2017; Bossert et al., 2023; Guiso et al., 2024)—has contributed to shift electoral behavior in the
US or in Europe. However, less attention has been paid to how similar perceptions and
grievances translate into social protests, in particular during the unprecedented global wave
of unrest in 2019 (Justino and Martorano, 2016, 2019; Justino et al., 2019). Our research
provides new evidence on the distributional and psychological determinants of mass
mobilizations in Latin America: we focus on the November 2019 protests in Chile (Estallido),
which began as a student movement but quickly escalated into a broader outcry. While each
protest had specific local triggers—such as metro fare hikes in Chile or the removal of
gasoline subsidies in Ecuador—these events were largely fueled by widespread perceptions
of social frustration amid unjust political and economic systems, rising living costs, and
deteriorating public services.

So far, the literature has focused mainly on objective measures of inequality or relative
deprivation to explain protests. Actual disparities may matter, for instance the role of
regional inequities in France during the Yellow Vest movement (Algan et al., 2019) or top-
income inequality rooted in neoliberal policies since the Pinochet era in Chile (Palacios-
Valladares, 2017). Yet, capturing the role of inequality dynamics is challenging (Solt, 2008)
and evidence is mixed.1 The Latin American case highlights well this difficulty: the 2019
protests erupted after two decades of declining inequality, suggesting that frustration arose
not from worsening conditions but from the perception that progress was incomplete and
insufficient (Ferreira and Schoch, 2020).2 This highlights the need to focus instead on
subjective inequality and, more specifically, the feeling of relative social position. In Chile,
protesters voiced grievances over corruption, tax evasion by the wealthy, as well as their

1 A positive relationship is sometimes found between local inequality and protest using cross country
variation (e.g., in Nollert, 1995) but also an ambiguous or negative one (e.g., Dubrow et al., 2008; Solt,
2015). Using changes in local inequality provides a source of variation but may not refer to the most
relevant comparison points. Results vary also widely across contexts, as shown in Luca et al. (2025):
the authors find positive correlations in the poorest countries but weak ones in middle-income and
richer countries, which aligns with evidence from Latin America (e.g., Justino and Martorano, 2016).
For Colombia, Justino et al. (2019) indicate that civic engagement levels increase with inequality.
2 Chile is no exception. The Gini coefficient fell from 54.9 in 2000 to 46.5 in 2017. On the other hand, the

share of national wealth captured by the ultra-rich increased (UNDP, 2017).

 2
own daily economic struggles, suggesting that both perceived individual situations and
distributional beliefs played a central role (Justino and Martorano, 2016, 2019). The
persistence of an oligarchic social contract that sustained inequality of opportunity bred
discontent, particularly among the middle and upper-middle income groups, who felt that
not belonging to the elite meant enduring economic insecurity and social relegation.

Against this background, we propose new empirical evidence based on original data linking
protest behavior to `misperceptions’ of social ranks, alongside more usual determinants of
social unrest. Precisely, we hypothesize that perceived social status, relative to actual
standing, is a key catalyst for these social movements, alongside perceived inequality, unmet
democratic expectations, rising living costs, and public sector privatization (Cox et al., 2024).
We use panel data collected both in 2018 and following the 2019 protests. The survey enables
us to explore alternative measures of protest participation (such as social media activism,
street protests, and justification of violence). It also allows including various potential
correlates or determinants (such as the perceived value of public services and living costs,
peer influence, unfairness feelings regarding income distribution, and political attitude),
along with subjective assessments of social standing. Specifically, we construct of a ‘social
gap’ measure, which quantifies the divergence between one’s objective social status—
measured through alternative proxies based on income, occupation, or a combination—and
subjective status, i.e., individuals’ perceptions of their place in society. By analyzing this
measure alongside other key determinants of protests, we provide a more comprehensive
understanding of the psychological determinants of protest behavior.

Our results begin by outlining the characteristics of the protesters. They primarily belong to
the middle or upper-middle class, either measured by income or occupation levels, rather
than the low-income (or low-status) tiers. When accounting for standard socio-demographic
and economic controls, the perceived social status does not explain protest participation,
which is unsurprising given the fact that it is highly concentrated around central values.
However, the tension between this subjective status and objective measures of social status—
i.e., our ‘social gap’ measure—proves to be a consistent predictor of protest engagement.
Individuals with a greater divergence between their perceived and actual social ranks exhibit
higher levels of mobilization, suggesting that misperceptions and social frustration serve as
catalysts for action. While our baseline result is based on the lagged social gap (i.e., 2018) to
mitigate concerns of reverse causality, we also examine the cumulative dynamics leading up
to the 2019 events. Specifically, we show that the probability of protesting increases with
both prior social gap levels (as observed in 2017) and the widening of the social gap between
2017 to 2018. These results are not causal, as variations in the social gap (across individuals
or over time) may stem from unobserved factors that simultaneously influence protest

 3
behavior. However, our findings are highly suggestive and provide valuable insight into the
strong connection between a self-focused measure (the social gap) and the likelihood of
participating in an unprecedented social uprising. Heterogeneity analyses show that protests
are driven by the difference between those perceiving themselves as relatively
disadvantaged (while possibly belonging to higher-status groups) and those feeling above
their actual status (possibly belonging to the poor), but also by differences within the first
group. The protest response to the feeling of social downgrading is not confined to some
specific characteristics; rather, it is strong across the various attributes of protesters (e.g.,
being young or middle-aged, more educated, anti-conservative voters, or resident of urban
centers). Finally, we estimate protest participation in richer specifications and find a solid
effect of the social gap even when controlling for other self-interest considerations (such as
perceived cost of living and public service quality), peer influence, or political views (e.g.,
concerns about democracy and corruption). Most importantly, we find that the social gap is
not merely a component of redistributive views and perceived inequality. Individuals with
stronger redistributive demands are more likely to protest, but the effect of the social gap
remains robust after controlling for unfairness feelings (regarding income distribution or tax
policies) or, alternatively, anger over inequality. These findings suggest that social rank
misperception serves as a distinct psychological and motivational factor for political activism
beyond emotional perceptions of inequality.

This paper provides several contributions. First, we participate to the growing literature on
what triggers social movements and civil conflicts. In poorer settings, such as those in Africa,
social unrest often emerges from deep-seated inequalities—particularly along ethnic or class
lines—that are exacerbated by economic disruptions. Events like natural disasters (Harari
and La Ferrara, 2018), epidemics (Cervellati et al., 2022), and fluctuations in commodity
prices (Berman and Couttenier, 2015) generate income shocks that heighten existing tensions,
ultimately leading to conflict. In contrast, in middle- and high-income countries, such as
those in Latin America, protests are frequently triggered by policies perceived as unfair (e.g.,
a subway fare increases in Chile). These events appear as breaking points within broader
contexts of frustration over top-income concentration, democratic deficits, and declining
living standards. Second, more specifically, our study adds to the limited literature on social
unrest in Latin America. Existing research links social activism and perceptions of
unfairness, particularly through social media (Reyes and Gasparini, 2022), or explores how
redistributive preferences and perceptions regarding public services, living standards, and
corruption, shape protest dynamics (Justino and Martorano, 2019). We build on this
literature by further disentangling these mechanisms and the role of self-interest
determinants (such as the social gap) beyond redistributive views. Third, research on the link

 4
between relative concerns and protests is relatively limited so far. While some studies in
sociology and social psychology examine how objective income influences political activism
(Fransman and von Fintel, 2024) or protest behavior (Grant and Brown, 1995; Lijphart, 1997;
Grasso and Giugni, 2016), fewer focus on subjective perceptions of relative deprivation. An
abundant literature shows that the objectively poor tend to have lower political participation
(Brady et al., 1995; Solt, 2008; Schlozman et al., 2012; Erikson, 2015; Kraus et al., 2015) due to
structural barriers (e.g., lack of resources, education, and time) and lower social integration
into networks that encourage engagement. Yet, these mechanisms are rarely related to
subjective ranks and perceptions (Ravallion, 2015). Similarly, the feeling of being worse off
than one's actual position is rarely considered a key factor in explaining higher levels of
political engagement and activism among the middle and upper-middle class.3 Our results
confirm that low protest participation among the poor may stem from a sense of centrality,
while protest activity is more prevalent among non-poor individuals who perceive
themselves as falling behind. This work is also related and complementary to the literature
focusing on (mis)perceptions of inequality.4 Fourth, our study contributes to the more general
research linking relative social status to other relevant outcomes, such as subjective well-
being and redistributive preferences. Our social gap index inherently captures how
individuals perceive themselves as disadvantaged relative to their expectations or their
social reference group.5 The literature connecting relative status and subjective well-being
(e.g., Ferrer-i-Carbonell, 2005; Ravallion and Lokshin, 2010; Perez-Truglia, 2020) actually
points to stronger associations when subjective, rather than objective, status is used (Tan et
al., 2020); it also challenges the identification of the comparison group (Clark and Senik,
2010).6 Individuals’ perceived socio-economic position—and misjudgments of their own

3 An exception is Grasso et al. (2019). Qualitative evidence of a deprivation-protest paradox is also
provided in Power (2018), describing situations where people are aware of a narrative of objective
recovery but are not feeling it subjectively in their lived experiences: this gap—between expectations
and lived experiences—can galvanize and legitimize protest and civic discontent.
4 Inequality perception may play a role on redistributive demand and political engagement, as shown

in social psychological research (Hauser and Norton, 2017) and economic analyses utilizing country
variation (Gimpelson and Treisman, 2018) or country-time variation (Bussolo et al., 2021).
Experiments show that discrepancies between actual and perceived inequality levels can go in both
directions (some tend to underestimate inequality, e.g. in Osberg and Smeeding 2006, Norton and
Ariely 2011; or to overestimate it, e.g., in Chambers et al. 2013). Discrepancies may stem from the fact
that subjective views are shaped by personal experiences, societal contexts, and broader notions of
inequality that encompass economic insecurity, availability of public goods, etc., in addition to
standard income disparities (Bussolo et al, 2021).
5 Social frustration also stemmed from the stark contrast between the "Chilean Miracle" narrative and

individual reality. While Chile was often hailed as Latin America’s most developed economy, many
Chileans felt this success did not benefit them personally.
6 Witte et al. (2020) investigate the mediating role of subjective well-being for explaining social unrest.

 5
status—also shape their views on how unfair inequality is and, subsequently, their
distributional preferences (e.g., Fong 2001; Kuziemko et al., 2014; Fisman et al. 2020;
Hvidberg et al 2021). We attempt to disentangle these different elements and show that the
social gap is not only a component of redistributive demands and perceived inequality but
plays its role as a protest catalyst. Finally, our results are broadly consistent with studies on
redistributive preferences that manipulate individual rank perception experimentally.7

The rest of the paper is structured as follows. Section 2 provides background information
and presents the data and the empirical strategy. Section 3 reports the main results,
heterogeneity and sensitivity analyses, while section 4 concludes.

2. Background Information, Data and Empirical strategy

2.1. Background Information

The 2019 Chilean protests began on October 6th following a metro fare increase in Santiago,
initially sparking widespread fare evasion by students. The unrest quickly escalated into
mass mobilization, leading to violent confrontations and prompting the government to
declare a state of emergency. The movement reached its peak on October 25th, when
approximately 1.2 million people gathered in Santiago, with other numerous protests
spreading across multiple cities nationwide. The unrest continued for several weeks, marked
by intense and widespread demonstrations, resulting in 36 deaths and over 11,500 injuries.
Over time, protest participation gradually declined, further dampened by COVID-19
restrictions in 2020. The demonstrations left a lasting impact, eventually contributing to
national elections and the drafting of a new constitution in 2021 to address long-standing
grievances. As was the case for several social movements in 2019, the Chilean protests lacked
visible leaders and clear demands, fueled by a diverse middle-class sector that felt
increasingly alienated by growing disparities in wealth, persistent corruption, and the
privatization of essential services. Protesters were said to be primarily young, educated, and
frequent social media users (Cox et al., 2019). The present paper provides novel evidence and
a more refined picture of the protesters.

2.2. Data

Survey. Our analysis is based on the Estudio Longitudinal Social de Chile (ELSOC), a nationally
representative survey of the Chilean population aged 18–75, based on 92 communes of the 13

7 Lower-income individuals underestimate their rank and, if made aware of it, increase their support
for redistribution (see Cruces et al 2013, for Argentina; Hvidberg et al 2021, for Denmark; Hoy and
Mager 2021, using data on ten countries; Albacete et al 2022, for Austria). Somewhat symmetrically,
those who’s relative position improves decrease support (Karadja et al 2017, for Sweden).

 6
regions of Chile. The dataset contains detailed information on individual and household
characteristics including socio-demographic variables, income, detailed occupation, as well
as subjective information on well-being, redistributive preferences and political views. The
ELSOC survey was designed by the Center for Social Conflict and Cohesion Studies (COES)
and, for this reason, is uniquely oriented towards measures of social cohesion and conflict in
Chile, including social relations, institutional trust, political participation and, most
importantly, protest participation (in various forms). This dataset is publicly available but
remains relatively underutilized. It is nonetheless recognized as a reliable and robust data
resource in economics and political science, for instance to mobilize subjective data (Schleef
et al., 2024), to study the link between social status and occupational prestige (Requena and
Figueroa, 2019), or to examine geographical correlation between past repression and
democratic outcomes (Bautista et al., 2019; Bourret-Soto, 2024).

Panel and Selection. Although six rounds of this longitudinal survey are available (starting
2016), we primarily use the wave corresponding to the 2019 protests, along with individual
characteristics from the previous year obtained thanks to the panel dimension. Our selection
process first involves removing observations with missing values for key variables
(approximately 5% of the initial sample) and then focusing on the working population
(retirees and students account for 16% of the original sample). This selection is simply due to
the fact that we analyze protest behavior in relation to a differential measure between of
perceived versus actual status, whereby the latter is assessed through employment-related
variables, such as income level and occupational prestige, as detailed below. Our final
sample comprises 2,277 individuals observed in both 2018 and 2019 (with a 15% attrition rate
between the two years).

2.3 Protest Outcomes

Protest Behavior and Protest Statistics. Our key outcome variable is protest participation,
defined as a binary indicator of whether an individual engaged in protests over the past 12
months. In sensitivity analyses, we explore individual protest frequency and other forms of
social unrest: from softer (e.g., social media activism) to stronger ones (tolerance toward
violence); intermediate actions include street protests (our baseline) and banging pots and
pans as a collective expression of dissent (the sound of cacerolazos became a symbol of unity
and resistance, allowing mass participation without requiring physical presence in protests).
The 2019 Chilean protests were unprecedented in both scale and frequency compared to
previous movements. Between October 18 and the end of 2019, the COES recorded over
3,300 protest events—a stark contrast to 2011, the previous peak year, which saw only 1,100
protests, roughly a third of the 2019 total (Joignant et al., 2020). Regarding protester

 7
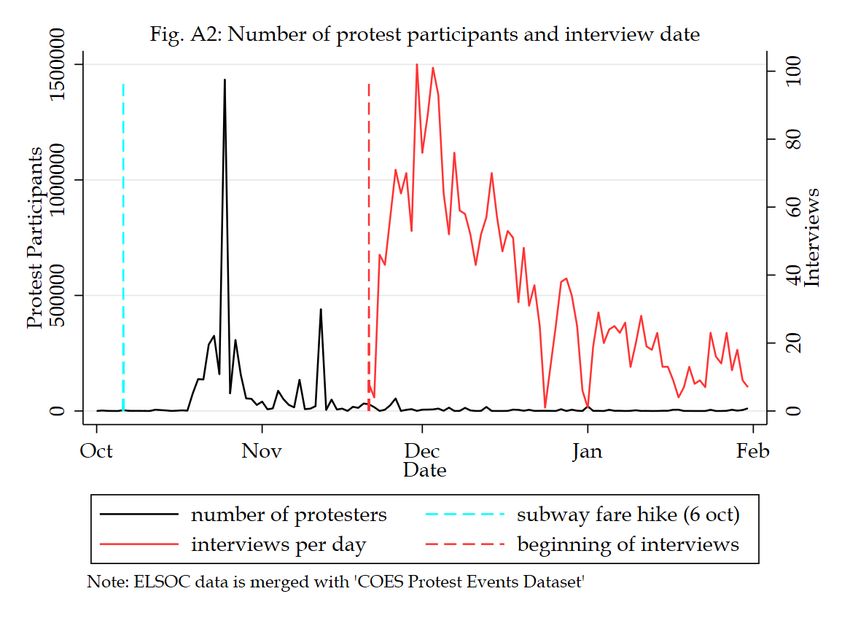
numbers, we can directly examine statistics derived from our 2019 sample. Appendix Figure
A1 shows that 25% of individuals in our sample took part in the protests—a figure that
aligns well with official COES estimates. Notably, around 80% of these participants were
"new" protesters, highlighting the exceptional mobilization in 2019.

Timing of Events and Interviews. For 2019, most protests took place before the survey
interviews, ensuring that our ELSOC sample captures protest behaviors relatively accurately.
This is illustrated in Appendix Figure A2, which compares the daily density of protests,
based on COES data, with the daily distribution of interviews in the ELSOC survey.
However, as precise protest participation dates are not available, we cannot determine the
exact time elapsed between an individual's participation and their interview. Nevertheless,
this limitation does not fundamentally affect our analysis. More importantly, the number of
times a person protested during the October-November 2019 period is available and
provides a useful measure of protest intensity, which we incorporate into our sensitivity
analyses alongside the other previously mentioned measures (such as social media activism,
justification of violence, etc.).

Protester Description. In our main estimations hereafter, we focus on the 2019 protest wave,
as it was by far the largest. This also allows us to assess the predictive power of the lagged
social gap, or of the social gap dynamics over several years before the 2019 events. Our
empirical strategy avoids using panel estimations over the entire period covered in ELSOC
because protests were concentrated in 2019 while protests of the previous years were more
marginal and possibly driven by more specific individuals (we address this distinction in our
robustness checks). We rather aim to characterize what drives the outstanding large event of
2019. We provide an initial characterization of protesters, with simple estimations reported
in Appendix Table A1. We begin with logit estimations of the 2019 protest dummy (column
1). Among the significant correlates, we confirm that protesters were slightly younger on
average and more educated.8 Additionally, indigenous individuals had a 25% higher
likelihood of participating. As we discuss in greater detail later, income matters: protesters
tended to belong to the middle and upper-middle class. They were more frequently found
among both the unemployed and formally employed workers. We further refine our analysis
using a multinomial logit model to distinguish between new protesters (column 2) and those
who had protested at least once before (column 3). While age, education, and income tend to
play in the same direction across both groups, some differences emerge: for instance,

8 A 10-year increase in age corresponds to a 7-percentage-point lower probability of protesting,
approximately one-quarter less than the mean protest probability (27%). Education also plays a key
role: individuals with lower education levels were three times less likely to protest.

 8
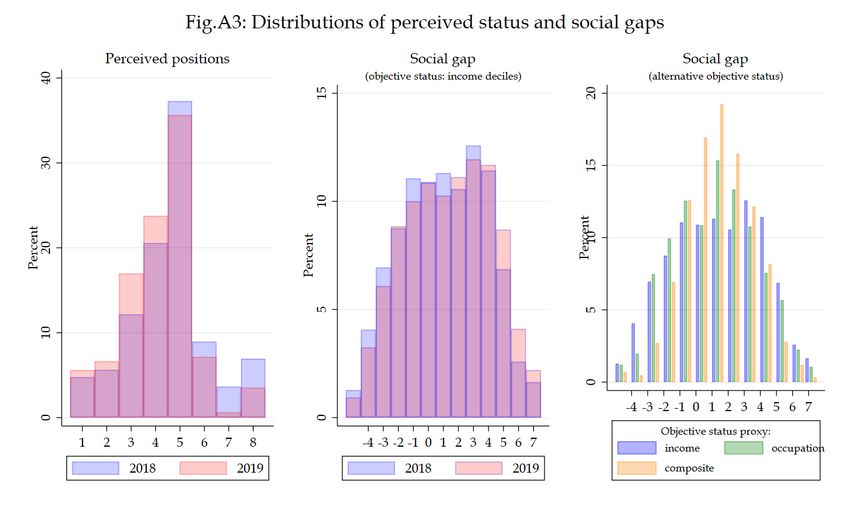
indigenous individuals were more likely to be repeated protesters, whereas the unemployed
were more likely to be new protesters. Our main estimations will allow us to go further by
correlating protests with redistributive views, concerns about the cost of living, and, most
importantly, our social gap measure.

2.4 Social Gap

As motivated before, leveraging subjective measures is crucial to capturing the social
dynamics underlying political engagement, particularly protest behavior. We construct a
measure of social frustration, referred to as the ‘social gap,’ defined as the difference between
a person’s objective social status, based on alternative indicators (income, occupational level,
etc.), and her subjective/perceived social status. We now detail these two components.

Subjective Social Rank. The ELSOC dataset includes a question on perceived social rank,
formulated as follows: "In our society, some groups are usually at the higher levels, while others
tend to be placed at the lower levels. Using the presented scale, where 0 represents the lowest level and
10 the highest, where would you place yourself in Chilean society?".9 The distribution of perceived
social ranks is reported in the first graph of Appendix Figure A3. It reveals that very few
individuals position themselves at the extremes (with rank 0 merged with rank 1 and ranks
9-10 grouped into rank 8 for visualization), while the majority cluster around ranks 3-5. This
pattern reflects a systematic misperception towards the center, commonly referred to as
"center bias" (Hvidberg et al., 2020; Bublitz, 2022; Cruces et al., 2013; Karadja et al., 2017),
"median bias" (Hoy and Mager, 2021) or "middle-class bias" (Fehr et al., 2022). These biases
are well-documented in these studies on voting behavior, redistributive preferences, or
perceptions of social mobility. A key implication of this high concentration is that perceived
social rank alone is unlikely to be a strong explanatory variable for protest participation.
However, the gap between subjective and objective rank may hold greater explanatory
power, serving as a proxy for social frustration and perceived downward mobility. Notably,
Figure A3 (first graph) shows a slight decline in subjective rank in 2019 compared to 2018,
coinciding with rising social discontent during the protest period. However, we caution
against interpreting this shift as a causal driver of protests due to potential reverse
causality—individuals exposed to protests may have reassessed their social rank downward.
We return to this issue later in the analysis.

Objective Social Rank. Assessing social status is challenging. It is possibly multi-
dimensional, with context-dependent weights assigned to the different dimensions. Since all

9 A few studies use similar measures, for instance Bussolo et al. (2021) focus on individual beliefs
about inequality as proxied by the person’s perceived position on the income distribution. They find
that it is negatively correlated with support for reducing inequality.

 9
these parameters are broadly unknown, we simply use alternative proxies for objective
status, which help test the sensitivity of our results throughout the following analyses. A
first, standard measure is income decile. While income alone does not fully capture social
status, it reflects multiple dimensions of socioeconomic position. However, Bourguignon
(2006) and Goldthorpe (2012) argue that an overemphasis on economic indicators may lead
social scientists to overlook other critical aspects of social inequality that income alone fails
to capture. To address this, our second option is to consider occupational prestige, a widely
recognized dimension of social standing. We use the Erikson-Goldthorpe-Portocarero (EGP)
classification (Erikson et al., 1979), described in Table A2, though our findings remain
consistent across alternative occupational ranking systems. Finally, a third approach
integrates multiple dimensions into a composite measure, calculated as the average of
income decile, EGP occupational prestige, and education level, each normalized on a 1-10
scale (following Adler et al., 1994). This composite measure provides a broader view of social
status beyond any single factor.10 Note that while income is available all years, information
on occupation is only available in 2016 and 2018.

Social Gap. The social gap is defined as the difference between objective and subjective
social status. For our estimations of protest behavior later on, we will use a standardized
measure of the social gap to interpret more easily the magnitude of its effect. For
visualization purposes, in the second graph of Figure A3, we use natural scales for both
objective and subjective status. To enhance clarity, we also regroup the few extreme
observations. Objective status is defined here according to income deciles. We observe a
social gap ranging from -4 to 7, displaying more variability than the distribution of subjective
ranks before. This social gap reflects the discrepancy between individuals’ actual position
and their perceived place in the social hierarchy. Highly positive (negative) values indicate
an underestimation (overestimation) of one’s actual status. Values near zero, either positive
or negative, denote smaller misperceptions. Yet, it is evident that zero itself cannot be
interpreted as a perfect alignment of perceived status with one's actual position.11 Given that
subjective ranks tend to fluctuate more rapidly than objective ones, we expect the social gap
to increase in 2019 compared to 2018, as subjective rankings decline slightly. This pattern is
confirmed in Figure A3 (second graph). Alternative measures of objective status lead to a

10 According to the literature in sociology, psychology, epidemiology and public health, income,
occupation status and education represent the material substance of social class and shape the life-
trajectories of individuals in profound ways (Adler et al., 1994, Kraus et al 2013).
11 Indeed, objective and subjective scales are not comparable, partly because subjective status question

is framed more broadly.

 10
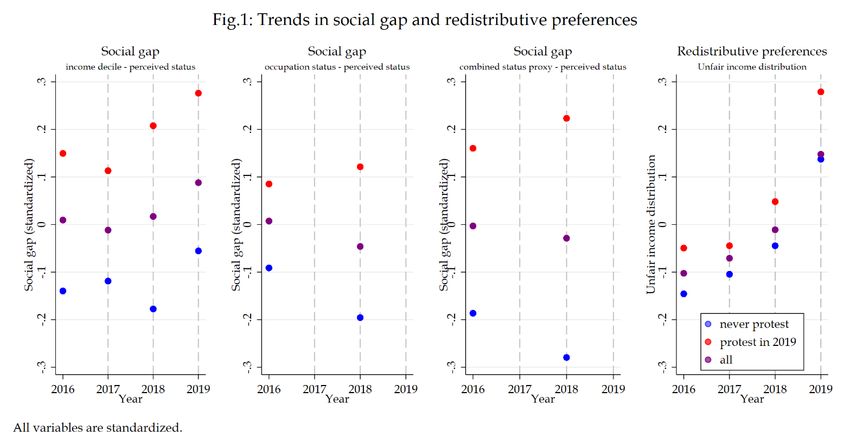
slightly more concentrated distribution, especially when education is used in the combined
index (third graph).

Time Trends. We hypothesize that a large social gap contributes significantly contributes to
protest participation. To illustrate this intuition, Figure 1 presents a series of graphs first
depicting trends in the social gap. The gap is now standardized and alternatively defined
using income, occupation or the combined measure for objective status (graphs 1-3). Recall
that we can calculate social gaps only for years 2016 and 2018 when occupation is used
(alone or in the composite measure). Each graph differentiates between those who never
protest in 2016-2019 (blue), those who protest in 2019 (red) and the overall sample (purple).

The first key observation is that protesters exhibit a higher level of social frustration, as
measured by the social gap, while non-protesters show a lower level. These broad statistics
anticipate our main results, which are further developed in the next section. Secondly, the
social gap increases between 2017 and 2019 among 2019 protesters, whereas for non-
protesters, the trend is declining (over 2016-18). These initial statistics suggest that
individuals who feel increasingly misaligned with their actual economic rank are more likely
to engage in protests, reinforcing the role of perceived social status in shaping political
mobilization. We also compare these patterns to trends in redistributive preferences (fourth
graph), based on a question about perceived income distribution unfairness. Unlike the
social gap, this measure shows a continuous increase across all groups (protesters and non-
protesters), indicating growing social discontent with inequality in the years preceding the
2019 events. However, much like the self-focused concern captured by the social gap, the

 11
divide between protesters and non-protesters widens over time. These findings suggest that
a growing perception of relative social decline, potentially coupled with increasing
discontent over inequality, could serve as an early warning signal for protest mobilization.

2.5 Empirical Approach

Our empirical analysis begins by outlining the characteristics of protesters. We particularly
focus on their position within both objective status scales (i.e., income deciles or occupational
levels) and subjective ranks, as well as along the social gap scale to show the relevance of this
measure. We also present a series of non-parametric estimations aimed to further validate
the informational relevance of the social gap. We demonstrate that detailed values of the
social gap provide significant informational content beyond detailed positions along income
or occupational scales. As explained, we systematically use the lagged gap. We refrain from
using the contemporaneous social gap, as it is recorded post-protest (see Figure A2) and may
be affected by exposure to protests (Madestam et al., 2013).

We then turn to more parsimonious estimations, with a linear specification of the (lagged)
social gap, to assess its role and the contribution of social gap dynamics the years before 2019
events. We also identify heterogeneous effects and check results with alternative protest
outcomes (including soft versus violent forms of protests and, for all those outcomes, an
intensive margin of the frequency of participation). Finally, we refine our interpretations and
test the sensitivity of the social gap effect by incorporating factors that can be seen as other
key determinants of protest. The general model is written:

 = 0 + 1 −1 + 2 ′ + 3 ′ + 4 + 5 ′ (1)

with denoting our main protest variable (equal to 1 if individual i participated in
protests at least once during year t=2019, and 0 otherwise). −1 denotes the lagged social
gap. As in basic descriptive estimations before, we use contemporaneous controls
including socio-demographic variables (gender, age, education, married, region of
residence), household income and broad employment variables (unemployed, informal
worker, with formal worker or inactive as reference group). Perceived social rank, or its
discrepancy with objective social standing, likely integrates multiple factors beyond these
characteristics, including living conditions, peer effects, and social preferences. To account
for living conditions, we incorporate a vector , which comprises an individual’s
anger about the cost of living and self-evaluation of public goods and services. The social gap
inherently depends on social comparison, so we introduce , a binary variable
indicating whether the person’s peers, friends or family participated in the 2019 protest.
Subjective relative status has been shown to influence perceptions of unfairness and
redistributive preferences (e.g. Cruces et al 2013; Kuziemko et al., 2014; Fisman et al. 2020;

 12
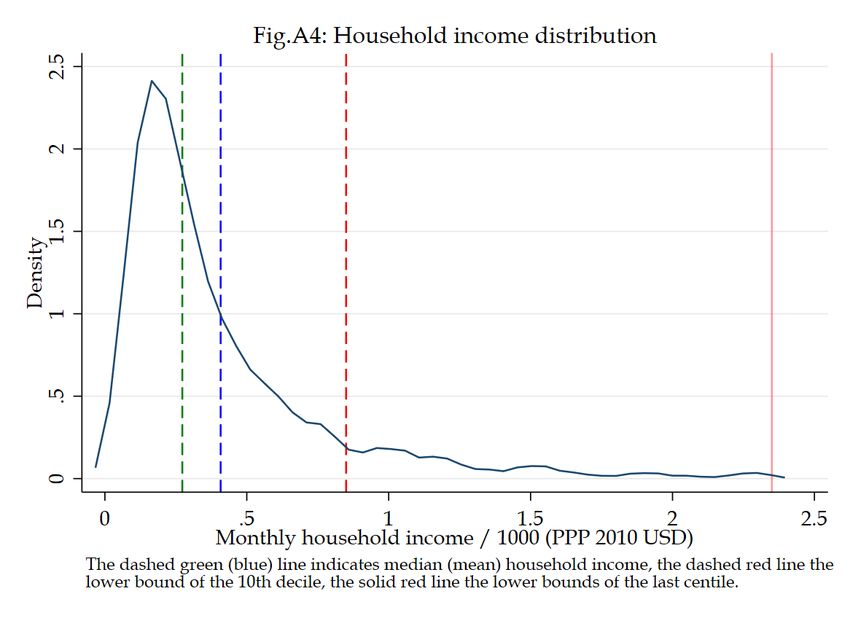
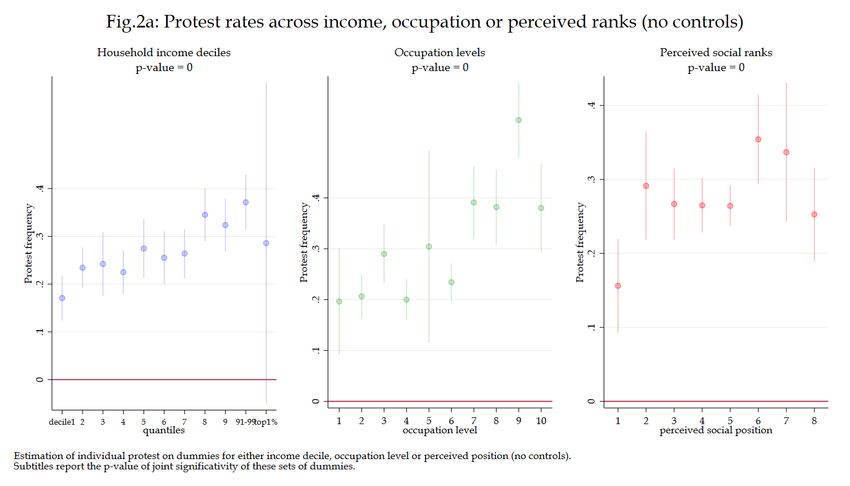
Hvidberg et al 2021; Hoy and Mager, 2021; Albacete et al., 2022). To isolate the pure effect of
social rank misperception, we then control for a vector , which includes unfairness
feelings and political views. For unfairness, we alternatively use information on one’s anger
about ongoing inequality, perceived unfairness of income distribution, or perceived
unfairness of the tax system. Regarding political views, we account for individual
preferences for democracy (over authoritarianism) and perception about the extent of
corruption issues in Chile. This more comprehensive specification enables us to determine
whether our social gap measure directly influences the propensity to protest or primarily
serves as a mediator shaping perceptions and emotions related to inequities in Chile.

3. Results
3.1 Protests by Levels of Objective Status, Subjective Status and Social Gap

Objective and Subjective Ranks. The analysis of protester distribution across economic and
social strata provides key insights into the socioeconomic backgrounds of those most likely
to engage in demonstrations. Figure 2a presents non-parametric estimates of protest rates
based on dummies for income levels (deciles), occupational levels (1-10 scale), or perceived
social ranks (simplified 1-8 scale grouping the extremes as in the first graph of Figure A3).
Across all three dimensions, a consistent pattern emerges: protest participation tends to
increase with socioeconomic rank, albeit not in a strictly monotonic manner. Increasing
trends align with established research suggesting that socio-economically disadvantaged
individuals participate less in political activities (e.g., Solt, 2008). Interesting, we show here
that this pattern holds for both objective status (income, occupation) and subjective
perceptions of status. Also, while protest rates generally rise with income, occupation, and
social rank, they tend to decline slightly at the very top, though this often affects a very small
minority. For income specifically (first graph of Figure 2a), the highest group consists of the
top 1%, who demonstrate less frequently than the group just below them (i.e., the 91st–99th
centiles). The top 1% is likely highly heterogeneous, and the very wealthy within this group
are probably underrepresented in the data, meaning their actual participation rate could be
even lower with improved representation. Importantly, the 91st–99th centiles should not be
considered "rich" in absolute terms. Household income distribution data, reported in
Appendix Figure A4, shows that the threshold separating the 99th and 100th centiles is
approximately PPP US$ 2,300 per month. Overall, we conclude that protest participation is
highest among the middle class (deciles 2–7) and even more pronounced in the upper-
middle class (deciles 8–9–10, excluding the top 1%).

 13
14
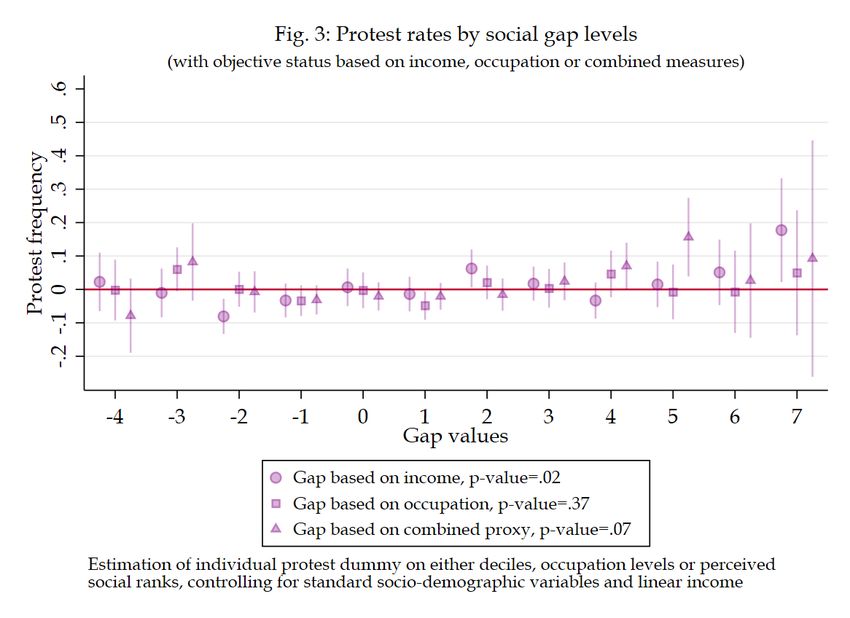
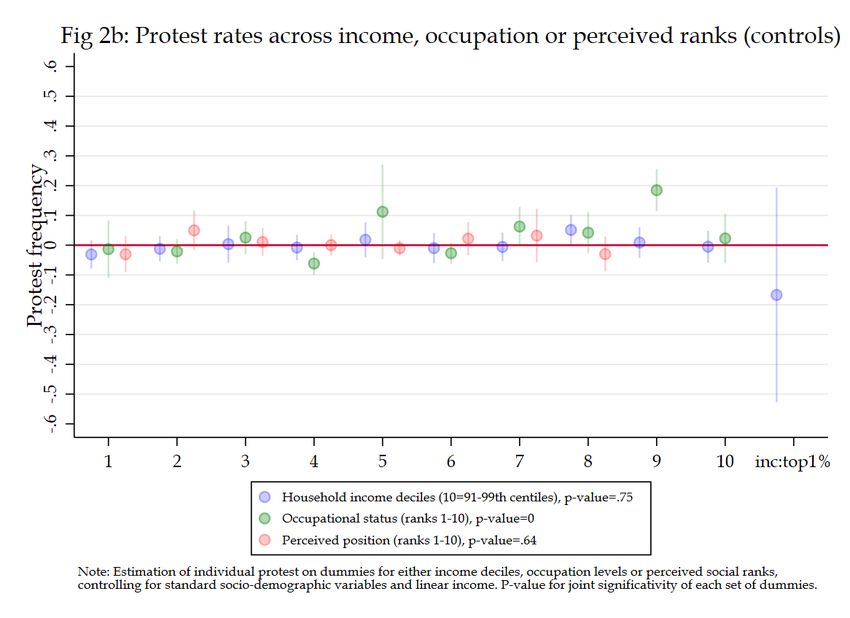
These three sets of non-parametric estimations are replicated while introducing controls for
socio-demographic characteristics (gender, age, education, marital status, and region of
residence), linear household income and broad employment categories (unemployed,
informal worker, with formal worker or inactive as the reference group). The corresponding
results are presented in Figure 2b. Controlling for linear income, in particular, reduces the
informational value of detailed ranks, as confirmed by p-values rejecting the contribution of
these sets of dummies (for income deciles and perceived social rank).

Social Gap Levels. This outcome is unsurprising given the relative linearity of the income
gradient observed earlier and, in the case of perceived status, its previously noted high
concentration. However, combining objective and subjective status seems relevant. In Figure
3, we estimate protest participation on social gap levels—measured using income deciles,
occupational levels, or a composite index (income, occupation, education) for objective
status—while maintaining the same set of controls (socioeconomic factors, linear income,
and broad employment categories). Results indicate a clear increasing pattern, with p-values
not rejecting the contribution of a flexible specification of the social gap, regardless of the
objective status metric used, beyond socio-economic controls and linear income in particular.
Specifically, negative social gap values (i.e. overestimation of one’s status) are associated
with zero protest rates, whereas highly positive social gap values correspond to the highest

 15
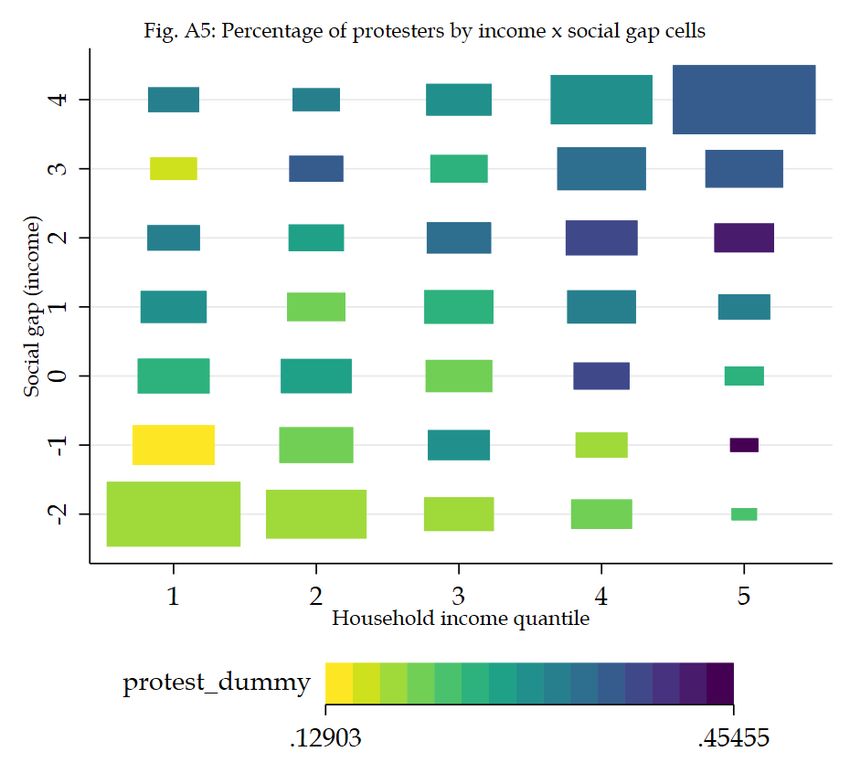
propensity to demonstrate (conditional on control variables). These findings reinforce our
hypothesis that perceived social misalignment is a key driver of mobilization. We can further
refine our characterization by examining the interaction between social gap values and, for
instance, income levels. Appendix Figure A5 presents a heat map illustrating protest
participation rates across different income-social gap combinations. To ensure visual clarity
and avoid excessively small cells, we categorize observations into five income quintiles and
seven social gap groups. The size of each cell is proportional to the weight of the
corresponding income-gap group in the dataset. The figure reveals a consistent pattern: at all
income levels, including among lower-income groups, a higher social gap is associated with
increased protest participation.

Statistical Tests. In Table A3, we present a series of non-parametric estimations designed to
further validate the informational relevance of the social gap. We estimate several flexible
models of the 2019 protest outcome, progressively introducing different sets of variables. We
begin with a baseline model that includes standard socio-demographic and employment
controls but excludes linear income (column 0). We then add income decile dummies (column
1). In addition to income deciles, we introduce either perceived rank dummies (column 2),
social gap dummies (columns 3–5), or an interaction between income decile dummies and
social gap dummies (column 6). Panel (a) focuses on linear probability models, primarily
used to test the joint significance of different sets of dummies (income deciles, perceived
ranks, etc.). Panel (b) presents log-likelihood tests from logit estimations of nested models,
especially to test models 2-6 against model 1. Both approaches lead to the same conclusions.
Income deciles alone do not significantly improve the model when basic controls—
particularly education—are included, as shown in column 1. As expected, adding perceived
status ranks (column 2) does not enhance explanatory power, as indicated by large p-values
in both types of tests. However, incorporating social gap values (columns 3–5) into a model
that already includes basic controls and income decile dummies significantly improves the
fit (p-values = 0, regardless of the occupation status measure used to construct the social
gap). The model interacting social gap values with income deciles—mirroring the insights
from the heat map—provides the strongest explanatory power. Yet, its adjusted R² is lower
than that of the more parsimonious models based on social gap values.

3.2 Estimation Results: Baseline, Dynamics, Alternative Outcomes and Heterogeneity

In the following, we precisely employ a parsimonious model of protest, using a linear
specification of the social gap alongside standard controls, including socio-demographic
factors, household income, and employment variables, as specified in equation (1).

 16
Baseline. Baseline results are reported in Table 1, with a focus on the social gap coefficient,
while other (unreported) coefficients are very similar as in Table A1, as previously
commented. Models (1)–(3) correspond to the three alternative occupational status measures
used to construct the social gap. Since the gap is standardized, the coefficients are easily
interpretable: a one standard deviation increase in the social gap is associated with a 3.4 to
5.4 percentage point increase in protest frequency across models. This corresponds to a 12–
19% rise in protest participation or an 8–12% increase in the standard deviation of protest
frequency (see relative effects in the lower rows of the table). This magnitude is substantial
and, as we shall see, does not weaken when adding closely related psychological factors that
potentially contributes to protests as well (such as anger over living costs and perceived
inequality). Furthermore, very similar results are obtained when replacing or complementing
(continuous) income with (continuous) occupational status in the model, or when specifying
the social gap in a logarithmic form.

Dynamics. We also examine specifications that incorporate the dynamics of the social gap.
Model (4) uses the 2017 social gap level and its change over 2017–2018 (using income as the
objective status). Both factors contribute to protest participation: the level of social frustration
two years prior to the protests and its reinforcing dynamics over 2017–2018. This pattern
aligns with the discussion around Figure 1 and the idea that a wave of discontent had begun
to grow and is effectively captured by our measure.12 Model (5) further introduces the
change in the social gap between 2018 and 2019, but this does not produce additional
significant effects—suggesting that frustration may have already peaked. This does not
necessarily alleviate concerns about reverse causality, particularly if effects operate in
opposite directions: in other words, social frustration might have declined at the time of the
2019 survey due to the cathartic effect of the protests that had just taken place. However, this
does not hinder our analysis, as the overall magnitude of the total effect remains unchanged.
If we compute relative effects, assuming a one standard deviation increase in the 2017 social
gap that persists in 2018, we observe, as reported, an increase in protest frequency of 15–18%
across models (or a 10–12% increase in the standard deviation of protest frequency).

12It also relates to the theoretical work of Correa et al. (2025), according to which large sudden
increases in grievances coordinate behavior far more effectively into protests than a sequence of small
grievance shocks that generate the same final distribution of grievances in society. The authors
provide an empirical illustration for different waves of protests in Chile including 2019, showing that,
even after controlling for grievance levels, large grievance shocks increased the number of protests.
Our empirical strategy is different but confirm these findings.

 17
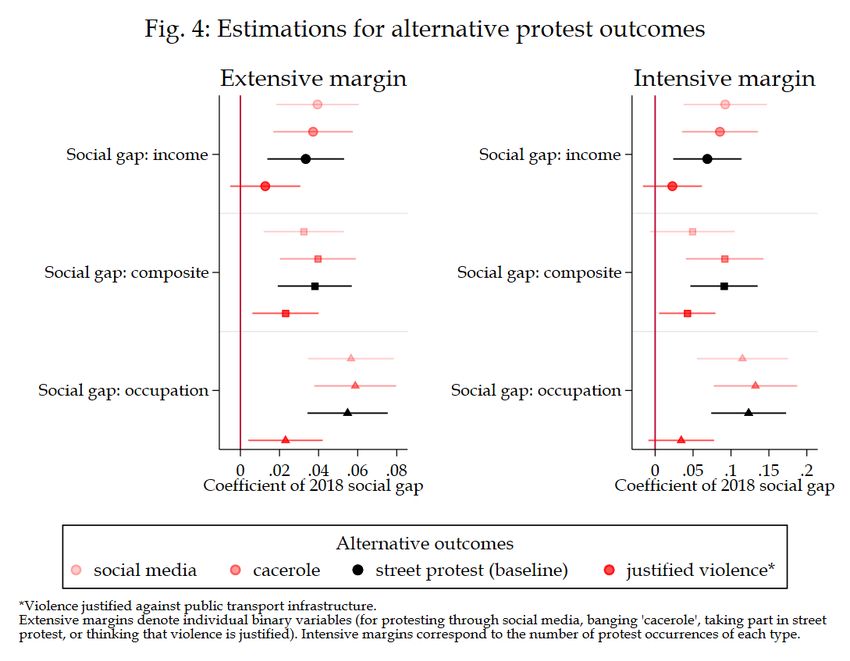
Tab. 1: Baseline estimations and dynamics
Dep. var.: 2019
 Baseline Dynamics
Protest frequency

Objective status
 Income Occupation Composite Income Income Income Occupation Composite
used for social gap:

 (1) (2) (3) (4) (5) (6) (7) (8)

Social gap, 2018 0.034*** 0.039*** 0.054***
 (0.011) (0.010) (0.010)
Social gap, 2017 0.043*** 0.053***
 (0.016) (0.019)
Change in Social gap, 0.026* 0.039**
2017-18 (0.014) (0.019)
Change in Social gap, 0.016
2018-19 (0.015)
Social gap, 2016 0.050*** 0.030* 0.072***
 (0.016) (0.016) (0.018)
Change in Social gap, 0.029** 0.046*** 0.060***
2016-18 (0.014) (0.015) (0.017)
Relative effects of: +1 s.d. in 2018 social gap +1 s.d. in all-year social gaps
in % mean protest 12% 13% 19% 15% 18% 17% 10% 25%
in % s.d. protest 8% 9% 12% 10% 12% 11% 7% 16%
# obs 2110 2110 2110 1386 1386 1427 1227 1129
R2 0.125 0.128 0.133 0.157 0.158 0.149 0.144 0.150
Adj. R2 0.116 0.118 0.123 0.143 0.143 0.135 0.127 0.132
Note: all estimation control for socio-demographics (male, age, married, education, indigenous), household income, work status,
and region. For models 1-3, we use a common sample (i.e. observations for which income, occupation and perceived ranks are
available) for the sake of comparability. Robust standard errors clustered at individual level and indicated in parentheses.
Significance levels indicated as: *** p
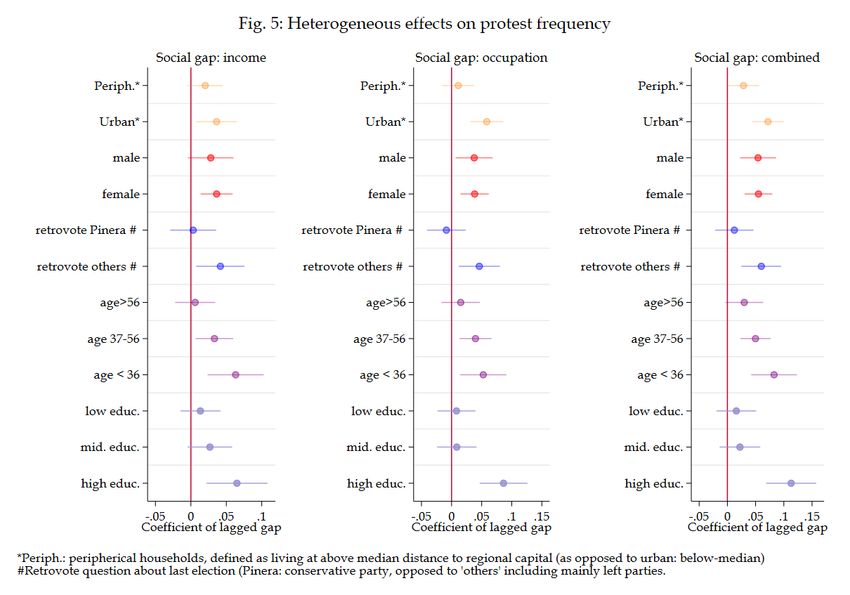
coefficients. This suggests that social frustration, as we measure it, is primarily a driver of
moderate or conventional protest actions, while violent protest may be influenced by
additional factors beyond status concerns.13

Heterogeneity. Unreported estimations indicate that the baseline effect is primarily driven
by social gap differences among individuals who underestimate their life standards (i.e.,
those with a positive gap) and by the contrast between this group and those who
overestimate their life standards (i.e., those with a negative gap), a pattern already evident in
Figure 3. Additionally, we conduct heterogeneous estimations along standard variables, as
presented in Figure 5. Most of the results are consistent across different definitions of the
social gap, indicating stronger protest responses among urban residents, left-wing voters,
younger and middle-aged individuals, and those with higher education levels. While these
findings align with known characteristics of protesters,14 they reinforce the idea that the
social gap is a robust predictor of protest participation across the board, rather than being
confined to specific subgroups among demonstrators.

13 Additional estimations indicate, for instance, that the coefficient difference between violent and non-
violent forms of protest diminishes at high levels of anger over inequality or living costs.
14 For instance, protesters tend to be younger and more educated, as analyzed before. They also exhibit

greater interest in political issues (Verba et al., 1995) and lean toward left-wing or pro-democratic
orientations (Dalton et al., 2010).

 19
3.3 Estimation Results: Adding Key Protest Determinants

To confirm our interpretation of the social gap and how it influences protest participation,
we introduce more standard determinants of protests in the model, and assess their potential
confounding effects. These determinants are introduced sequentially into the baseline model,
following the order suggested by equation (1). Given the psychological dimension of the
social gap, we emphasize that some of these factors carry an emotional component. Notably,
our dataset includes two variables with a relatively original framing as they measure how
angry individuals feel about living costs and inequality. Protests are often understood as
emotional reactions to perceived unfairness (Passarelli and Tabellini, 2017), which can relate
to personal grievances—such as relative deprivation, perceived social status, or living
costs—or to concerns about broader societal injustice, such as inequality aversion. According
to Rhodes-Purdy and Rosenblatt (2021), protests in Chile reflect a "primal outburst of rage
and frustration" triggered by an elitist political structure that has historically stifled
participatory opportunities.

The results are presented in Table 2. The upper panel focuses on estimations where income is
used as the objective status for constructing the social gap, but similar conclusions regarding

 20
the social gap effect are obtained with occupation or the composite measure, as reported in
middle and lower panels (note that other protest determinants also have very similar
coefficients in this case). We begin with the baseline model (column 1), comprising standard
controls (socio-demographic characteristics, income and employment variables), and
introduce the living costs variable, which captures both individuals’ valuation of public
goods and services and their anger over living costs (column 2). Both variables show the
anticipated signs: individuals who rate public services poorly or express frustration over the
cost of living are more likely to participate in protests (note that public services valuation is
not significant in this specification). Controlling for these factors only slightly reduces the
effect of the social gap—the coefficient decreases by 10% but remains highly significant—
suggesting that two sources of self-centered economic grievances, i.e. the gap in perceived
status and concerns over living costs, act as complementary drivers of protest participation.
The social gap depends on one’s status perception, which may inherently relate to some
reference points, while individuals may also be influenced directly by others in terms of
protest behavior (e.g., Acemoglu et al., 2018). To account for a potential co-determination of
these two types of relativities, we introduce a measure of peer influence, namely the protest
participation of friends and family members (column 3). Our coefficient of interest is
marginally affected, indicating that perceived relative status and peer effects constitute
distinct dimensions of other-dependent behavior.

Perhaps the most important set of controls pertains to social preferences. Social frustration
can influence redistributive demands together with other-oriented concerns, such as altruism
or value-driven inequality aversion. Columns (4)–(6) present estimates from a model that
sequentially introduces different measures of perceived unfairness: unfairness in income
distribution, unfairness in the tax system, and anger over inequalities. In all three cases, the
social gap coefficient decreases only marginally, reinforcing the idea that perceived personal
economic standing is distinct from, yet complementary to, broader redistributive concerns,
maybe because these redistributive preferences primarily reflect other-oriented
considerations and a broader sense of unfairness in Chilean society. Finally, political
engagement and protests are not solely driven by redistributive views—they also intersect
with broader political demands. To account for this, we extend our analysis by incorporating
individuals’ political views (column 7). Our findings show that preference for democracy
(over authoritarianism) is strongly associated with protest participation. Concerns over
corruption do not appear significant in this specification but this is primarily due to the
sequencing of variable introductions (as corruption concerns are positively correlated with
perceptions of unfairness and democracy). Most importantly, the coefficient on the social gap
decreases by another 13-15% (across social gap definitions) but remains highly significant

 21
(p=0.02). In other words, the social gap is not entirely determined by protesters’ ideological
alignment: there is enough variation in social frustration among anti-conservative voters to
drive distinct protest behaviors and identify the independent effect of the social gap. Note
finally that similar results are obtained in (unreported) estimations where other political
variables are used, such as support for a new Constitution or trust in the government.

 Tab. 2: Estimations adding key protest determinants
 Dep. var.: 2019 protest dummy
 (1) (2) (3) (4) (5) (6) (7)
Objective status: income
 0.033*** 0.029*** 0.029*** 0.028*** 0.028*** 0.029*** 0.024**
Social gap, 2018
 (0.010) (0.010) (0.010) (0.010) (0.010) (0.010) (0.010)
Public good valuation -0.041 -0.045* -0.046* -0.045* -0.045* -0.041
 (0.027) (0.026) (0.026) (0.026) (0.026) (0.026)
Anger at life cost 0.070*** 0.066*** 0.062*** 0.062*** 0.034*** 0.057***
 (0.010) (0.010) (0.010) (0.010) (0.013) (0.010)
Peers protest 0.184*** 0.182*** 0.181*** 0.179*** 0.177***
 (0.017) (0.017) (0.017) (0.017) (0.017)
Unfair: income differences 0.024** 0.018*
 (0.011) (0.011)
Unfair: tax system 0.016**
 (0.007)
Anger at inequalities 0.043***
 (0.012)
Support democracy 0.100***
 (0.017)
Corruption issue 0.058
 (0.038)
# obs 2295 2295 2295 2295 2295 2295 2295
R2 0.128 0.143 0.172 0.174 0.174 0.177 0.186
Objective status: occupation
Social gap, 2018 0.037*** 0.036*** 0.034*** 0.033*** 0.032*** 0.032*** 0.027***
 (0.010) (0.010) (0.010) (0.010) (0.010) (0.010) (0.010)
# obs 2062 2062 2062 2062 2062 2062 2062
R2 0.127 0.147 0.177 0.180 0.179 0.182 0.191
Objective status: composite
Social gap, 2018 0.058*** 0.053*** 0.049*** 0.048*** 0.048*** 0.048*** 0.040***
 (0.011) (0.011) (0.011) (0.011) (0.011) (0.011) (0.011)
# obs 1990 1990 1990 1990 1990 1990 1990
R2 0.130 0.149 0.178 0.181 0.180 0.183 0.195
Note: estimation of 2019 protests, controls including socio-demographics (male, age, married, education, indigenous),
household income, broad employment information (unemployed, informal worker, ref: formal worker & inactive) and region.
Robust standard errors clustered at individual level and indicated in parentheses. Significance levels indicated as: *** p
You can also read