Diversity of Skills and Collective Intelligence in GitHub - arXiv
←
→
Page content transcription
If your browser does not render page correctly, please read the page content below
Diversity of Skills and Collective Intelligence in
                                                               GitHub
                                                                  Dorota Celińska-Kopczyńska
arXiv:2110.06725v1 [cs.SI] 13 Oct 2021

                                                              Institute of Informatics, University of Warsaw

                                                                          October 14, 2021

                                                                                 Abstract
                                                    A common assumption suggests that individuals tend to work with
                                               others who are similar to them. However, studies on team working and
                                               ability of the group to solve complex problems highlight that diversity
                                               plays a critical role during collaboration, allowing for the diffusion of in-
                                               formation. In this paper, we investigate the patterns behind the connec-
                                               tions among GitHub users in Open Source communities. To this end, we
                                               use Social Network Analysis and Self-Organizing Maps as the similarity
                                               measure. Analysis of textual artifacts reveals the roles of those connec-
                                               tions. We find that diversity of skills plays an essential role in the creation
                                               of links among users who exchange information (e.g., in issues, comments,
                                               and following networks). The connections in networks related to actual
                                               coding are established among users with similar characteristics. Users
                                               who differ from the owner of the repository report bugs, problems and
                                               ask for help more often than the similar ones.

                                         1    Introduction
                                         Open Source is more than the type of a license; it turned into a social move-
                                         ment that integrates developers with common purposes within communities.
                                         The interactions within communities form structures – networks. In real-world
                                         networks, connections are rarely established or maintained because of purely
                                         random factors. Usually, one can find patterns describing connections (edges)
                                         among agents (nodes). They can be generalized under terms homophily, if the
                                         agents bond with others of a similar sort, or heterophily, if otherwise.
                                             Extensive research has been conducted on the role of homophily on link
                                         establishment in various networks, both informal (e.g., family ties or friend-
                                         ship) and formal (organizational environments) [MSLC01]. There is a consensus
                                         among researchers that homophily is a crucial factor in fostering links in informal
                                         setup [LM54, Mar88, Lin01]; however, the results are ambiguous when it comes
                                         to organizational structures [Bur05, Lou08]. On the one hand, homophily leads
                                         to more effective communication because similarities among individuals reduce

                                                                                     1
the coordination costs. Participants may assume that they possess a common
knowledge background. On the other hand, heterophilic connections give access
to a diversity of ideas because different agents process the same information
packages differently. That, in turn, enhances possibilities for finding optimal
solutions.
Research on Open Source often focuses on the organizational and motiva-
tional aspects of software development’s major tasks [LvH03]. Researchers tend
to investigate the output in the form of contributed source code [FGBM14,
VPR+ 15, LRM14, MBPG14, DSTH12, TDH14]. However, collaboration in the
successful project requires not only exciting and captivating but mundane and
necessary tasks, e.g., bug-fixing, bug-reporting as well. Interestingly, those as-
pects of collaboration are rarely examined.
Studies of diversity among GitHub users are limited. Authors either inves-
tigate traditional assortativity or rich-club coefficients [LRM14] or analyze the
possible gender discrimination [TKM+ 17], the impact of female participants on
overall productivity [VPR+ 15] or cultural (nationality) differences [ODC+ 17].
Although Vasilescu et al. [VFS15] surveyed developers on the perceptions of di-
versity within GitHub teams, addressing the problem of tenure and experience
diversity, there has been no generalized empirical study inferring similarity from
software production-related characteristics. We want to fill that gap.
This article analyzes whether GitHub users establish homophilic or het-
erophilic connections and what roles in project development those connections
play. We start with a traditional one-dimensional Social Network Analysis
of node degrees. We discuss assortativity measures and rich-club coefficients.
Next, we conduct a multidimensional analysis of the characteristics of develop-
ers. We apply this analysis results to data on communication among developers
to investigate the roles of the different clusters of links. We show that hetero-
geneity of community members enhances the task-solving abilities of the team.
By team-working, participants who possess different informational assets can
compensate for their shortcomings. This way, we provide empirical proof of the
presence of collective intelligence phenomena in GitHub.
2 Related work
Collective intelligence is a form of universal distributed intelligence arising from
the collaboration and competition of many individuals. It measures the team’s
ability to solve complex tasks [Lev97, Sur05, Sal12]. The different information
packages are processed by individuals through social interactions, eventually
leading to providing the solution to a problem.
Open Source communities form meritocracies. Members of the community
collectively solve problems related to projects development. Heylighen [Hey99]
describes the process of collective problem-solving by the aggregation of mental
maps. Mental maps are individual constructions based on subjective preferences
and experiences. Each individual can explore their mental map to develop a
proposition that creates part of the solution. Assuming that the individuals are
2similar, we may expect their mental maps to be similar, too. However, a group
consisting of identical members does not benefit from synergy: it is equal to
its best member, where all of them are perfect substitutes. Group members’
synergy increases the chances of finding the optimal solution and increases the
group’s collective intelligence. Here, we notice that the possibilities for the Open
Source community’s success emerge from the underlying collective intelligence
within teams.
Finding evidence for collective intelligence phenomena is closely related to
research on group task-solving. No matter the organizational environment (in-
formal or formal one), there are three generally accepted analytical frameworks
regarding team construction: similarity attraction theory (SA) [Byr71], social
identity and social categorization theory (SIC) [Taj82], and information pro-
cessing theory (IP) [SP78]. SA postulates that people tend to work with others
of similar characteristics in terms of values, beliefs, and attitudes to them (ho-
mophilic relationships, “birds of a feather flock together”). According to SIC,
teamwork occurs among members of a given (self-categorized) group. SA and
SIC imply negative consequences of diversity on group performance.
On the contrary, IP favors heterophily. In certain conditions, large, diverse
groups can achieve better results than any individual in the group. The wis-
dom of crowds effect is claimed to be based on diversity, independence, and
aggregation [Sur05]. Diversity among people usually refers to differences in de-
mographic, educational, and cultural backgrounds, which eventually leads to
differences how people represent and solve problems.
Collective intelligence focuses on the positive aspects of synergy, but the ag-
gregation of knowledge is troublesome. There may be situations when collective
efforts fail [Sun06]. Groups are prone to reputational or confirmation biases.
When team members think similarly, they may stick to accepted and typical so-
lutions, instead of finding better, non-conventional ones. In extreme situations,
if one of them errs, they cannot notice it; instead, the error may amplify.
2.1 Team-work in GitHub
Every GitHub’s registered user has their site that integrates social media func-
tionality directly with code management tools [MDH13]. Each user’s profile
contains public information about their biographical characteristics (e.g., the
optional description of a location, employer, personal site, and e-mail address),
the list of public repositories, and the number of followers as well as the number
of people the user follows. Everyone, even unregistered users of the service, may
browse the profiles and download the public repositories. The contribution to
the project occurs by sending the patches to the author of the original project
via e-mail or by submitting the pull requests – the proposed changes to the
projects that may be accepted or declined by the maintainers of the project
[Cel16]. If the registered GitHub user wants to commit to the original reposi-
tory, they have to fork the existing repository (create their copy of the source
code). As a result, the user (known as a member) gets access to the complete
source code. The members may introduce their commits (proposed bug fixes
3and changes to the source code) locally but are also allowed to synchronize their
repositories with the state of the original repository.
By default, public repositories in GitHub should be considered Open Source;
the founders decided to support the development of Open Source software pro-
viding free-of-charge hostage for such projects [Wan08]. Even if Open Source is
a collaborative effort (so the team’s synergies take place), much research focused
on individual motivation [CWHW08, DS08, HRS04, HNH03, MB12, OR07,
RHS06]. Generally, Open Source communities are instances of reputation-
reciprocity environments. Reputation among developers’ peers is the measure
of competitive success. Developers’ anticipated increase in reputation resulting
from the number of fixed bugs encourages them to participate in team working
on the Open Source code [HO02, BR06, Ray01, LT02]. Reputation gains do
not motivate all developers equally – Lakhani and von Hippel [LvH03] showed
that peer reputation stimulates “gratifying” technical tasks. However, it is not
an incentive for mundane but necessary tasks, non-negligible in each software
project. Furthermore, Lattemann and Stieglitz [LS05] suggested that reputa-
tion inspires developers rather than bug fixers or managers. In GitHub, proxies
of developers’ reputation and “social status” emerge from the following network
and the starring and watching networks. Popular and influential users have
a large number of followers interested in their coding activity, what projects
they follow or work on [HTSD13, DSTH12, BS16].
Developers expect future gifts in return. The reciprocity as a motivational
factor for developers was reported in various studies [DS08, BL01, LW05].
Lakhani and von Hippel [LvH03] showed that reciprocity encouraged developers
to perform mundane tasks. It is supposed that those who were offered help in
the past are more eager to reciprocate after gaining more experience and knowl-
edge [VKHSW12]. An extreme case is kinship amity [For69, Zei03], according
to which entity involves in altruistic behavior, working in favor of their relatives
and close neighbors without expectation or requirement of the reciprocity.
Contrary to individual motivations, studies on collective intelligence and
diversity in GitHub or Open Source are limited. Daniel et al. [DAS13] in-
vestigated the relationships between diversity and community engagement and
market success. They found that diversity in developers’ reputation and role
enhances market success and community engagement. Diversity of spoken lan-
guage and nationality influences negatively community engagement but has a
positive impact on market success. Vasilescu et al. [VPR+ 15, VFS15] suggested
that increased gender and tenure diversity stimulates greater productivity when
forming a software team.
Since the results on team construction and the roles of different connections
are ambiguous, we have decided to answer the following questions.
RQ1. Do GitHub users exhibit homophily while establishing links?
If so, what are the patterns of homophilic relationships?
SA or SIC suggest homophily; the kinship concept also implies it. Similarities
should decrease the costs of communication. On the other hand, teams work
for the “greater” good (a project), so the differences should be reconciled and
exploited. That is why we want to analyze:
4RQ2. What are the roles of homogeneous and heterogeneous links
in Open Source projects hosted in GitHub?
Finally, since SA and SIC suggest that work-group heterogeneity can lead
to confusion, stress, and conflict [HH07] we want to find:
RQ3. Does the increased diversity in teams affect the sentiment
of conversation negatively?
3 Methods and data
We followed a mixed-methods approach. We started with a statistical descrip-
tion of the networks using traditional Social Network Analysis and multidimen-
sional technique. To assist in interpreting the quantitative findings, we assem-
bled data set on text artifacts, on which we modeled the roles of the connections
among GitHub users in the project development.
3.1 Data on users’ characteristics and relationships
GitHub data is huge, and the service is continuously evolving. Therefore the
complete download of the data is impossible [KGB+ 14, GS12]. To minimize the
number of missing observations, we use a data set combined from three sources:
GHTorrent project [GS12] (dump dated Feb. 1, 2017), GitHub Archive project
[Gri12], and our database obtained by web-scraping GitHub in 2016. Usually,
using GHTorrent should be enough for most of the research activities concerning
relatively big and popular projects [KGB+ 14]. Merging with GitHub Archive
improves the data set’s quality regarding smaller and lesser-known projects.
Merging with scraped data and the API list of the registered users enables a
more robust generalization of the results for the users. GHTorrent does not
update the user table basing on the registrations, but on the public activity,
mostly in the so-far collected projects. Since GHTorrent refreshes all users and
all repositories every few months [Gou], it may take a reasonable time until it
collects new account data. Crucial for our application, GHTorrent also offers
limited possibilities for the qualitative analysis of the collaboration, e.g., text
mining; the original text entries are usually not available.
The data about GitHub’s registered users is publicly available but very dis-
tributed. To combine the data, we used a set of heuristics. GitHub Archive
data in JSON format contained information about the unique id, the same as in
web-scraping data. Data coming from GHTorrent lacked this information, but
we were able to merge records using users’ logins and the registration date. The
standardized timestamps merged the events we used to create networks. We
analyzed six types of social networks: forking, pull requests, issues, comments,
following, and starring. We considered user accounts sharing the gravatar or
using the same login at different times the same user. Thus such accounts were
merged into a single observation using the Find-Union algorithm [CLRS01].
The data we utilize and collect is publicly available. We do not process personal
data, but even if we did, providing such data is not mandatory, the user de-
5Table 1: Number of entries in databases. Scraping, GitHub Archive, and
GHTorrent report on the numbers of entries found before the merging process.
After merging contains data after combining networks, users’ unification, and
limiting the span of registrations
Number of Scraping GitHub Archive GHTorrent After merging
Overall Unique Overall Unique Overall Unique
following relations 7,672,122 31,922 2,654,424 949,881 16,706,738 15,002,195 15,944,720
forking relations 6,935,287 846,693 25,600,929 13,441,444 17,662,591 5,503,106 24,276,564
issues relations n/a n/a 37,389,274 11,857,650 55,471,260 29,939,636 8,239,025
pull requests relations n/a n/a 54,390,705 12,027,388 47,917,259 5,553,942 4,787,584
starring relations 46,583,597 n/a 66,392,262 12,787,360 63,172,922 9,568,020 61,163,902
commenting relations n/a n/a 62,910,591 10,148,954 67,651,808 14,890,171 7,341,043
identified logins (raw) 10,938,114 4,278,933 7,729,951 177,612 16,373,567 6,587,227 8,158,116
identified repositories 10,745,523 2,911,806 47,502,004 34,019,546 10,121,067 2,301,991 29,636,285
Timespan covered 2007-2016 2011-2017 2007-2017 2007-2014
cides – that is why we suppose that the information we collect does not violate
anyone’s consent.
The construction of the final database consisted of two stages. In the first
one,we combined the raw data sets. In the second one, the unification key was
applied to the combined data sets to remove the repeated entries or combine
the information for the computation of the final variables. GHTorrent became
the basis of the merging. In the cases in which network information in three
data sets was available, we merged the scraped data at the end.
The population of this research consists of users of GitHub registered in 2007-
2014, i.e., 10,361,315 entities. We limited the span of registrations to make sure
the developers had a chance to gain popularity, learned how to use the service
and had enough time to start collaborating with others. We also disregard the
“organization” accounts due to the non-random missing data patterns related to
those profiles.
Table 1 summarizes the merging processes. Columns “Overall” contain the
number of entries found for the given vendor (no limitations). Columns “Unique”
contain the number of entries found for the given vendor that did not repeat
in other vendors (no limitations). The column “After merging” contains the
number of entries after two steps of merging. The difference between the sum
of unique entries for each vendor and the numbers in the “After merging” col-
umn comes from imposing limitations on the registration period and the users’
unification. Identified logins do not equal the non-deleted users.
For clustering purposes, initially, we wanted to include all the users registered
during 2008–2014, who did not delete their accounts (3,915,138 observations).
However, the presence of users with no public activity significantly worsened
the results of the clustering. Self-Organizing Maps (SOMs) tended to cluster
only those observations correctly; thus, we removed this group of observations.
We also removed the group with incidental activity (the sum of written issues,
comments, and commits lower than 10). We standardized log-transformed vari-
ables to mitigate the impact of the remaining outliers and the range of the
variables. For taking the logarithms, we incremented the values of the variables
6by five. Scaling by a small factor (usually one) is a generally accepted practice
in such cases. The distributions of the variables were biased towards low values
(0-10), so the standard treatment could overestimate the differences between
them. E.g., for the values of our variables, the difference between zero, one, and
two is negligible; the shift by one makes those differences non-linear. Shifting
by five reduces this effect. The final sample contained 1,886,642 GitHub users.
3.2 Textual artifacts
We analyzed the textual content created by GitHub users in the form of com-
ments written in issues threads and bodies of the issues (the first comment in
a thread). First, we used Compact Language Detector 2 (CLD2) [Sit13] to
assign the language to the comment. Secondly, we limited our sample to the
items detected as English. Out of 26,508,924 comments retrieved, 22,830,296
were listed as English. Even if the comments in issues on GitHub fundamentally
differ from the communication in other social media – they aim at fostering the
production of a working product – they are still generated via the Internet. We
needed the preprocessing:
• Internet-specific content: we replaced emojis, emoticons, and slang with
tokens containing their verbal description enclosed in colons;
• source code was replaced with [code-snippet] token;
• automated responses were replaced with [automated-message] token;
• URLs for GitHub, Twitter, or StackOverflow were replaced with tokens
[github | twitter | stackover-link];
• @mentions (a typical way of notifying somebody of the post) were replaced
with [user-mention] token, repository names with [repo-name] token;
• each comment formed a single line; if there were no [.?!] at its end, “.”
was inserted;
• we expanded popular English short forms.
For the needs of text mining, additional replacements were introduced. We
merged negations (“not”) with the following word, a standard treatment (removal
of numbers, punctuation, stop words, and stemming) was also carried out.
The information about the similarity of the users was absent in the textual
data. To combat this, we merged the textual data with the results of the
clustering. The sample was limited to the comments for which we could infer
the distance (similarity measure) between the interlocutors. Information on the
sequence of the comments was not available. We also had little possibilities to
find who is the addressee of the message. That is why we only analyzed the
comments in which the commenter differs from the repository owner. The final
sample consisted of 5,647,858 comments.
7Table 2: Number of textual items found for users in the given distance. The
increasing distance measures increasing dissimilarity
Distance Comments Bodies Sentences (comments) Sentences (bodies)
0 75,271 4,072 165,486 11,037
1 354,991 25,177 1,074,645 124,342
2 518,739 45,140 1,241,702 133,713
3 483,693 48,746 1,192,105 144,672
4 470,559 53,782 1,171,277 172,917
5 435,391 51,666 1,074,032 164,828
6 431,251 50,457 1,116,885 159,916
7 632,704 62,508 1,475,491 206,722
8 689,399 104,259 1,808,844 355,135
9 949,094 149,407 2,743,520 560,525
10 76,927 11,552 255,780 52,574
The distance between two users is the distance between the neurons they
are mapped to by the SOM algorithm and serves as the similarity measure (the
higher the distance, the less similar users are). We took the rounded mean
over the results of multiple runs of the SOM algorithm. Then, we grouped
the comments based on the inferred distance. We did not find any comments
for distances from 11 to 13. There are two possible explanations: our data
set contains natural missing observations that are impossible to impute (e.g.,
periods in which GitHub API does not return the textual data); a part of those
comments was written in languages different than English. Table 2 summarizes
how many items we found in the given distance.
Even if we miss data for distances 11-13, we do not find it threatening.
Figure 1 depicts the comparison between the theoretical distribution of issues
or comments (based on the leave-one-out simulation for the means of the results)
and the empirical one. Out sample is characterized by an overpopulation of the
textual content created by dissimilar users. However, the shapes of the density
functions follow the same pattern, so we assume our sample is representative.
3.3 Modeling tendencies behind links
Measuring tendencies among nodes to bond with similar or not is a well-known
topic in theoretical research on social networks. The traditional way of measur-
ing homophily means computing correlation coefficients for node degrees. For
multi-dimensional modeling, the family of Exponential Random Graph Models
(ERGM) can be used. This approach is not valid in our case. First, ERGMs
are computationally complex [BDE14]. Second, the networks’ structures are in-
tercorrelated [Cel16, Cel18], so the error terms among the individual equations
would be correlated, leading to biased results. We need a simpler approach
that would be robust to interdependence among the variables and easy to im-
plement. For this reason, we use Self-Organizing Maps to measure similarity in
8Kernel density plots −− comments Kernel density plots −− issues
0.14
empirical empirical
theoretical theoretical
0.15
0.12
0.10
0.10
0.08
Density
Density
0.06
0.05
0.04
0.02
0.00
0.00
−1
0
1
2
3
4
5
6
7
8
9
10
11
12
13
14
−1
0
1
2
3
4
5
6
7
8
9
10
11
12
13
14
Bandwidth = 1 Bandwidth = 1
Figure 1: Theoretical and empirical density for number of comments and issues
(bodies) for users of increasing diversity
a multidimensional way.
3.4 One-dimensional analysis
Assortativity represents to what extent nodes in a given network associate with
other nodes in this network, being or not of a similar sort [New02]. We ex-
press assortativity as a scalar value in the range [-1,1]. 1 denotes an entirely
assortative network, i.e., the one in which the nodes with low degree link to
other low-degree nodes. On the contrary, -1 denotes completely disassortative
network, in which the low degree nodes connect to high degree ones.
For directed networks, we analyze three different types of assortativity [NVM15].
rin denotes in-degree assortativity, rout is out-degree assortativity, and rd mea-
sures overall assortativity. We diversify the assortativity for directed networks
because nodes may exhibit different tendencies when considering the connec-
tions’ direction. Assume that node v1 has l out-going links and 0 in-going ones
and node v2 has 0 out-going links and l in-going ones. The degree for both nodes
is the same and equals l. If connected, these nodes are assortative in degrees,
however, disassortative in both in- and out- degrees.
The networks in our study are scale-free with non-normal degree distribu-
tions (see, e.g., [LRM14, DSTH12] for following and collaboration networks,
[AL13] for power-law in issues and [CS15, JGJ+ 14] reporting on power-law be-
havior in the starring/watching network), which threatens the standard com-
putation of assortativity (Pearson coefficient). To combat this, we discuss both
the Pearson and the Spearman coefficients [LH13]. To minimize the impact of
the outliers, we calculate the logarithms of values (shifted by one, since zeros
may occur).
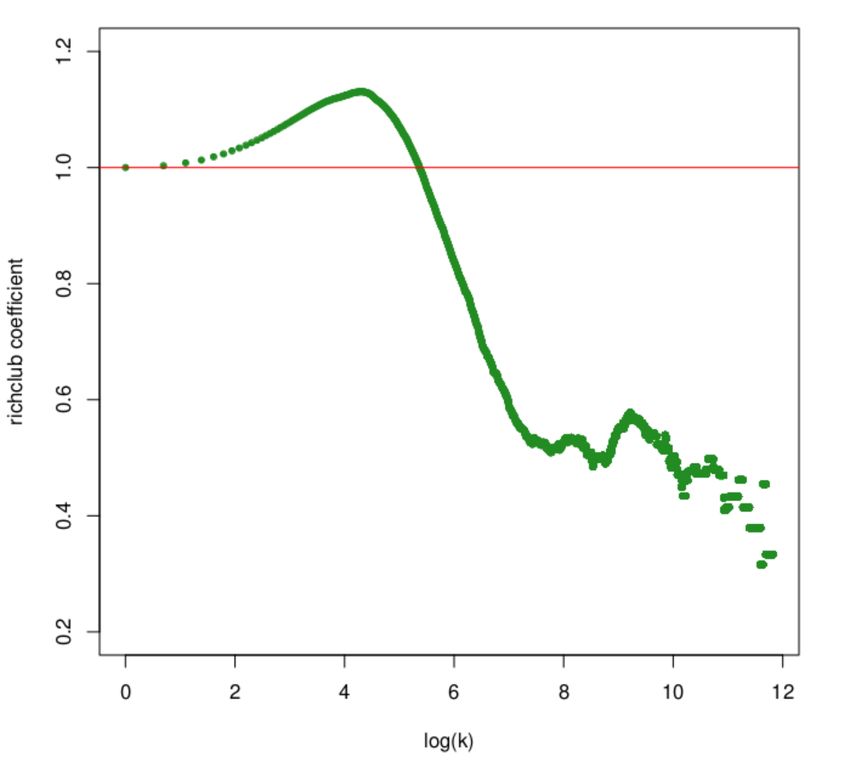
Rich-club coefficient inspects the tendency of high degree nodes to form
9tightly interconnected communities [ZM04]. Whereas assortativity quantifies
two-point correlations and accounts for quasi-local properties of the nodes in
the network, the rich-club coefficients are computed as global features within
a restricted subset. They allow for a closer inspection of the structure of ho-
mophily. Generally, the two techniques’ results can be similar, but they do not
have to be.
Rich-club coefficient measures how many edges are present between nodes
of degree at least k in comparison to how many edges there could be between
these nodes in a complete graph (concerning the direction of the link). Since
the coefficients’ values increase monotonically with an increasing degree even
for random networks [CFSV06], we need to apply a normalization method. The
coefficient’s value computed from the empirical network is scaled with the coef-
ficient’s value computed from the maximally randomized network with the same
degree distribution.
3.5 Multidimensional similarities
Discussing similarity in data is straightforward if we compare at most two di-
mensions. However, if we are interested in possible non-linear relationships or
want to introduce more variables simultaneously, the analysis becomes chal-
lenging. We want to reduce the dimensionality in data without significant loss
of information. Two popular approaches include Principal Component Anal-
ysis (PCA) and Self-Organizing Maps (SOMs). In comparison to well-known
multidimensional techniques of reducing dimensionality, SOMs have many ad-
vantages. They do not impose any assumptions on the variables’ distributions
and do not require independence among variables. They allow for solving non-
linear problems. At the same time, they are relatively easy to implement and
modify [Koh97, AE12].
The SOM algorithm’s core idea is using a deformable template (a manifold)
to translate data similarities into spatial relationships. For our application,
SOMs’ crucial feature is that the resulting spatial locations have interpretation.
Two stages of SOM’s training: competition and adaptation, force the neighbor-
hood to attract similar objects. This way, the distance between the neurons
becomes a measure for similarity: the further, the less similar objects are.
4 Results
4.1 Homophily and heterophily in GitHub – general ten-
dencies
In Table 3 we provide the computed assortativity measures for the six networks
considered in our study. The Pearson and Spearman coefficients’ values are
similar (the only exception is the starring network, where the signs are opposite).
In most cases, the networks are weakly disassortative in degrees (nodes with
lower number of overall connections link more frequently to nodes with a higher
10Table 3: The assortativity of networks analyzed in the study
Network Deg. Assortativity In-Deg. Assortativity Out-Deg. Assortativity
rd ρd rin ρin rout ρout
following -0.127 -0.009 -0.104 -0.044 0.030 0.098
starring 0.006 -0.024 -0.016 -0.027 0.082 0.071
forking -0.036 -0.012 -0.051 -0.061 0.110 0.124
issues -0.476 -0.268 0.154 0.133 -0.144 -0.040
pull requests 0.071 0.146 0.067 0.073 0.164 0.163
comments 0.033 0.040 -0.004 -0.015 0.138 0.122
Following Starring Forks Issues Pull requests Comments
Figure 2: Normalized rich-club coefficients as the functions of node degrees with
(row 1) and without (row 2) respect to the directionality of the relations. The
horizontal line represents the value of rich-club on a maximally random graph.
Values above (below) this line correspond to the presence (absence) of rich-club
phenomenon with respect to the random case
number of overall connections). We observe usually weak disassortativity in in-
degrees (nodes with a high number of incoming connections on average tend to
attract nodes with a low number of incoming connections). Finally, networks are
assortative in out-degrees (nodes highly connecting with other nodes on average
link to other nodes behaving in the same way). An interesting exception is the
pull requests network, which is weakly assortative no matter which direction we
analyze. That may suggest a kind of sorting behavior while creating an edge in
this network, and nodes exhibiting homophily.
Suppose do not take directionality into account. In that case, all networks
show similar behaviors: one can observe forming rich-clubs among the nodes
with relatively low degrees and the absence of rich-clubs among the top nodes
(Figure 2). Analysis of the coefficients’ values suggests that popular users of
GitHub tend to have connections with lower degree nodes rather than being
tightly interconnected among similar nodes or nodes with even higher degrees.
Again, an interesting case is the pull requests network. It is weakly assortative
(i.e., generally exhibits homophily), but at the same time, the connections are
not tight. The plot of the rich-club coefficient function of node degrees in pull
11requests network resembles a general plot of a more complex polynomial, show-
ing changes in behavior concerning the degree; for most of the values of degrees
indicating lack of rich-club phenomenon. Insights on the remaining networks
are consistent with the conclusions derived from the analysis of assortativity,
even if, in general, this is not mandatory. In theory, there can be even networks
that exhibit both disassortativity and rich-club behavior.
While controlling for directionality in relations, one observes different pat-
terns among nodes (Figure 2). We observe rich-club phenomena for even quite
high out-degrees (up to 1000, and for the starring network: 8000) in all consid-
ered networks. However, the patterns for in-degrees differ among the networks;
users with moderately high in-degrees in the following network do not present
the rich-club behavior; the changes in the trend are more observable compared
to issues or starring networks. We notice an interesting difference in the patterns
of rich-club phenomena while comparing pull requests network with the follow-
ing network: even if the trends for out-degrees are similar, they are different
while controlling for in-degrees.
4.2 Clustering of GitHub users
We present and interpret the results of applying a Self-Organizing Map utilizing
Klein quartic to our data set. Following the literature, we utilized variables from
five groups:
• Reputation: the number of developer’s followers, stars obtained by a de-
veloper (the sum of stars given to developer’s repositories), the eigenvector
centrality of a developer – how important is the developer for the network,
the number of times developers was forked_by others;
• Reciprocity: the number of developers followed by a developer, the num-
ber of repositories forked from others, stars given to other developers’
repositories, and commits pushed to repositories owned by other develop-
ers;
• Communication: the number of comments written in own and others’
repositories, and the number of issues opened in own and others’ reposi-
tories;
• Standardization: the number of languages used in the developer’s repos-
itories, the fraction of specific usage intended languages in all of the lan-
guages used by the developer (specialization – web-development, func-
tional or scientific-intended languages);
• Information: the number of repositories, the year of developer’s regis-
tration, the number of commits in the base repositories (the ones that
were not forked) and in forked repositories.
Figure 3 depicts the visual example result of the SOM clustering. Due to
the exponential growth of the hyperbolic plane, we can fit similar objects closer
12Figure 3: SOM on Klein quartic: tiles colored with number of repositories
(R), commits by developer in their base projects (G), commits by developer in
repositories they forked (B)
to each other than possible in the Euclidean plane. We may see the smooth and
gradual changes in colors; similar colors indicate similar characteristics. The
darker the shade, the higher value of the given variable for the representative
neuron. With the RGB additive color model, we can control up to three aspects
at the same time. E.g., the light sea-green and cyan area in Figure 3 denotes the
cluster of users who do not have many repositories (low values of red). However,
they are very active in them: they frequently commit to their repositories (high
values of green) and work with the source code of forks (medium values of blue).
The users who belong to purple and pink areas are also active but characterized
by a different pattern. They have many repositories (high values of red), they
rarely commit to their projects (low values of green), but often work on forked
repositories (high values of blue). The brightest area highlights the extremely
active developers. The dots on the tiles approximate for the number of observa-
tions which were assigned to a neuron (1: 15–1315; 2: 1334–1923; 3: 1935 –2372;
4: 2373–2793; 5: 2801–3227; 6: 3230–4099; 7: 4123–7214; 8: 7261–30130).
We aimed to find the patterns behind link creation. To this end, we counted
how many edges in GitHub networks (following, starring, forking, issues, pulls,
comments) occur between developers in a given distance. We notice that links
131250000
1000000
3e+06 1000000
750000
Simulated number of links
Simulated number of links
Simulated number of links
750000
2e+06
500000
500000
1e+06
250000
250000
0 0e+00 0
0 1 2 3 4 5 6 7 8 9 10 11 12 13 0 1 2 3 4 5 6 7 8 9 10 11 12 13 0 1 2 3 4 5 6 7 8 9 10 11 12 13
Distance Distance Distance
following starring forking
150000
2e+05
2e+05
Simulated number of links
Simulated number of links
Simulated number of links
100000
1e+05
1e+05
50000
0e+00 0 0e+00
0 1 2 3 4 5 6 7 8 9 10 11 12 13 0 1 2 3 4 5 6 7 8 9 10 11 12 13 0 1 2 3 4 5 6 7 8 9 10 11 12 13
Distance Distance Distance
issues pull requests comments
Figure 4: Distributions of the numbers of edges among developers in 200 simu-
lations. The increasing distance (x axis) indicates increasing dissimilarity
between dissimilar users (very long distance) are rare 4. The shapes of the
distributions of links differ based on the type of connection. We observe that
distributions of the number of links in the networks related to information-flow
or reputation mechanisms (e.g., following, starring) resemble bell-curves with a
slight bias towards dissimilarity (long distances). The distributions in networks
originating from the collaboration (issues, comments, pull requests) are two-
modal. That suggests benefits from working with both similar and dissimilar
users. Especially in the case of pull requests, we observe the bias towards the
similarity. The distribution of the number of links for the forking network is
intriguing. Forking is necessary for sending a pull request, so we would expect
this network to behave like the collaboration-related ones. However, a significant
number of forks is not intended for collaboration [KGB+ 14]. These forks serve as
personal copies of the software, highlighting this network’s reputation-building
origin. It seems plausible to connect with and copy software of users who are
dissimilar to us since it would be impossible or troublesome to produce this
software by ourselves (e.g., due to the differences in coding experience). While
both similarity and diversity play roles in collaboration, information flow and
reputation lean towards diversity.
4.3 Role of diversity in GitHub teams
We have already found that similarity favors collaboration on the source code
in the form of pull requests. However, following the literature suggestions on
team-working, we suppose that the connections between similar and dissimilar
14Table 4: Usage of common words related to project development in division by
GitHub users’ similarity. ***, **, * denote significance of Spearman coefficient
at 0.01, 0.05, 0.1 level, respectively.
group word correlation 0 1 2 3 4 5 6 7 8 9 10
modify code-snippet -0.74 ** 31.18 28.41 26.88 25.82 24.26 24.42 20.70 31.69 16.25 15.41 12.84
pull-request 0.31 0.91 1.29 1.46 1.70 1.89 1.76 3.20 5.37 1.87 1.59 1.26
merge -0.77 *** 3.73 3.57 3.69 3.67 3.59 3.85 3.24 2.46 2.73 3.27 1.43
patch -0.55 * 1.08 1.05 1.13 1.16 1.11 1.09 1.07 0.77 0.85 0.86 1.08
report error 0.86 *** 3.20 3.77 4.27 4.65 4.85 5.16 6.30 5.99 6.43 7.69 10.04
problem 0.81 *** 4.22 4.79 5.24 5.63 5.68 5.85 5.94 4.74 6.31 7.72 9.97
not-work 0.91 *** 0.65 0.85 0.97 1.08 1.15 1.18 1.19 1.00 1.38 1.85 2.53
bug 0.78 *** 2.88 3.12 3.32 3.50 3.52 3.54 3.71 3.13 3.51 4.18 4.30
bug-report 0.59 * 0.12 0.17 0.15 0.21 0.16 0.19 0.17 0.11 0.21 0.31 0.23
failed 0.92 *** 0.36 0.52 0.51 0.54 0.59 0.78 0.84 0.82 0.84 1.16 1.48
help help 0.71 ** 3.37 3.46 3.77 4.01 4.17 3.99 4.20 3.31 4.36 5.09 7.06
howto 0.85 *** 1.21 1.42 1.63 1.77 1.94 1.90 1.97 1.55 2.17 2.62 3.60
not-know 0.54 * 0.82 1.02 1.11 1.14 1.15 1.12 1.12 0.85 1.10 1.24 1.48
suggest suggest 0.55 ** 1.69 1.68 1.78 1.86 1.85 1.87 1.82 1.38 1.83 2.25 2.17
feature-request 0.58 ** 0.08 0.11 0.14 0.15 0.13 0.14 0.16 0.10 0.13 0.16 0.25
individuals have diverse roles. We expect that similar users tend to work on
the source code (lower barriers for communication, similar skills, or abilities).
Simultaneously, diversity allows for reporting bugs or suggesting features (dif-
ferently processed packages of information among heterogeneous individuals).
The different roles of communication between similar and diverse users emerge
from the analysis of the messages’ subjects. With greater similarity, the role of
[user-mention] token increases; users talk about tasks and refer to others. On
the contrary, communication from diverse users often refers to their experience
or needs. The more diverse users, the more likely to talk about themselves than
refer to others (for “I/you” fraction Spearman ρ = 0.92, p-value 0.00).
Development-related topics and diversity To analyze the roles of differ-
ent clusters of links, we found the keywords in the distances. We were interested
in words related to collaboration on (modifying) code, bug reporting, asking for
help, or suggesting features. 1
In Table 4, we present selected keywords for the mentioned groups. With
the increasing dissimilarity of the users (a greater distance), the role of the
token [codesnippet] and the words related to the writing the source code (e.g.,
pull request, merge) decreases; the role of the words related to bug reports and
feature requests (e.g., error, problem, debug, help, howto) increases. Those
relationships are statistically significant (joint significance tests).
Interestingly, even if the correlation between talking about pull requests and
the dissimilarity of the users is moderately positive, it is non-significant. A
closer analysis of the artifacts containing this word written by the dissimilar
users reveals that the comments are often reminders (e.g., I have sent you a
pull request), mentioning a user is new to GitHub. This may result from new-
comers’ unfamiliarity with the etiquette rules: they may perceive their (often
1 The zoomable word clouds with frequent words used in the communication based on sim-
ilarity are available here: https://mimuw.edu.pl/~dot/en/pages/wordclouds.html – those
visuals are mostly for Readers’ entertainment, the paper contains crucial insights.
15the first) pull request as something extraordinary, instead of everyday activity
for a developer. The lack of experience also correlates with the mistakes in pull
requests (e.g., used wrong branch for pull request, Added a pull request with the
same issue description... sorry, new to GitHub!! or please, disregard this pull
request). The comments also mention a lack of decision about the sent pull
request or give the justification for closing it. Our observations are generally in
line with the phenomenon described in [TDH14]. Pull requests that generate
discussions are less likely to be accepted.
Similar users are likely to talk about and analyze issues (for [github-issue]
token Spearman ρ = −0.87, p-value 0.00) or point at other GitHub repositories
as the reference (for [github-repo] token Spearman ρ = −0.55, p-value 0.008).
On the contrary, with increasing diversity the proportion of automated messages
increases ( Spearman ρ = 0.53, p-value 0.009).
Learning from diversity According to Information Processing Theory, we
may expect that increasing diversity of interlocutors provides learning opportu-
nities. Collaboration among newbies and experts [AL13] internalizes different
experiences and other intangible assets within the team. We have already found
evidence for this phenomenon analyzing comments containing the word “pull re-
quest”. Moreover, commenters dissimilar from the repository owner more often
admit they are new to something (Spearman ρ = 0.82, p-value 0.002).
With increasing diversity, users are more likely to mention their willingness
to learn something in the conversation (Spearman ρ = 0.82, p-value 0.003).
Willingness to learn parallels with lack of experience (e.g., This is my first time
doing this that’s why I’m asking. I want to learn.) or encountered errors (e.g.,
I want to learn because way I have done it in my site it cause late loading. How
you done it? [original wording]).
To combat the stereotype that developers tend to refrain from helping new-
bies by either referring to READMEs, manuals (as in Read The Manual), or
publicly available resources (e.g., StackOverflow) we checked whether there are
significant positive correlations with those words. While the correlations with
StackOverflow or manual were positive, they were statistically insignificant (p-
values greater than 0.20). On the contrary, the correlation with “README”
was negative and statistically significant. The word README occurred more
often among similar users. The comments indicated the need for updating it
(e.g., Yeah README should be updated. thanks. or we need more information
in the README so the people would know how it works.) or discussed what it
should include (e.g., could we please list such dependencies in the README to
make this more clear? or would it beneficial to update the README given the
problem I had with the explicit require? [original wording]).
Curator role of diversity Open Source is widely accepted as meritocracy
[VPR+ 15], where decisions are made by deliberating groups [TDH14]. However,
for multiple reasons, deliberating groups often converge on falsehood rather than
truth [Sun06]. Deliberating groups of similar users are prone to biases.
16The results on error reporting from Table 4 prove diversity’s effectiveness
in pooling dispersed information among GitHub users. Pull requests, even if
accepted, may contain hidden errors. Users similar to the pull request author
may not be able to find them. We get the solution to a problem (the source
code is produced), but it is not optimal. In such a case, diversity serves as a
medium that leads to optimal solutions by pointing out the errors and integrat-
ing different perspectives.
4.4 Diversity and politeness
Hardly can source code insult anyone. However, working on project develop-
ment involves verbal communication and discussions over code-related decisions.
Recent studies have already started to investigate the role of politeness in collab-
orative software development [ODC+ 17]. Politeness can significantly impact the
outcome of communication. We observe a statistically significant negative cor-
relation between the diversity of the interlocutors and mentioning others. There
is no significant connection between apologizing and diversity. However, with
increasing dissimilarity, users are more probable to express gratitude and thank
others (Spearman ρ = 0.66, p-value 0.03). In the usage of emoticons, greater
diversity comes with more frowns than smileys (Spearman ρ =: 0.90, p-value
0.00). Similarity encourages users to upvote other’s propositions (Spearman
ρ = −0.94, p-value 0.00), which can be both positive and dangerous. On the
one hand, upvoting shows admiration and warms up the conversation. On the
other hand, it may foster echo chambers and lead to cognitive biases, limiting
critical discourse possibilities.
The result concerning usage of emoticons and phatic communication (verbal
or non-verbal communication of a social function, e.g., starting a conversation,
greeting someone rather than an informative function) may suggest that the at-
titude of the interlocutors correlates with their similarity or not. To check this,
we performed sentiment analysis at the level of sentences. Sentiment analysis is
a technique that identifies how sentiments are expressed in texts and whether
they indicate positive or negative opinions [NY03]. We utilize the implemen-
tation of sentiment analysis in sentimentr R package [Rin18]. The dictionary
was user-defined; it consisted of the combined and augmented Jockers [Joc17]
& Rinker’s augmented Hu & Liu [HL04] positive/negative word list and the
emoji/emoticon sentiment lexicon [NSSM15].
Based on Figure 5, we notice that the proportions among the sentiments are
similar: there are more positive (green) or neutral (grey) comments than the
negative ones (red). Polarity and similarity are not independent (χ2 = 11866,
p-value 0.000). Spearman ρ = −0.01, p-value 0.000, indicates there is a weak
negative correlation between the distance and the polarity. The increasing dis-
similarity of users correlates with more negativity in discussions.
171.0
negative
0.8
neutral
0.6
Sentiment
0.4
positive
0.2
0.0
0 1 2 3 4 5 6 7 8 9 10
Distance
Figure 5: Sentiment distribution in communication among GitHub users of
increasing diversity
5 Robustness of the results
Utilizing a mixed-methods approach always comes with questions about the
quality of its output. This section discusses factors that could affect the obtained
results and how we mitigated them.
Choosing the manifold for SOM One of the major concerns regarding
SOM design is the choice of the manifold. We checked if Klein quartic choice
could bias the conclusions. We compared the results obtained from: Euclidean
disk, Hyperbolic disk, Sphere, Elliptic Plane, Torus, minimal quotient, genus 2
quotient, genus 14 quotient. Results for Klein bottle were indistinguishable from
torus (p-values of the Kolmogorov-Smirnov tests always higher than 0.05), and
the Macbeath surface (genus 7 quotient) needed a significantly higher number
of neurons to implement, thus was incomparable2 .We adapted the standard
model-selection criteria:
1. Log-likelihood `d – SOM distances’ goodness in predicting links between
developers
2 The interactive versions of the results of the experiments with SOM’s underly-
ing topology are available here: https://mimuw.edu.pl/~dot/resources/wizualizacje/
github-rogueviz/ghweb.html – an extended technical meta-analysis is out of the scope of
this paper, we described the steps of robustness checks.
182. Log-likelihood `c – clustering’s goodness in predicting links between de-
velopers
3. Akaike Information Criterion (AIC) based on clustering – a standard tool
used in assessing the relative quality of statistical models for a given data
set
4. Bayesian Information Criterion (BIC) based on clustering – AIC could
underestimate the role of the number of neurons, so we added a second
tool assessing the relative quality of statistical models for a given data set.
Hyperbolic quotient spaces: minimal quotient, genus 2 quotient, genus 3 quo-
tient (Klein quartic), and genus 14 quotient had satisfactory predictive proper-
ties. The clustering based on Klein quartic also returns a relatively low number
of distances and provides aesthetically pleasing results due to high symmetry.
That is why we chose it.
Randomness in clustering The strength of the SOM roots within their
ability to learn the patterns in an unsupervised way. We start by randomizing
weights for neurons, which we may perceive as a source of randomness. One
could argue that the results are not stable and significantly depend on the initial
weights [AE12]. To prevent this, we conducted simulations. For every manifold,
we run the algorithm independently 200 times. Means and confidence intervals
were computed using leave-one-out simulations.
Comparison with random networks One could argue if the resulting shapes
of the distributions of the number of links in the given distance stemmed from
the degree distribution of those networks. To check this, we simulated the
number of links in the given distance against the random networks with the
algorithm based on the Markov chain Monte Carlo method. We conducted 100
such simulations and afterward checked the equality of distributions with the
Kolmogorov-Smirnov test. In all cases, we rejected the null hypothesis.
Comparison with other methods We decided to construct a similarity
measure based on non-Euclidean SOMs. However, other approaches are possi-
ble. SOMs are generally preferred over PCA because they provide better insights
when data is complex, diverse or the relationships among variables are non-linear
[DCG16]. The results of PCA also lack the elegant spatial interpretation. How-
ever, it could be arguable whether we benefit from the information generated
by the SOM’s underlying topology. To check this, we benchmarked the results
of SOMs against the naive method. We determined the distribution of the val-
ues of the Euclidean distance between the observations by simulation and then
grouped those values to define the distances. The values of log-likelihoods `d
for distances defined with the naive method were worse than any value of `d for
non-Euclidean SOM.
196 Discussion and implications
This paper presented an analysis of the nature of GitHub users’ connections and
the role of users’ diversity during project development. Our sample consisted
of both big and small projects, experts and newbies. Whereas, as Cosentino
et al. [CCIC17] state, most papers on GitHub use data sets of small-medium
size, generated with poor sampling techniques, we performed big data analysis.
Robustness checks proved our results are generalizable.
6.1 Homophily and heterophily among GitHub users
To answer RQ1, we conducted a one-dimensional and multidimensional analysis.
The one-dimensional analysis allowed us to investigate homophily or heterophily
from the point of links’ costs. The multidimensional analysis provided us in-
sights on the quality of the relationships. To conveniently discuss the results,
we will divide the networks into two groups: code-related networks (issues,
comments, pull requests) and reputation-related networks (following, starring,
forking).
Every action performed within the network bears a cost. Even if the in-
formation is a valuable good, the process of obtaining data can be expensive.
The costs are of different kinds: being it the alternative cost of time spent on
gathering data, the possibility of overflooding with information ending with the
disability to find the relevant one, or the cost of maintaining connections with
the information sources.
In GitHub, the flow of information mostly occurs within the following net-
work: one is given easily accessible notifications about the activity of the entities
of interest. However, the following is expensive: one should strategically choose
the links which will provide valuable information. If one establishes contact
with a node influential in more than one network, they reduce the cost of ob-
taining information: connection with this one node provides information from
more than one network.
The overall heterophily observed for reputation-related networks is unsur-
prising. In the literature, popular and influential users of GitHub are known as
rockstars. A rockstar has a large number of followers interested in their coding
activity, what projects they follow or work on [HTSD13, DSTH12, BS16]. The
number of followers serves as a signal of popularity/status in the community.
Popular users are loosely interconnected among them – usually have more con-
nections with unpopular users than with other popular ones [LRM14, AL13].
We observe the same phenomenon while analyzing rich-clubs and assortativity
measures concerning the directionality.
The cost of maintaining a connection varies among the networks. Following,
starring or forking networks are characterized by a relatively low cost of link
starting and maintaining compared to collaboration activities with high entry
costs, especially sending a pull request. Maintaining multiple connections usu-
ally requires some optimization; either we limit the number of connections or
the number of nodes we keep relationships with. Choosing an entity that is
20influential in more than one network at the same time enables directly relates
to such optimization; the agents may also perceive multiple links with a given
entity more valuable than the occasional, disposable connection.
The results for the pull request network are consistent with the similarity
attraction theory. Technical collaboration on the source code is easier for similar
individuals. They have a lower cost of communication.
The number of connections provides little information about their quality.
We assume that neglecting the impact of the quality and the strength of the
connections distorts the networks’ analysis significantly. Our analysis shows
that insights drawn from the number of links are not necessarily the same when
considering the implied quality of the relations.
The networks we analyze in this study are characterized by power-law, which
means that the creation of the connection may be driven by up to a certain
degree non-random factors, e.g., reputation or preferential attachment. The
impact of creating an additional link is non-linear. In such a situation, two
randomly chosen links may bear different costs and value. Ideally, one could
also investigate the strength of the connections by utilizing weighted graphs;
in this study, we present a simplified approach. Establishing more valuable
connections also relates to the optimization issues: it may reduce at the same
time the number of nodes and the connections one maintains.
Even if by average GitHub users are driven by heterophily in the number
of connections, analysis of the code-related characteristic in a multidimensional
way reveals that the links’ nature is not that straightforward. While significant
bias towards heterophily in forking network is explained by creating a copy of
the software – it is more convenient to make one instead of writing code by
ourselves – heterophily in other reputation-generated networks is not as much
visible.
We observe that connections among very similar and very diverse users are
rare. The explanation hides exactly in the definition of reputation. Reputation
is about differences: we need them to construct hierarchy. For the practical
purposes of information gathering, it is beneficial to connect with users who are
“different but not too much different” from the given user. Too much similarity
reduces the possibilities for finding something new because of the substitution in
skills (or even echo-chambering); too much diversity may require skills that are
not within one’s reach. On the contrary, collaboration-oriented networks benefit
from both homophily and heterophily. While homophily fosters code produc-
tion in the form of pull requests (as in similarity attraction theory), heterophily
allows for knowledge dissemination and finding solutions due to differently pro-
cessed packages of information (as in information processing theory).
6.2 Roles of the links
To answer RQ2, we conducted a text mining analysis. Our results are con-
sistent with information processing theory: a diverse team, consisting of more
and less experienced users, aggregates different perspectives. Our findings on
collaboration between newbies and experts, and the learning possibilities aris-
21You can also read