Doppler imaging detects bacterial infection of living tissue
←
→
Page content transcription
If your browser does not render page correctly, please read the page content below
ARTICLE
                  https://doi.org/10.1038/s42003-020-01550-8                OPEN

                  Doppler imaging detects bacterial infection of
                  living tissue
                  Honggu Choi 1, Zhe Li1, Zhen Hua1, Jessica Zuponcic2, Eduardo Ximenes2, John J. Turek3,
                  Michael R. Ladisch 2,4 & David D. Nolte1 ✉
1234567890():,;

                  Living 3D in vitro tissue cultures, grown from immortalized cell lines, act as living sentinels as
                  pathogenic bacteria invade the tissue. The infection is reported through changes in the
                  intracellular dynamics of the sentinel cells caused by the disruption of normal cellular
                  function by the infecting bacteria. Here, the Doppler imaging of infected sentinels shows the
                  dynamic characteristics of infections. Invasive Salmonella enterica serovar Enteritidis and
                  Listeria monocytogenes penetrate through multicellular tumor spheroids, while non-invasive
                  strains of Escherichia coli and Listeria innocua remain isolated outside the cells, generating
                  different Doppler signatures. Phase distributions caused by intracellular transport display
                  Lévy statistics, introducing a Lévy-alpha spectroscopy of bacterial invasion. Antibiotic
                  treatment of infected spheroids, monitored through time-dependent Doppler shifts, can
                  distinguish drug-resistant relative to non-resistant strains. This use of intracellular Doppler
                  spectroscopy of living tissue sentinels opens a new class of microbial assay with potential
                  importance for studying the emergence of antibiotic resistance.

                  1 Department of Physics and Astronomy, Purdue University, 525 Northwestern Ave, West Lafayette, IN 47907, USA. 2 Department of Agricultural and

                  Biological Engineering and the Laboratory of Renewable Resources Engineering, Purdue University, West Lafayette, IN 47907, USA. 3 Department of Basic
                  Medical Science, Purdue University, 625 Harrison St, West Lafayette, IN 47907, USA. 4 Weldon School of Biomedical Engineering, Purdue University, West
                  Lafayette, IN 47907, USA. ✉email: nolte@purdue.edu

                  COMMUNICATIONS BIOLOGY | (2021)4:178 | https://doi.org/10.1038/s42003-020-01550-8 | www.nature.com/commsbio                                         1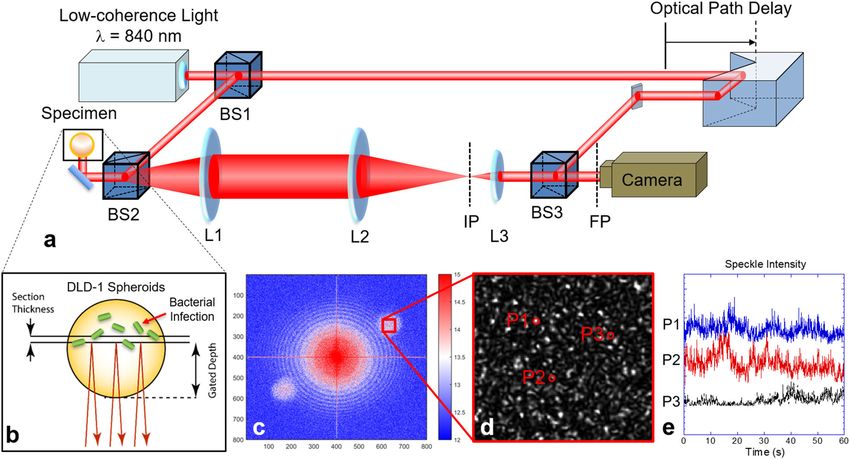
ARTICLE                                                              COMMUNICATIONS BIOLOGY | https://doi.org/10.1038/s42003-020-01550-8

P
       athogenicity studied at a molecular level includes host-cell         ultra-low-frequency Doppler shifts are detected through phase-
       identification, cellular signaling, infection, and spreading          sensitive ultra-stable digital holography combined with low-
       strategies of various pathogens within cell culture1–10. One         coherence infrared light scattering to capture the complex spectra
of the principal methods to study the behavior of pathogens is              of beat frequencies from dynamic speckle37,38. The Doppler sig-
fluorescence dynamic microscopy6,7,11,12 that monitors the two-              nals are selected by coherence-gating and isolated to optical
dimensional behavior of pathogens in real-time13–15. However,               sections up to a millimeter deep inside living tissue. Multiple light
the fluorescence technique requires genetic engineering or                   scattering from moving intracellular constituents compound
staining to insert fluorescing agents and may not represent nat-             Doppler frequency shifts (summed in the exponential phases) to
ural phenotypes. In addition, the number of specimens monitored             produce high-dynamic-range fluctuations corresponding to a
by microscopy is limited by the field of view of the optics, and             continuum of Doppler beat frequencies centered on zero fre-
pathogen detection by fluorescence microscopy has limitations                quency (isotropic intracellular transport).
when pathogens are unknown. To develop a protocol that can                     The coherence-gated optical system configuration is shown in
monitor pathogens with natural 3D phenotypes, and without                   Fig. 1a. The Mach–Zehnder interferometer matches the optical
further processing, we introduce biodynamic imaging (BDI) of                path length of the adjustable reference arm to achieve a zero-path
bacterial invasion of living tissue sentinels.                              difference relative to light scattered from a selected depth inside
   Biodynamic imaging16 is based on low-coherence inter-                    the tissue sample. The reference and signal waves are incident off-
ferometry with coherence-gated ranging based on digital holo-               axis on a CMOS pixel array at a small angle to produce spatial
graphy to record scattered light from a selected depth inside               carrier fringes on the array. The camera is on a Fourier plane of
living tissue while rejecting incoherent background10,17,18.                the optical system and records a Fourier-domain hologram at a
Dynamic speckle detected using BDI is caused by light scattering            frame rate of 25 fps. At the end of a 14-h experiment, the
from moving intracellular components that have persistent                   holograms are reconstructed using two-dimensional spatial
transport that places them in the Doppler light scattering regime,          Fourier transforms. Time-lapse frames of the tissue sample are
based on Doppler shifts caused by dynamic light scattering19, for           converted to time series that are analyzed in the frequency
which the persistence length of the transport is greater than the           domain and summed to produce fluctuation power spectra. There
reduced wavelength of the probe light, expressed as ‘p >λ0 =4πn,            are several modes of BDI, including optical coherence imaging
where ‘p is the mean transport persistence length, λ0 = 840 nm is           (OCI) that captures structural properties of the sample, motility
the free-space wavelength and n ≈ 1.4 is the refractive index of the        contrast imaging (MCI) that maps the Doppler activity
tissue. (For a detailed analysis of intracellular Doppler light             volumetrically in 3D or 4D (time-lapse), tissue-dynamics
scattering see ref. 19) BDI of living tissues has been used for drug        spectroscopy (TDS) that forms time-frequency spectrograms that
screening20, for the assessment of chemoresistance for canine and           track the spectral changes in time, and tissue-dynamics spectro-
human patients21,22, and for oocyte and embryo viability in                 scopic imaging (TDSI), which is spatially resolved TDS (see
artificial reproductive technology23. In this article, we describe the       “Methods” and ref. 39).
first application of BDI to probe subtle changes in the intracel-               A key element of this technique applied to bacterial infection is
lular motions of in vitro living host tissue induced by an early-           the use of sub-millimeter-scale 3D living tissue sentinels that are
stage bacterial infection.                                                  the living matrix to support and dynamically respond to the
   Bacterial infection of living tissue and the rise of antibiotic          bacterial invasion of as little as 103 viable bacterial pathogens per
resistance pose a serious threat to the future of human health              500 micron-diameter sentinel, or about one bacterium per 100
caused by bacteria including Streptococcus pneumoniae, Neisseria            epithelial cells. The light scattered from infected living tissue is
meningitidis, Staphylococcus aureus, and Pseudomonas aerugi-                dominated by Doppler scattering from the cellular constituents of
nosa, among others. By the year 2050, it is projected that more             the tissue rather than from the bacteria itself. In this way, the
people will die from septic shock, caused by antibiotic resistance,         sentinels not only make the action of the infection visible but also
than from cancer24. Mismanagement of treatments and the                     transmit the changes in intracellular dynamics caused by the
indiscriminate use of antibiotics in livestock feed has accelerated         infection. The reversible nature of the response of this system, for
antibiotic resistance that may soon render common antibiotics               instance, when antibiotics are applied to suppress the infection
inert25,26 Therefore, rapid assessment of infection at the early            and the intracellular dynamics revert to normal behavior, is a
stages of septic shock, and the selection of the most effective             unique feature of this sentinel system.
treatment will be a pressing need27,28. To demonstrate the via-                The sentinels are three-dimensional living tissue culture grown
bility of BDI to characterize bacterial infection of living tissue and      from biologically relevant cell lines (ATCC) into multicellular
resistance to treatment, this study uses food pathogens, including          spheroids. The spheroid growth is highly reproducible and can
pathogenic and non-pathogenic serovars that can be handled                  generate large replicate numbers for multi-well plate assays. The
safely, for which the emergence of antibiotic resistance also has           three-dimensional nature of the spheroids is a crucial character-
widespread implications.                                                    istic because conventional two-dimensional tissue culture fails to
                                                                            reproduce important phenotypic properties for biologically
                                                                            relevant assays40–42. The study of infection by food-borne
Results                                                                     pathogens (Salmonella enterica serovar Enteritidis phage type
Experimental principles and functional imaging. The speeds of               (PT) 21, Listeria monocytogenes, Listeria innocua, and Escherichia
intracellular dynamics range across three orders of magnitude               coli) reported here used the DLD-1 colon adenocarcinoma cell
from tens of nanometers per second (cell crawling, metastasis,              line to grow multicellular spheroids with characteristics of
blebbing, apoptotic bodies)29–32 to tens of microns per second              epithelial colon tissue, which is a relevant target for these
(organelles, vesicles, mitochondria)33–36 with associated Doppler           pathogens. The growth of the DLD-1 spheroids is described in the
frequencies spanning from 10 mHz to 10 Hz19. The conversion                 “Methods” section and Supplemental Information.
from intracellular speed to Doppler frequency for the infrared                 The E. coli strain used in this study is the genetically engineered
backscatter geometry is ΔωD ¼ ~   q ~
                                     v, where q ¼ 4πn=λ0 is the             O157:H7 strain for which the Shiga toxin gene has been removed,
momentum transfer and v is the intracellular speed. The deep                and green fluorescent protein (GFP) and ampicillin resistance
sub-Hertz of the slowest motions places the detection of relative           genes have been added43. The S. enterica and L. monocytogenes
Doppler frequency shifts at less than one part in 1016 Hz. Such             strains are natural phenotypes, which can infect mammalian cells

2                         COMMUNICATIONS BIOLOGY | (2021)4:178 | https://doi.org/10.1038/s42003-020-01550-8 | www.nature.com/commsbio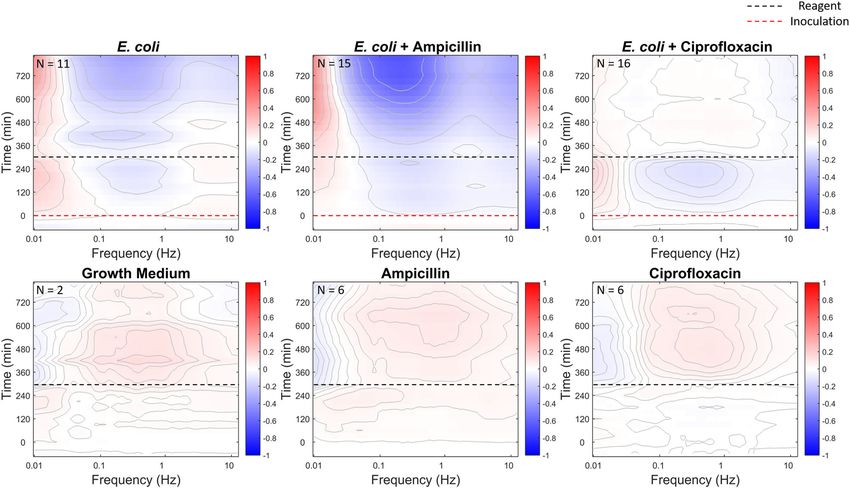
COMMUNICATIONS BIOLOGY | https://doi.org/10.1038/s42003-020-01550-8 ARTICLE
Fig. 1 Biodynamic imaging system configuration. a Experimental principles and setup of intracellular Doppler spectroscopic imaging. A living sample
(tumor spheroid or biopsy) is optically sectioned with low-coherence backscattered infrared light on a digital camera on the Fourier plane using a
Mach–Zehnder off-axis digital holographic system. The low-coherence light is split by a beam splitter (BS1) into the object and reference arms.
Backscattered light is collected by the 4-f system (L1 and L2) and forms an image on the image plane (IP). The Fourier lens (L3) transfers the image onto
the Fourier plane (FP). b Scattering of light from dynamic intracellular processes generates dynamic speckle that is altered when tumor spheroids are
inoculated with various bacterial strains. c The Fourier-domain digital hologram is reconstructed to the image plane using a fast Fourier transform. The
zero-order is in the center, and the two first-order side-bands are on the diagonal. The red box shows a magnified part of the image plane speckle. d A
magnified reconstructed speckle image. e Dynamic speckle intensity fluctuates temporally at different locations P1, P2, and P3.
and proliferate. In the case of S. enterica, the bacteria infiltrate The overall effect of the infection is inhibition of intracellular
host cells by modulating the cellular membrane to induce dynamics that may be in part from the bacteria competing for the
engulfing motion causing the bacteria to be internalized. L. same nutrients or related to the effects of metabolic by-products
monocytogenes physically penetrate mammalian cell walls and from the bacteria (Supplementary Note 2.2). The dynamic range
synthesize actin filaments to gain propulsion force for cell-to-cell (DR) of the spectral density is another marker that estimates the
spreading. On the other hand, L. innocua is a strain of Listeria change in dynamics. The dynamic range is defined as the log ratio
genus that is non-invasive and is used as a negative control in the of the spectral amplitude at the lowest frequency (10 mHz) to the
experimental comparisons of pathogenicity. spectral amplitude at the Nyquist frequency (12.5 Hz). The
amplitude at the Nyquist frequency is also called the “Nyquist
floor”, which is another useful dynamic marker. The Nyquist
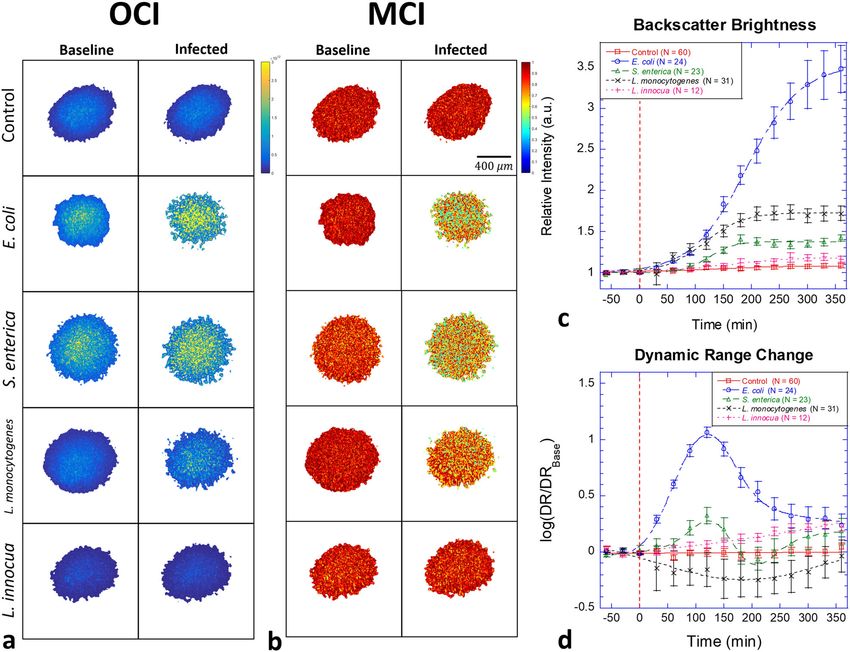
Biodynamic imaging of bacterial invasion into tissue. Optical floor increases when there is an increase in high-speed transport,
coherence images (OCI) are averaged over 2048 frames to gen- for instance, caused by organelle or vesicle transport. The rise of
erate the OCI maps. OCI maps of tumor spheroids are shown in the Nyquist floor decreases the dynamic range if there is no
Fig. 2a before and 6 h after infection of DLD-1 for the four corresponding increase of amplitude at the lowest frequency. On
bacterial strains E. coli, S. enterica, L. monocytogenes, and L. the other hand, the dynamic range increases if the dynamics
innocua at an exposure of 107 CFU per well. The associated time around 0.01 Hz in the low-frequency band contains an increased
courses of the average backscatter brightness (BB) are shown in fraction of intracellular components that move slowly. The DR is
Fig. 2c. Proliferating bacteria produce increasing brightness with calculated by averaging the first 5 spectral components compared
infection. The infection by E. coli produces the strongest against the average of the last 5 spectral components. The changes
enhancement of brightness as the proliferating mass of bacteria in dynamic range relative to the pre-inoculation averages are
increases the refractive index heterogeneity on the exterior to the shown in Fig. 2d. Increased dynamic range after inoculation was
cell bodies44. The weakest BB effect is from L. innocua that is observed for E. coli, S. enterica, and L. innocua, but not for L.
slightly above the control level due to the inefficient proliferation monocytogenes. Non-monotonic behavior may represent succes-
rate45. The two pathogenic strains L. monocytogenes and S. sive “waves” of infection or competition for nutrients.
enterica show intermediate BB increases with time. The fluctuation Doppler spectra of the DLD-1 tissue prior to
A key biodynamic metric is the temporal speckle contrast infection and 6 h after infection are shown in Fig. 3a for the four
quantified as the normalized standard deviation of the backscatter bacterial strains. The spectral power in the mid frequencies
brightness that expresses the overall Doppler activity of the tissue between 0.1 and 1 Hz is suppressed in all cases by the infection.
and is displayed as motility contrast images (MCI). MCI before The associated time-frequency spectrograms are shown in Fig. 3b.
and 6 h after infection by the four bacteria strains are shown in The spectrograms are calculated using16
Fig. 2b. The decrease in MCI under bacterial infection is a
combination of increased BB and a change in Doppler activity. Dðν; t Þ ¼ log Sðν; t Þ log Sðν; t0 Þ ð1Þ
COMMUNICATIONS BIOLOGY | (2021)4:178 | https://doi.org/10.1038/s42003-020-01550-8 | www.nature.com/commsbio 3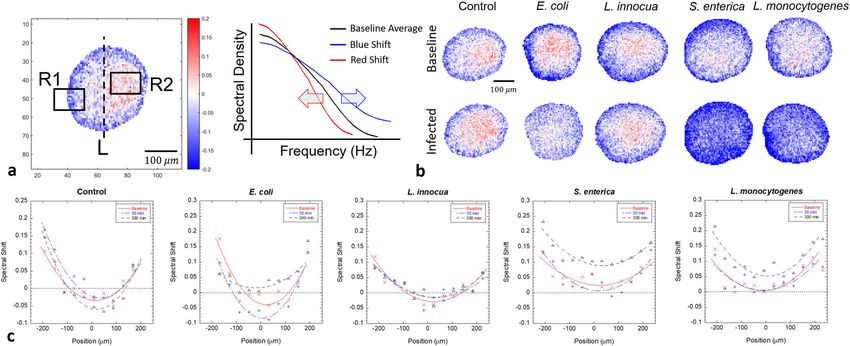
ARTICLE                                                                   COMMUNICATIONS BIOLOGY | https://doi.org/10.1038/s42003-020-01550-8

Fig. 2 Examples of DLD-1 multicellular tumor spheroids before and after infection. a Optical coherence images (OCI) of the optical mid-sections from
DLD-1 spheroids showing backscatter brightness before (left) and 6 h after (right) infection by 107 bacterial CFU per well. The strongest increase in
backscatter brightness (BB) occurs for E. coli (note second OCI column). b Motility contrast images (MCI) for the same samples. The growth of the
bacteria causes a strong inhibition of Doppler activity for E. coli (note second MCI column) and moderate inhibition of Doppler activity for Listeria
monocytogenes and Salmonella enterica serovar Enteritidis. Slowly proliferating Listeria innocua shows the smallest effect. The scale bar applies to all speckle
images. c Temporal evolution in BB as a function of time after inoculation (red dashed line). Infection by E. coli produces a large increase in BB. d Dynamic
range (DR) of the spectral density changes non-monotonically as a function of time. The error bars represent standard error.

where S is the spectral power density, ν is the Doppler frequency                but displays a moderate enhancement at higher frequencies
shift, and t0 is the baseline time when the bacteria are pipetted                (associated with organelle transport). In addition to these
into the well. Spectral power densities were normalized by the                   mechanistic effects, growing bacteria deplete limited resources
intensity or by zero-sum to obtain relative dynamic density and                  in a growth medium and increase CO2 concentration that alters
spectral shape change, respectively (Supplementary Figs. 1 and 2).               the pH level in the growth medium, which can perturb cellular
The baseline spectrum of the DLD-1 tissue is established for 1.5 h               dynamics47 (Supplementary Table 1). Pathogenic S. enterica is
prior to inoculation (infection) by the bacteria, and the relative               internalized and replicates inside host cells inducing active
change in the spectral power is tracked for 6 h after infection. The             organelle transfer for replication, which is consistent with high-
spectrograms for all bacteria show suppressed spectral densities                 frequency enhancement. The temporal responses occur slowly,
(decreased intracellular dynamics), although S. enterica shows a                 and the contour lines show the trends of the spectral shifts.
slight high-frequency enhancement with weak suppression at                       The standard deviations of the spectral responses over the
low-frequency. The effects of bacterial infection on the tissue                  sample replicates (N = 68, 36, 12, and 13, respectively) for all
dynamics are extremely marked. The spectral changes induced by                   frequency bands are σcontrol = 0.01, σE. coli = 0.30, σS. enterica =
the bacterial infection with an initial dose of 106 CFU/well are                 0.03, σL. monocytogenes = 0.08, and σL. innocua = 0.01.
two to five times larger than is typically observed for cytostatic or
cytotoxic drug effects (usually
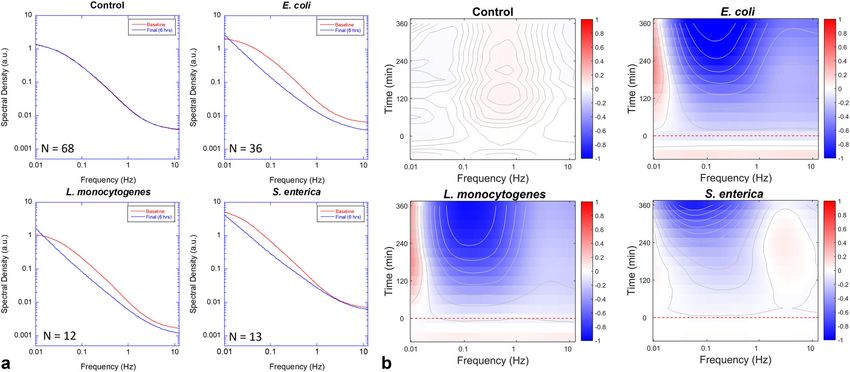
COMMUNICATIONS BIOLOGY | https://doi.org/10.1038/s42003-020-01550-8                                                                          ARTICLE

Fig. 3 Spectral responses by various bacteria. a Changes in the Doppler spectra (intensity normalized) for the four bacterial strains with initial loads of 106
CFU per well. Mid frequencies are inhibited in all cases with the strongest effect from E. coli. The high-frequency Nyquist floor (related to organelle
transport) increases noticeably for S. enterica. The values for N are the number of replicate samples used in the average. The uncertainty in spectral
amplitudes is ±4%. b The associated spectrograms are generated using Eq. (2). The samples are inoculated (red dashed line) after a baseline is
established. The contours (10 in each graph) help show the general trends.

Fig. 4 Representative cases of tissue-dynamics spectroscopic images (TDSI) of bacterial invasion of 107 CFU into a DLD colon adenocarcinoma tumor
spheroid. a The linear filter used here measures red or blue shifts of spectral shape (zero-sum normalization). The untreated control displays a small blue
shift (blue colored) in the outer layers (R1) and a small redshift (red-colored) in the core (R2) over the duration of the experiment (5 h). b L. innocua is
indistinguishable from the control. S. enterica and L. monocytogenes display strong blue shifts throughout the volume within 300 m after infection. The blue
shift for E. coli is intermediate between the pathogenic strains and the control. The scale bar applies to all other speckle images in b. c One-dimensional
plots of TDSI along the axis L in a. The pathogen group (L. monocytogenes and S. enterica) display blue shifts throughout the volume. The y axis represents
the relative change in average Doppler frequency (knee frequency of the spectrum) The two pathogenic strains induce approximately a 15% increase in
intracellular speeds.

across the optical section of the sample. Spectral pattern filters                intracellular speeds, respectively. The control (Fig. 4b, top row)
track spectral shape changes, which are related to mechanistic                   shows a slight blue shift in the outer regions of the tumor
changes in the tissue (such as a change in the average intracellular             spheroids accompanied by a slight redshift in the core region. The
speed), and tissue-dynamics spectroscopic images (TDSI) are                      core region of larger spheroids (approx. half a millimeter) is
generated that map out these mechanistic effects across the                      relatively hypoxic, and transport limitations can decrease nutrient
optical section of the sample. Examples of TDSI from the infec-                  concentration. Infection by (Fig. 4b, bottom row) E. coli, S.
tion by the bacterial strains are shown in Fig. 4. The linear filter in           enterica, and L. monocytogenes produces blue shifts associated
this example is a first-order Legendre polynomial that captures                   with high-speed dynamics. The two invasive strains, S. enterica,
the red or blue shift of frequencies within a group of pixels. The               and L. monocytogenes show the strongest blue shifts that uni-
shifts are associated with decreased or increased average                        formly infect the entire spheroid after 5 h, consistent with the

COMMUNICATIONS BIOLOGY | (2021)4:178 | https://doi.org/10.1038/s42003-020-01550-8 | www.nature.com/commsbio                                                  5
ARTICLE COMMUNICATIONS BIOLOGY | https://doi.org/10.1038/s42003-020-01550-8
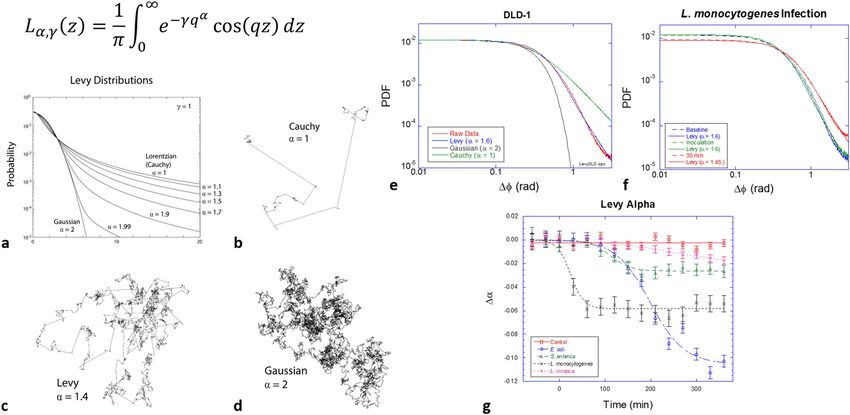
Fig. 5 Lévy statistics in living tissue and anomalous random walks associated with Levy flights. a Lévy probabilities. Lévy processes with smaller alpha
have more frequent ballistic motions and are less ballistic with larger alpha. b–d Examples of Lévy random walks displaying the heavy tail of persistence
lengths. e The PDF of DLD-1 tissue with a Lévy exponent of α = 1.6. f The PDF of tissue infected by L. monocytogenes (107 CFU/well), showing a measurable
shift to α = 1.4 in only 1.5 h. g Temporal shifts of Levy exponents from multiple samples infected with the four strains of bacteria. Error bars represent
standard error. A logistic function was used to fit the data.
ability of these bacteria to invade and colonize volumetric tissue. DLD-1 tissue is shown in Fig. 5e with best fits to Gaussian (α = 2)
E. coli shows only slightly increased activity in the core region and Cauchy (α = 1) distributions and a Lévy distribution with α =
over long times, and the dominant blue shifts are restricted to the 1.6 (best fit), showing clear evidence for the collective Lévy
outer region, consistent with the weaker ability of E. coli to properties of the intracellular dynamics of the DLD-1 tissue
penetrate the volume of living tissue. The non-invasive (and non- sample (Supplementary Fig. 5).
pathogenic) strain L. innocua is indistinguishable from the con- Levy flights enable a “Levy alpha spectroscopy” of bacterial
trol (no infection). The shifts begin in the outer regions of the infection based on phase-sensitive BDI by including the effect of
spheroid and move inward over several hours as the infection bacterial infection on the Lévy-alpha exponent. An example is shown
spreads, as shown in Fig. 4c for the profiles of the average spectral in Fig. 5f for DLD-1 tumor spheroids infected by L. monocytogenes.
shift, with redshifts in the inner core and blue shifts in the outer Within only 30 m after infection, a measurable change in the PDF
shell that move inward over hours. has occurred. The original PDF before the infection has a Levy
distribution with a Levy exponent α = 1.6, which reduces to α = 1.4
(more “Cauchy-like”) after infection. Lower alpha values pertain to
Lévy-alpha spectroscopy. Lévy-stable probability distributions heavier tails and stronger outliers in the PDF, possibly related to
(shown in Fig. 5a) have a central role in probability theory and are increased transport persistence length caused by the internal
being applied with increasing regularity to physical systems that propulsion of the pathogenic bacteria. The change in alpha values
sample from distributions with heavy tails48. For instance, Lévy for multiple sample replicates responding to the four bacterial strains
walks (Fig. 5b–d) with Lévy distributions of path lengths or per- studied here are shown in Fig. 5g. The rapid shift of the Levy alpha
sistence times are random walks that have divergent mean-squared for the case of L. monocytogenes inoculation is consistent with rapid
displacement and have been found to describe diverse processes in invasion by L. monocytogenes6,7,14. Other strains show a slower
the biological sciences48, including foraging behavior that may reduction in the Levy alpha. The largest decrease is observed for E.
benefit from Lévy walks to optimize search strategies9,49,50, bac- coli, which also had a large increase in the backscatter brightness for
terial motion8,51, and the migration of T-cells52. Recent evidence this bacterium at 107 CFU/well.
suggests that Lévy walks govern intracellular motions53–55. This is
of particular interest in our use of Doppler light scattering to
interrogate living tissue. We have developed a new measure of the Antibiotic response of bacterial infection. An important appli-
dynamic response of living tissue based on phase-sensitive BDI cation of the living tissue sentinels is to serve as a dynamic
and probability distribution functions (PDF) of phase changes in substrate for the study of antibiotic sensitivity and resistance.
40-millisecond windows (see “Methods” section). The chief para- Previous studies of BDI in drug development and personalized
meter for a symmetric Lévy distribution is known as the “alpha” medicine classified the response of living biopsy samples from
parameter. When α = 2, then the Lévy distribution is identical to a patients enrolled in clinical trials into sensitive or resistant
Gaussian with convergent moments. When α = 1, the Lévy dis- cohorts22. In the current microbiology context, the test samples
tribution is identical to a Lorentzian lineshape, also known as a are the immortalized DLD-1 sentinels that perform as dynamic
Cauchy distribution. The first moments diverge for all α < 2 and substrates on which to observe the dynamic effects of infection
diverge more rapidly as alpha approaches the Cauchy distribution and to observe how the infection responds to antibiotic treat-
with the heaviest tails. Heavy tails mean strong outliers of large ments. The goal is to identify biodynamic spectral signatures that
and rare events. The PDF of the phase fluctuations in healthy correlate with the efficacy of the antibiotic.
6 COMMUNICATIONS BIOLOGY | (2021)4:178 | https://doi.org/10.1038/s42003-020-01550-8 | www.nature.com/commsbioCOMMUNICATIONS BIOLOGY | https://doi.org/10.1038/s42003-020-01550-8 ARTICLE
Fig. 6 Time evolution of the spectral density of DLD-1 sentinels. The top row shows the (intensity normalized) spectrogram responses for the infected
DLD-1 sentinels. The dashed red line is the time of bacterial inoculation, and the dashed black line is the time of antibiotic application. The bottom row
shows the responses of the DLD-1 sentinel controls without bacterial infection. E. coli infection induces broadband suppression of activity (top of left
column). Treatment with ampicillin (middle column) has little effect on the infected tissue, but ciprofloxacin (right column) halts and reverses the infection,
returning the tissue to a response similar to the uninfected control. The replicate numbers are shown at the top-left corner of the spectrogram plots.
An example of antibiotic treatment is shown in Fig. 6 for E. coli living tissue is extremely sensitive to subtle changes in intracel-
at an initial load of 106 CFU per well infecting DLD-1 tissue lular dynamics, and BDI provides a powerful new technique for
sentinels and then treated with ampicillin and ciprofloxacin monitoring the response of 3D living tissue to xenobiotic chal-
(broadband antibiotics). The E. coli strain used for the antibiotic lenges. In this paper, we describe the first use of BDI to monitor
resistance assay has ampicillin resistance enabling the bacteria to the infection of 3D living tissue by bacteria. Bacteria affect many
survive up to a dose of 50 μg/ml ampicillin43,56. In contrast, of the dynamic processes within the living host, allowing the
ciprofloxacin suppresses the proliferation of E. coli because cellular response to perform the role of a living sentinel, reporting
ampicillin resistance is unrelated to ciprofloxacin resistance57. At on the effects of the bacterial infection as well as monitoring the
the time of inoculation, the DLD-1 sentinels are exposed to 106 efficacy of antibiotic treatments. To illustrate the principle of the
CFU per well of E. coli. BDI tracks the E. coli infection spectrum living sentinel, tumor spheroids of the DLD-1 colon adeno-
of DLD-1 for 4.5 h, at which time three different treatments are carcinoma cell lines were used to highlight different character-
applied to the DLD-1 sentinels in separate wells: growth medium istics caused by infection by different bacterial strains. The
(control), ampicillin (50 μg/ml), and ciprofloxacin (3.5 μg/ml)56. spectral enhancements represent changes in dynamics with dif-
The time-course spectrograms are shown in Fig. 6 for the three ferent frequency ranges associated with different types of intra-
treatments. The top row shows the responses for the infected cellular motion. In particular, the Levy alpha spectroscopy
DLD-1 sentinels. The dashed red line is the time of bacterial represents a new form of an optical assay that can assess the
inoculation, and the dashed black line is the time of antibiotic character of bacterial infections. This work demonstrates the
application. The bottom row shows the responses of the DLD-1 potential to translate BDI to the clinic to test for antibiotic-
sentinel controls without bacterial infection. The controls are resistant infections.
similar for all treatments, displaying a mild mid-frequency The in vitro protocols presented here could perform a perso-
enhancement in response to the treatment that includes nalized selection of antibiotics by incubating patient-derived
replenished growth medium with nutrients. The DLD-1 sentinels bacteria with the tissue sentinels and then testing the efficacy of a
with bacterial infection show a broadband suppression of activity battery of conventional antibiotics. Many existing assays for
within the tissue. Application of ampicillin has little effect (for antibiotic selection require ~6–8 h58 with recent rapid assays able
this ampicillin-resistant strain), while ciprofloxacin removes the to provide results within 3 h59. Scaling the size of the current 600-
bacterial infection and returns the tissue to a condition micron scale tissue sentinels down to tissue microclusters that
comparable to the control. contain approximately a thousand cells could be sensitive enough
to measure infection of a microcluster by a single bacterium once
it has doubled ten times over about 3 h, making the biodynamic
Discussion approach comparable to other rapid assays in terms of speed.
Light scattered from living tissue displays a broad range of All measurements presented here were performed in vitro on
Doppler frequency shifts related to complex cellular processes artificially grown tissue sentinels. An intriguing prospect is to
and their associated dynamic motion. The Doppler fingerprint of perform biodynamic imaging in vivo. The current optical design
COMMUNICATIONS BIOLOGY | (2021)4:178 | https://doi.org/10.1038/s42003-020-01550-8 | www.nature.com/commsbio 7ARTICLE COMMUNICATIONS BIOLOGY | https://doi.org/10.1038/s42003-020-01550-8
uses a Mach–Zehnder interferometer that is sensitive to Doppler signal has a broadband power spectral density with zero mean, and the
mechanical vibrations and patient motions, limiting its use in the variance depends on ω2D . Doppler power spectra of the low-frequency band from
in vivo setting. However, merging biodynamic imaging with 0.01 to 0.1 Hz corresponds to speeds of 3–30 nm/s relating to cell shape changes
and slowly-spreading motions such as cell crawling. The mid-frequency band from
common-path configurations60,61 could remove sensitivity to 0.1 to 1 Hz corresponds to speeds from 30 to 300 nm/s associated with nuclear
global motions caused by breathing and by diastolic and systolic motions and membrane processes. The high-frequency band from 1 to 10 Hz
pressures. This raises the possibility to perform in vivo scans of corresponds to speeds from 0.3 to 3 μm/s associated with organelle motion35.
the intracellular activity of infected tissue on accessible external Power spectra are acquired by performing a temporal Fourier transform of the OCI
reconstructions for individual pixels and then averaging over the image pixels. The
surfaces or on internal surfaces through the use of an endoscope. BDI system records digital holographic images at 25 frames-per-second (fps). Each
measurement of a well records 10-background images and 2048 holographic
Methods images for 85 s. A full-cycle scan of 16 wells in the multi-well plate takes 30 min.
Eukaryotic and prokaryotic sample preparation. Bacteria samples were cultured
in LB (Lysogeny-broth) medium for 24 h at 37 °C. LB medium is a solution of 1% Time-lapse TDSI. Tissue-dynamics spectroscopic imaging (TDSI) maps the spatial
tryptone, 0.5% bacto-yeast extract, 1% sodium chloride and 0.1% glucose. After 24- response across a tissue sample39. Although tissues are grown from genetically
hours, bacterial concentration in the LB medium reaches 108 CFU/ml. The repli- identical cells, their interactions with the external environment are not homo-
cation speed of L. innocua is slower than either E. coli GFP, S. enterica, or L. geneous. Conventional BDI takes averages of the power spectra across the entire
monocytogenes, requiring a 48-h culturing period. tissue sample, but spatial information is lost. To study the spatial characteristics of
DLD-1 is an adenocarcinoma standard colon cancer cell line. DLD-1 spheroids tissues, the spectral responses are obtained for each pixel of the OCI reconstruction.
were chosen for studying bacteria-mammalian cell interaction because food-borne After measuring the baseline spectra for each pixel, the TDSI algorithm compares
pathogens interact preferentially with epithelial cells, and the properties of the the spectral variation over time compared to the averaged baseline of the sample.
DLD-1 have been studied thoroughly by BDI. The DLD-1 cell stock was purchased Spectral shape changes can be mapped using biomarkers, and the multi-color
from American Type Culture Collection (ATCC, Manassas VA) and cells were algorithm marks pixels with red when the spectral response is strongly correlated
grown in RPMI-1640 medium containing 25 mm HEPES buffer (Gibco) to the biomarker and blue for anticorrelated. The TDSI biomarker used in Fig. 4 is
supplemented with 10% fetal bovine serum (Atlanta Biologicals) and 100 U SDIP0 that represents a blue or redshift of frequencies caused by increased or
penicillin/ml-100 µg/ml streptomycin (Gibco). Multicellular spheroids were created decreased speeds of intracellular motion (Supplementary Note 3 and Tables 3–5).
by seeding 10,000 cells per well into spheroid microplates (Corning) for 4–5 days
with media being replenished every 2 days. For biodynamic experiments, the
spheroids were transferred to 96-well BioCoat plates (Corning) in an antibiotic-free Phase-sensitive BDI. A reconstructed image contains phase information through
growth medium and allowed to adhere for several hours. Paclitaxel was purchased the Fourier transform of the digital hologram that generates a complex-valued
from Selleck Chemicals. reconstructed image. In the conventional operation mode of BDI, the Doppler
Desired bacterial doses (107 CFU/well) applied to the DLD samples were signals from dynamic speckle are extracted by taking the absolute value of the
achieved by diluting the bacterial medium with a mammalian cell-culturing reconstructed image. This is equivalent to homodyne detection in which the
medium (RPMI-1640). To minimize the pipetting perturbation on DLD-1 cells, the fluctuation power spectrum is the superposition among all the different Doppler
volume of the applied medium was set to 10 μl. To apply 106 CFU, the prepared frequency shifts. Homodyne fluctuation spectra are stabilized against phase drift of
bacterial medium was diluted to 10%. the Mach–Zehnder interferometric configuration of the optical system, which is
Experiments consisted of 16-well measurements on a 96-well plate. Each well sensitive to low-frequency mechanical disturbances. In phase-sensitive BDI the
contained a single DLD-1 spheroid and was filled with a growth medium volume of complex reconstructed image is retained and the phase for each pixel is calculated
350 μl. DLD-1 spheroids were immobilized on the bottom of the wells using poly- using a 4-quadrant arctangent. However, by taking phase differences between
D-lysin. To infect the spheroids, the DLD-1 samples were exposed to the diluted
frames (40 ms), global phase drift is subtracted, and conventional phase unwrap-
bacteria medium allowing the bacteria to interact with the cells directly. Before ping techniques are applied at the branch cut. Histogramming the phase differ-
applying bacteria, 3 baseline measurements were made over 90 m. After the ences generates a phase probability distribution function (PDF), which is analyzed
baseline measurement, 10 μl of the diluted bacterial medium was pipetted into for Lévy-stable properties. The tail of the Lévy distribution of phase differences is
wells. Each well was monitored repeatedly by BDI for more than 6 h to detect insensitive to global phase drift.
interactions between bacteria and DLD-1 cells.
Bacterial antibiotic responses were measured by applying antibiotics after Lévy-alpha spectroscopy. The phase difference Δϕ distribution in Fig. 5e, f shows
applying bacteria to the DLD-1 spheroids. To measure antibiotic resistance, E. coli a heavy tail. If dynamic particles move as normal random walkers the distribution
green-fluorescence protein (GFP) strain was selected. E. coli GFP has ampicillin would be a Gaussian distribution. However, many biological processes have ran-
resistance because genes are genetically engineered to have an ampicillin resistance dom walks with anomalous (and infrequent) ballistic motions known as a Lévy
gene at the same promoter as the GFP-synthesizing gene43. Ampicillin and walk. Lévy walk displacement (Δx) distributions have power-law tails. The slope of
ciprofloxacin were prepared with doses of 50 and 3.5 μg/ml, respectively. the tail is determined by the parameter α of the Lévy distribution, which is given by
Ampicillin and ciprofloxacin are broadband antibiotics, which are effective on ref. 62 as
gram-negative and gram-positive strains. E. coli GFP was applied to the DLD-1
Z1
spheroids. The antibiotics were applied 4.5 h after the infection, after which the 1 α
Doppler spectra were measured for up to 9 h. Lα; γ ðz Þ ¼ eγq cosðqz Þdq: ð3Þ
π
0
Ranging with biodynamic imaging. Biodynamic imaging (BDI) is configured as a Lévy distributions obtained numerically are used to fit the phase difference
Mach–Zehnder digital holographic interferometer with a low-coherence super- distribution of tumor spheroids with a residual-square minimization algorithm.
luminescent-diode (SLD) infrared light source (Fig. 1a). The wavelength of the SLD
used in these experiments is 840 nm with 50 nm bandwidth, and the estimated Power spectral density and spectrogram normalization methods. When the
coherence length is around 10 μm. Interference only occurs when the optical path backscatter brightness of a target changes over time, the un-normalized spectral
length difference between the two arms is within the coherence length. Coherence- power density includes the shift in optical power. However, it may be desirable to
gating uses the optical path-sensitive interference characteristics of the low- compensate for this changing brightness to focus on spectral shifts, and normal-
coherence to select photons scattered from a specified distance inside the tissue. ization choices emerge. Three different normalizations of time-frequency spec-
Tumor spheroids have three-dimensional isotropic dynamics and BDI measures trograms are used.
the volumetric dynamics of tumor spheroids. The coherence gate selects a two-
dimensional cross-sectional area of the spheroids. When an interference pattern Snorm ðν; t Þ ¼ Sraw ðν; tÞ; ð4Þ
forms at the Fourier plane in Fig. 1, an optical coherence image (OCI) is acquired
by performing a spatial Fourier transform of the digital hologram. A time series of Sraw ðν; tÞ
Snorm ðν; t Þ ¼ ; ð5Þ
multiple OCI frames represents the time-dependent fluctuating dynamic speckle I2
carrying broadband Doppler signals that encode the cellular dynamics. A Doppler
shift induced by scattering with a dynamic particle is given by 21, S ðν; tÞ
Snorm ðν; t Þ ¼ R 12:5 raw : ð6Þ
4nπ θ 0:01 Sraw ðν; tÞdν
ωD ¼ v sin cosξ; ð2Þ The first method (in Eq. (4)) is un-normalized, capturing changes in sample
λ 2
brightness. The second method (in Eq. (5)) normalizes spectral density by the total
where v, n, θ, and ξ are the speed, refractive index of the medium, scattering angle, signal intensity squared for the so-called intensity normalization. This
and angle between the velocity of the particle and wavevector, respectively. As normalization leads to time-frequency spectrograms that faithfully reflect the
implemented here, BDI captures the backscatter signals and the 3-dimensional relative change in spectral power density across all frequencies. The third method
dynamics are assumed to be isotropic. Therefore the scattering angle θ is π and 0 ≤ (in Eq. (6)) normalizes the total power spectral density within the sampling
ξ ≤ 2π with an isotropic distribution. Due to the isotropic dynamic distribution, the bandwidth for the so-called zero-sum normalization. The sum of the spectral
8 COMMUNICATIONS BIOLOGY | (2021)4:178 | https://doi.org/10.1038/s42003-020-01550-8 | www.nature.com/commsbioCOMMUNICATIONS BIOLOGY | https://doi.org/10.1038/s42003-020-01550-8 ARTICLE
changes across the BDI bandwidth 0.01–12.5 Hz is set to zero for each time frame. 24. O’Neill, J. Antimicrobial Resistance: Tackling a Crisis for the Health and
This normalization captures spectral shifts constrained by a zero-sum. Wealth of Nations (The Review on Antimicrobial Resistance, London, 2014).
25. Marshall, B. M. & Levy, S. B. Food animals and antimicrobials: impacts on
Statistics and reproducibility. All statistics in the manuscript were processed by human health. Clin. Microbiol. Rev. 24, 718–33. (2011).
MATLAB (R2015a). The statistical averages and standard deviations were acquired 26. Mathew, A. G., Cissell, R. & Liamthong, S. Antibiotic resistance in bacteria
among all replicates without data rejections. The replicate numbers are defined as a associated with food animals: a United States perspective of livestock
number of independent specimens. production. Foodborne Pathog. Dis. 4, 115–33. (2007).
27. Rhodes, A. et al. A prospective study of the use of a dobutamine stress test to
identify outcome in patients with sepsis, severe sepsis, or septic shock. Crit.
Reporting summary. Further information on research design is available in the Nature Care Med. 27, 2361–2366 (1999).
Research Reporting Summary linked to this article. 28. Rivers, E. P. & Ahrens, T. Improving outcomes for severe sepsis and septic
shock: tools for early identification of at-risk patients and treatment protocol
Data availability implementation. Crit. Care Clin. 24, S1–S47 (2008).
Data are available upon request mailed to nolte@purdue.edu 29. Evans, J. et al. Fluctuations of the red blood cell membrane: relation to
mechanical properties and lack of ATP dependence. Biophys. J. 94, 4134–4144
(2008).
Received: 10 April 2020; Accepted: 25 November 2020; 30. Strey, H. & Peterson, M. Measurement of erythrocyte-membrane elasticity by
flicker eigenmode decomposition. Biophys. J. 69, 478–488 (1995).
31. Tamura, K. et al. Active fluctuation in the cortical cytoskeleton observed by
high-speed live-cell scanning probe microscopy. Acta Biomater. 7, 3766–3772
(2011).
References 32. Betz, T. et al. ATP-dependent mechanics of red blood cells. Proc. Natl Acad.
1. Van Engelenburg, S. B. & Palmer, A. E. Imaging type-III secretion reveals Sci. USA 106, 15320–15325 (2009).
dynamics and spatial segregation of Salmonella effectors. Nat. Methods 7, 33. Nan, X. L., Sims, P. A. & Xie, X. S. Organelle tracking in a living cell with
325–330 (2010). microsecond time resolution and nanometer spatial precision.
2. Munter, S., Way, M. & Frischknecht, F. Signaling during pathogen infection. ChemPhysChem 9, 707–712 (2008).
Sci. STKE 2006, re5 (2006). 34. Racine, V. et al. Visualization and quantification of vesicle trafficking on a
3. Johnson, L. R. Microcolony and biofilm formation as a survival strategy for three-dimensional cytoskeleton network in living cells. J. Microsc. 225,
bacteria. J. Theor. Biol. 251, 24–34 (2008). 214–228 (2007).
4. Li, Y. et al. LPS remodeling is an evolved survival strategy for bacteria. Proc. 35. Brazhe, N. A. et al. Unraveling cell processes: interference imaging interwoven
Natl Acad. Sci. USA 109, 8716–8721 (2012). with data analysis. J. Biol. Phys. 32, 191–208 (2006).
5. Freyberg, Z. & Harvill, E. T. Pathogen manipulation of host metabolism: A 36. Trinczek, B., Ebneth, A. & Mandelkow, E. Tau regulates the attachment/
common strategy for immune evasion. PLoS Pathog. 13, e1006669 (2017). detachment but not the speed of motors in microtubule-dependent transport
6. Soo, F. S. & Theriot, J. A. Large-scale quantitative analysis of sources of of single vesicles and organelles. J. Cell Sci. 112, 2355–2367 (1999).
variation in the actinpolymerization-based movement of Listeria 37. Jeong, K., Turek, J. J. & Nolte, D. D. Speckle fluctuation spectroscopy of
monocytogenes. Biophys. J. 89, 720–723. (2005). intracellular motion in living tissue using coherence-domain digital
7. Ortega, F. E., Koslover, E. F. & Theriot, J. A. Listeria monocytogenes cell-to-cell holography. J. Biomed. Opt. 15, 030514 (2010).
spread in epithelia is heterogeneous and dominated by rare pioneer bacteria. 38. Yu, P. et al. Time-dependent speckle in holographic optical coherence imaging
Elife 8, e40032 (2019). and the state of health of tumor tissue. Opt. Lett. 29, 68–70 (2004).
8. Ariel, G. et al. Swarming bacteria migrate by Levy Walk. Nat. Commun. 6, 39. Li, Z. et al. Tissue dynamics spectroscopic imaging: functional imaging of
8396 (2015). heterogeneous cancer tissue. J. Biomed. Opt. 25, 096006 (2020).
9. Humphries, N. E. & Sims, D. W. Optimal foraging strategies: Levy walks 40. Unger, C. et al. Modeling human carcinomas: physiologically relevant 3D
balance searching and patch exploitation under a very broad range of models to improve anti-cancer drug development. Adv. Drug Deliv. Rev. 79-
conditions. J. Theor. Biol. 358, 179–93. (2014). 80, 50–67 (2014).
10. Kostanyan, T., Wollstein, G. & Schuman, J. S. New developments in optical 41. Weigelt, B., Ghajar, C. M. & Bissell, M. J. The need for complex 3D culture
coherence tomography. Curr. Opin. Ophthalmol. 26, 110–115 (2015). models to unravel novel pathways and identify accurate biomarkers in breast
11. Coombes, J. L. & Robey, E. A. Dynamic imaging of host-pathogen interactions cancer. Adv. Drug Deliv. Rev. 69-70, 42–51 (2014).
in vivo. Nat. Rev. Immunol. 10, 353–364 (2010). 42. Baker, B. M. & Chen, C. S. Deconstructing the third dimension: how
12. Germain, R. N., Robey, E. A. & Cahalan, M. D. A decade of imaging cellular 3D culture microenvironments alter cellular cues. J. Cell Sci. 125, 3015–24.
motility and interaction dynamics in the immune system. Science 336, (2012).
1676–1681 (2012). 43. Fratamico, P. M. et al. Construction and characterization of Escherichia coli
13. Valdivia, R. H. & Falkow, S. Fluorescence-based isolation of bacterial genes 0157:H7 strains expressing firefly luciferase and green fluorescent protein and
expressed within host cells. Science 277, 2007–2011 (1997). their use in survival studies. J. Food Protect. 60, 1167–1173 (1997).
14. Waite, J. C. et al. Dynamic imaging of the effector immune response to listeria 44. Elliott, N. et al. Proliferation behavior of E. coli in a three-dimensional in vitro
infection in vivo. PLoS Pathog. 7, e1001326 (2011). tumor model. Integr. Biol. 3, 696–705 (2011).
15. Voznica, J. et al. Identification of parameters of host cell vulnerability during 45. Slaghuis, J. et al. Inefficient replication of Listeria innocua in the cytosol of
Salmonella infection by quantitative image analysis and modeling. Infect. mammalian cells. J. Infect. Dis. 189, 393–401 (2004).
Immun. 86, e00644-17 (2018). 46. Sun, H. et al. Biodynamic imaging for phenotypic profiling of three-
16. Nolte, D. D. et al. Tissue dynamics spectroscopy for phenotypic profiling of dimensional tissue culture. J. Biomed. Opt. 22, 16007 (2017).
drug effects in three-dimensional culture. Biomed. Opt. Express 3, 2825–2841 47. Nolte, D. D. et al. Holographic tissue dynamics spectroscopy. J. Biomed. Opt.
(2012). 16, 087004 (2011).
17. de Boer, J. F., Hitzenberger, C. K. & Yasuno, Y. Polarization sensitive optical 48. Zaburdaev, V., Denisov, S. & Klafter, J. Lévy walks. Rev. Mod. Phys. 87,
coherence tomography—a review [Invited]. Biomed. Opt. Express 8, 483–530 (2015).
1838–1873 (2017). 49. de Jager, M. et al. Levy walks evolve through interaction between movement
18. Thouvenin, O. et al. En face coherence microscopy [Invited]. Biomed. Opt. and environmental complexity. Science 332, 1551–1553 (2011).
Express 8, 622–639 (2017). 50. Palyulin, V. V., Chechkin, A. V. & Metzler, R. Levy flights do not always
19. Li, Z. et al. Doppler fluctuation spectroscopy of intracellular dynamics in optimize random blind search for sparse targets. Proc. Natl Acad. Sci. USA
living tissue. J. Opt. Soc. Am. A Opt. Image Sci. Vis. 36, 665–677 (2019). 111, 2931–2936 (2014).
20. An, R. et al. Phenotypic profiling of Raf inhibitors and mitochondrial toxicity 51. Detcheverry, F. Generalized run-and-turn motions: from bacteria to Levy
in 3D tissue using biodynamic imaging. J. Biomol. Screen. 19, 526–537 (2014). walks. Phys. Rev. E 96, 012415 (2017).
21. Choi, H. et al. Biodynamic digital holography of chemoresistance in a pre- 52. Harris, T. H. et al. Generalized Levy walks and the role of chemokines in
clinical trial of canine B-cell lymphoma. Biomed. Opt. Express 9, 2214–2228 migration of effector CD8+ T cells. Nature 486, 545–548 (2012).
(2018). 53. Fedotov, S. et al. Memory effects and Levy walk dynamics in intracellular
22. Li, Z. et al. Intracellular optical doppler phenotypes of chemosensitivity in transport of cargoes. Phys. Rev. E 98, 042136 (2018).
human epithelial ovarian cancer. Sci. Rep. 10, 17354 (2020). 54. Moon, K. & Moon, H. C. Tug-of-war in motor proteins and the emergence of
23. An, R. et al. Biodynamic imaging of live porcine oocytes, zygotes and Levy walk. Phys. A Stat. Mech. Appl. 515, 65–71 (2019).
blastocysts for viability assessment in assisted reproductive technologies. 55. Song, M. S. et al. Neuronal messenger ribonucleoprotein transport follows an
Biomed. Opt. Express 6, 963–976 (2015). aging Levy walk. Nat. Commun. 9, 344 (2018).
COMMUNICATIONS BIOLOGY | (2021)4:178 | https://doi.org/10.1038/s42003-020-01550-8 | www.nature.com/commsbio 9ARTICLE COMMUNICATIONS BIOLOGY | https://doi.org/10.1038/s42003-020-01550-8
56. System, N. A. R. M. Retail Meat Report. https://www.fda.gov/media/84889/ Competing interests
download (2011). David Nolte and John Turek have a financial interest in Animated Dynamics, Inc. that is
57. Fernandesa, R., Amadord, P. & Prudencio, C. b-Lactams: chemical structure, commercializing cancer therapy selection services using biodynamic imaging systems.
mode of action and mechanisms of resistance. Rev. Med. Microbiol. 24, 7–17 The remaining authors declare no competing interests.
(2013).
58. Hombach, M. et al. Fully automated disc diffusion for rapid antibiotic
susceptibility test results: a proof-of-principle study. J. Antimicrob. Chemother.
Additional information
Supplementary information is available for this paper at https://doi.org/10.1038/s42003-
72, 1659–1668 (2017).
020-01550-8.
59. Heller, A. A. & Spence, D. M. A rapid method for post-antibiotic bacterial
susceptibility testing. PLoS ONE 14, e0210534–e0210534 (2019).
Correspondence and requests for materials should be addressed to D.D.N.
60. Shaked, N. T. et al. Reflective interferometric chamber for quantitative
phase imaging of biological sample dynamics. J. Biomed. Opt. 15, 030503
Reprints and permission information is available at http://www.nature.com/reprints
(2010).
61. Finkeldey, M. et al. Depth-filtering in common-path digital holographic
Publisher’s note Springer Nature remains neutral with regard to jurisdictional claims in
microscopy. Opt. Express 25, 19398–19407 (2017).
published maps and institutional affiliations.
62. Mantegna, R. N. Fast, accurate algorithm for numerical simulation of Levy
stable stochastic processes. Phys. Rev. E Stat. Phys. Plasmas Fluids Relat.
Interdiscip. Top. 49, 4677–4683 (1994).
Open Access This article is licensed under a Creative Commons
Attribution 4.0 International License, which permits use, sharing,
adaptation, distribution and reproduction in any medium or format, as long as you give
Acknowledgements appropriate credit to the original author(s) and the source, provide a link to the Creative
This work was supported by NSF grant CBET-1911357.
Commons license, and indicate if changes were made. The images or other third party
material in this article are included in the article’s Creative Commons license, unless
indicated otherwise in a credit line to the material. If material is not included in the
Author contributions article’s Creative Commons license and your intended use is not permitted by statutory
H.C., Z.H., and D.N. conducted BDI measurements and the spectral phenotype analysis. regulation or exceeds the permitted use, you will need to obtain permission directly from
Z.L. and D.N. developed TDSI algorithms and performed the regional speckle phenotype the copyright holder. To view a copy of this license, visit http://creativecommons.org/
analysis. H.C., J.Z., E.X., and M.L. prepared bacterial samples. J.T. designed host-cell licenses/by/4.0/.
characteristics and prepared DLD-1 spheroids. H.C., J.Z., E.X., M.L., and D. N. con-
tributed to measuring pathogenicity and antibiotic resistance bacteria spectral phenotype
measurements. All authors contributed to the discussions and writing of the manuscript. © The Author(s) 2021
10 COMMUNICATIONS BIOLOGY | (2021)4:178 | https://doi.org/10.1038/s42003-020-01550-8 | www.nature.com/commsbioYou can also read