Dynamic contrast-enhanced magnetic resonance imaging perfusion characteristics in meningiomas treated with resection and adjuvant radiosurgery
←
→
Page content transcription
If your browser does not render page correctly, please read the page content below
NEUROSURGICAL
            FOCUS                                                                                                                   Neurosurg Focus 46 (6):E10, 2019

                           Dynamic contrast-enhanced magnetic resonance imaging
                           perfusion characteristics in meningiomas treated with
                           resection and adjuvant radiosurgery
                           Swathi Chidambaram, MD,1 Susan C. Pannullo, MD,1 Michelle Roytman, MD,2
                           David J. Pisapia, MD,3 Benjamin Liechty, MD,3 Rajiv S. Magge, MD,4 Rohan Ramakrishna, MD,1
                           Philip E. Stieg, PhD, MD,1 Theodore H. Schwartz, MD,1 and Jana Ivanidze, MD, PhD2
                           Departments of 1Neurological Surgery; 2Radiology, Division of Neuroradiology, Division of Molecular Imaging and Therapeutics;
                           and 3Pathology and Laboratory Medicine; and 4Weill Cornell Medicine, Cornell University, New York, New York

                           OBJECTIVE There is a need for advanced imaging biomarkers to improve radiation treatment planning and response
                           assessment. T1-weighted dynamic contrast-enhanced perfusion MRI (DCE MRI) allows quantitative assessment of tis-
                           sue perfusion and blood-brain barrier dysfunction and has entered clinical practice in the management of primary and
                           secondary brain neoplasms. The authors sought to retrospectively investigate DCE MRI parameters in meningiomas
                           treated with resection and adjuvant radiation therapy using volumetric segmentation.
                           METHODS A retrospective review of more than 300 patients with meningiomas resected between January 2015 and
                           December 2018 identified 14 eligible patients with 18 meningiomas who underwent resection and adjuvant radiotherapy.
                           Patients were excluded if they did not undergo adjuvant radiation therapy or DCE MRI. Demographic and clinical char-
                           acteristics were obtained and compared to DCE perfusion metrics, including mean plasma volume (vp), extracellular
                           volume (ve), volume transfer constant (Ktrans), rate constant (kep), and wash-in rate of contrast into the tissue, which were
                           derived from volumetric analysis of the enhancing volumes of interest.
                           RESULTS The mean patient age was 64 years (range 49–86 years), and 50% of patients (7/14) were female. The aver-
                           age tumor volume was 8.07 cm3 (range 0.21–27.89 cm3). The median Ki-67 in the cohort was 15%. When stratified by
                           median Ki-67, patients with Ki-67 greater than 15% had lower median vp (0.02 vs 0.10, p = 0.002), and lower median
                           wash-in rate (1.27 vs 4.08 sec-1, p = 0.04) than patients with Ki-67 of 15% or below. Logistic regression analysis demon-
                           strated a statistically significant, moderate positive correlation between ve and time to progression (r = 0.49, p < 0.05).
                           Furthermore, there was a moderate positive correlation between Ktrans and time to progression, which approached, but
                           did not reach, statistical significance (r = 0.48, p = 0.05).
                           CONCLUSIONS This study demonstrates a potential role for DCE MRI in the preoperative characterization and stratifi-
                           cation of meningiomas, laying the foundation for future prospective studies incorporating DCE as a biomarker in menin-
                           gioma diagnosis and treatment planning.
                           https://thejns.org/doi/abs/10.3171/2019.3.FOCUS1954
                           KEYWORDS DCE MRI; meningioma; radiosurgery; perfusion

M
            eningiomas are the most common primary in-                                 trative pattern of growth, osseous or parenchymal invasion,
            tracranial tumors. Meningiomas are typically                               and/or postsurgical or postradiation change. Furthermore,
            treated with surgery and adjuvant radiation in                             a wide variety of intracranial lesions, both benign and ma-
cases of subtotal resection and/or higher histopathological                            lignant, have an MRI appearance that can closely mimic
grade.14,16 Postoperative MRI appearance is the gold stand-                            meningioma.17 Moreover, conventional MRI does not reli-
ard for adjuvant treatment planning, specifically stereotac-                           ably differentiate between subtypes of meningioma. Thus,
tic radiosurgery (SRS). However, MRI can have limited                                  there is a need for advanced imaging biomarkers to im-
sensitivity and specificity in cases demonstrating an infil-                           prove radiation treatment planning and response assess-

ABBREVIATIONS BED = biologically effective dose; DCE = dynamic contrast-enhanced; kep = rate constant; Ktrans = volume transfer constant; rCBV = relative cerebral
blood volume; SRS = stereotactic radiosurgery; TTP = time to progression; ve = extracellular volume; vp = mean plasma volume.
SUBMITTED January 31, 2019. ACCEPTED March 25, 2019.
INCLUDE WHEN CITING DOI: 10.3171/2019.3.FOCUS1954.

©AANS 2019, except where prohibited by US copyright law                                                            Neurosurg Focus Volume 46 • June 2019             1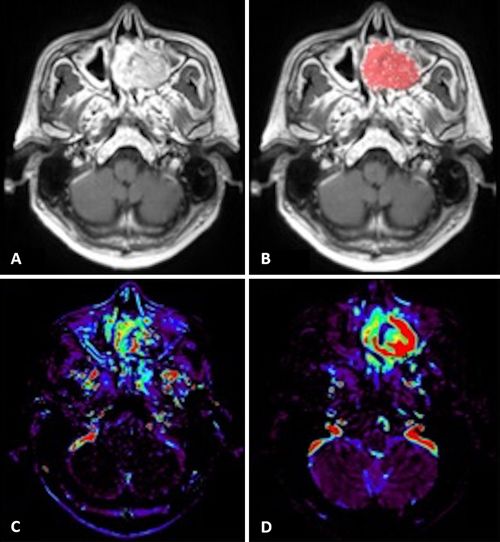
Chidambaram et al.

ment. T1-weighted dynamic contrast-enhanced (DCE)               processing and analysis (Figs. 1 and 2). Analysis was per-
perfusion MRI (DCE MRI) allows quantitative assess-             formed on volumes of interest that included the entire en-
ment of tissue perfusion and blood-brain barrier dysfunc-       hancing tumor volume, inclusive of all slices (Fig. 1). DCE
tion, and has entered clinical practice in primary and sec-     perfusion metrics, including mean plasma volume (vp),
ondary brain neoplasms.7 In meningioma, DCE MRI has             extracellular volume (ve), volume transfer constant (Ktrans),
been proposed as a tool to distinguish between lower- and       rate constant (kep), and wash-in rate of contrast into the tis-
higher-grade tumors and has also been utilized to differ-       sue were derived from volumetric analysis of the enhanc-
entiate meningiomas from dural-based metastases.12,19,20        ing volumes of interest.3
Moreover, peritumoral edema surrounding atypical me-
ningiomas has been shown to have distinct perfusion char-       Statistical Analysis
acteristics compared with benign meningiomas.20 Based               Statistical analysis was performed utilizing Graph-
on this prior work, we sought to retrospectively investigate    Pad Prism version 7. Patients were stratified by Simpson
DCE MRI parameters in meningiomas treated with resec-           grade, pathological WHO grade, Ki-67, tumor location,
tion and adjuvant radiation therapy and hypothesized that       and SRS dosing strategy, and the Mann-Whitney U-test
DCE perfusion MRI may be an informative biomarker in            was performed to identify statistically significant differ-
radiation therapy response assessment.                          ences between DCE parameters. ANOVA was performed
                                                                to determine statistical differences when stratification into
Methods                                                         3 subgroups was needed (WHO grade, SRS dosing strate-
Patients                                                        gy). Linear regression and Spearman correlation were also
    In this institutional review board approved–, Health In-    used to investigate the differences in permeability param-
surance Portability and Accountability Act compliant–ret-       eters when compared with TTP. The plots were made us-
rospective study, patients eligible for analysis were select-   ing ggplot2 in RStudio version 1.1.463 with R version 3.5.2
ed using retrospective chart review applying the following      (r-project.org; Fig. 3).
selection criteria. Based on a database of pathology-prov-
en resected meningiomas, more than 300 patients who un-
derwent resection between January 2015 and December             Results
2018 were screened for eligibility. Patients were excluded          Clinical and demographic characteristics of the study
if they did not undergo adjuvant radiation therapy and did      population and DCE parameters are outlined in Table 1.
not undergo DCE MRI, resulting in 14 eligible patients          A total of 18 tumors in 14 patients were evaluated. Mean
with 18 meningiomas. In all patients, a histopathological       patient age was 64 years (range 49–86 years), and 50%
and molecular diagnosis was confirmed by experienced,           of patients (7/14) were female. The average tumor volume
board-certified neuropathologists.                              was 8.07 cm3 (range 0.21–27.89 cm3).
    Demographic and clinical characteristics were ob-               When stratifying by Simpson grade (I, II, and III vs
tained from clinical chart review, including tumor location     IV and V), there was a trend toward higher median kep,
(skull base vs other location), Simpson grade, WHO grade,       vp, and Ktrans in the higher Simpson grade group; however,
Ki-67 labeling index, radiation therapy type and dose, and      this did not reach statistical significance (Table 2). When
time to progression (TTP). The biologically effective dose      stratifying by location, there was a trend toward higher
(BED) of radiation was calculated using an online calcula-      median wash-in rate in skull base tumors. When strati-
tor (https://www.mdcalc.com/radiation-biologically-effec-       fying by SRS dosing into fractionated versus hypofrac-
tive-dose-bed-calculator) (Table 1).18                          tionated tumors (with the latter group including tumors
                                                                treated with other types of radiation therapy), differences
Imaging                                                         in median kep, Ktrans, ve, vp, and wash-in rate values did not
    All patients underwent MRI of the brain on 1.5- or          reach statistical significance, although there was a trend
3-Tesla clinical scanners (Skyra, Aera, Biograph mMR,           for higher vp in the hypofractionated group compared with
Siemens Healthcare; Discovery 750w, Signa HDxt, GE              the fractionated group (0.03 vs 0.09, p = 0.35; Table 2).
Healthcare), which included axial T1-weighted (TR/TE            When stratifying into 3 subgroups, with non-SRS radio-
550–700 µsec/7–10 µsec, slice thickness 3–5 mm) or 3D           therapy (such as brachytherapy and proton-beam radiation
T1-weighted SPACE (TR/TE 600–700 µsec/11–19 µsec,               therapy), the p value for vp decreased; however, it did not
120° flip, slice thickness 1 mm), axial T2-weighted (TR/        reach statistical significance (p = 0.06) (Table 3).
TE 3200–4000 µsec/93–98 µsec, slice thickness 5 mm),                The median Ki-67 in the cohort was 15%. When strati-
and axial T2-weighted FLAIR or 3D T2-weighted FLAIR             fying by median Ki-67, patients with Ki-67 greater than
(TR/TE 6300–8500 µsec/394–446 µsec, 120° flip angle,            15% had lower median vp (0.02 vs 0.10, p = 0.002), and a
slice thickness 1 mm). T1-weighted DCE MRI was per-             lower median wash-in rate (1.27 vs 4.08 sec-1, p = 0.04)
formed and available for analysis in all of the cases (TR       than patients with Ki-67 of 15% or below. The median Ki-
4 µsec, TE 1–2 µsec, flip angle 13°, slice thickness 3 mm,      67 was 15% for this cohort. Logistic regression analysis
44 slices to cover the entire lesion volume, 24 phases with     demonstrated a statistically significant, moderate posi-
4 phases before and 20 phases after intravenous bolus ad-       tive correlation between ve and TTP (r = 0.49, p < 0.05).
ministration of 0.1 mL/kg gadopentetate).                       There was a moderate positive correlation between Ktrans
                                                                and TTP, which approached, but did not reach, statistical
DCE Perfusion Analysis                                          significance (r = 0.48, p = 0.05; Fig. 3). Furthermore, the
  Olea Medical 3.0 software was utilized for DCE MRI            regression analysis demonstrated significant correlation

2       Neurosurg Focus Volume 46 • June 2019
TABLE 1. Patient demographics, clinical characteristics, and DCE perfusion metrics
Age (yrs), Simpson Radiation Dose or Ki-67 (MIB-1) WHO Time to
Sex Location Grade Type (BED)* Labeling Index Grade Recurrence (mos) kep Ktrans ve vp Wash-In Rate (sec−1) Tumor Vol (cm3)
52, F Rt lateral sphenoid III 24 Gy, 3 fx (75) 10–20% III 15 0.38 0.24 0.64 0.09 13.74 0.63
wing
77, F Rt parietal IV 60 Gy, 30 fx (92) 20% III 16 0.96 0.33 0.34 0.02 1.65 0.41
49, M Lt nasal cavity III PBRT >30% III 16 0.95 0.29 0.33 0.10 4.78 7.26
49, M Lt ASB/max sinus III PBRT >30% III 9 1.09 0.21 0.23 0 20.07 27.89
63, M ASB V 52.2 Gy, 29 fx (80) 8.52% I 9 0.5 0.26 0 0.23 2.71 9.84
57, M Rt frontal I Brachytherapy 30–40% III 11 0.25 0.04 0.15 0.03 0.83 3.08
57, M Rt temporal I Brachytherapy 30–40% III 11 0.26 0.06 0.22 0.05 0 15.78
62, F Rt frontal I 54 Gy, 30 fx (83) 10% II 20 0.7 0.23 0.30 0.10 5.27 0.21
74, M ASB IV 60 Gy, 30 fx (92) >50% III 11 0.55 0.07 0.10 0.01 0.28 2.11
60, M Lt frontal I 54 Gy, 30 fx (90) 8–10% II 1 0.30 0.10 0.29 0.03 1.63 0.64
54, F Rt FM V 25 Gy, 5 fx (58) 3% I 27 0.84 0.29 0.25 0.07 2.16 0.77
54, F Rt CPA V 25 Gy, 5 fx (58) 2–3% I 27 1.23 0.49 0.37 0.23 6.63 2.00
86, M ASB III 60 Gy, 30 fx (92) 20% II 12 1.32 1.14 0.68 0.02 2.12 19.64
79, F Lt frontal I 54 Gy, 30 fx (83) 17% II None 0.24 0.02 0.11 0.02 0.89 5.03
86, M ASB IV 27 Gy, 3 fx (92)Chidambaram et al.
FIG. 2. Representative posttreatment DCE MR images in a 49-year-old
FIG. 1. Representative posttreatment DCE MR images in a 62-year-old man with multiply recurrent WHO grade III meningioma centered in the
woman with recurrent WHO grade II meningioma of the right sphenoid left maxillary sinus with multiple prior resections and multiple courses of
wing with prior craniotomy and fractionated radiation therapy. Axial T1- radiation therapy. Axial T1-weighted postcontrast image (A) and overlaid
weighted postcontrast image (A) and overlaid semiautomatic volume of semiautomatic volume of interest (B), Ktrans map (C), and vp map (D).
interest (B), Ktrans map (C), and vp map (D).
function of the tumor vasculature differ in these circum-
irrespective of WHO grade (Fig. 3). The remaining DCE stances.4,11,13,15 In mixed cohorts of intracranial tumors that
parameters did not demonstrate statistically significant include meningiomas, gliomas, and metastases, it has been
correlation with TTP. shown that differences in vessel permeability, as captured
by perfusion MRI, can help differentiate between menin-
giomas and intraaxial tumors.2,10,11,13
Discussion Several studies have previously investigated the poten-
In this study, we sought to characterize DCE MRI pa- tial role of DCE MRI in the characterization of meningio-
rameters in meningiomas treated with resection and ad- mas. Thus, Ktrans was found to have utility in distinguish-
juvant radiation therapy. We analyzed clinical and treat- ing atypical meningiomas from typical meningiomas on
ment-related information including Simpson grade, tumor preoperative DCE MRI.19 DCE MRI was also proposed as
location, pathological findings, including Ki-67 index, ra- a biomarker in the diagnosis of rare meningioma variants
diotherapy dosing data, and time to progression of disease. such as lipomatous variant of metaplastic meningioma and
Our findings highlight a potential role for DCE MRI in the a microcystic meningioma.6 Dynamic susceptibility con-
preoperative characterization and stratification of menin- trastMRI-derived relative cerebral blood volume (rCBV)
giomas and lay the foundation for a prospective study in- has been proposed as a biomarker for meningiomas, given
corporating DCE as a biomarker in meningioma diagnosis data suggesting that rCBV correlated with vascular endo-
and treatment planning. Importantly, time to progression thelial growth factor (VEGF) expression and tumor grade.5
after radiation therapy demonstrated a moderate positive A recent study suggested that an enhancing cystic lesion
correlation, which was statistically significant in the case with a normalized rCBV greater than 10.3 cm3 or a Ktrans
of ve and approached statistical significance in the case of greater than 0.88 min-1 should prompt radiologists and
Ktrans, indicating that these parameters may be helpful in surgeons to consider the diagnosis of the rare microcystic
predicting progression in meningiomas on posttreatment meningioma rather than traditional WHO grade I menin-
surveillance imaging. gioma or high-grade glioma in surgical treatment planning.
Previous work suggested that DCE MRI may facilitate However, not all data confirm the predictive utility of DCE
noninvasive preoperative predictions of intracranial tumor MRI, which remains an area of active research.9
characteristics and may have a potential to allow prog- We present here the results from a unique cohort of pa-
nostic decisions and to guide therapies.1,8 DCE MRI has tients with meningiomas who underwent resection, adju-
also been studied for its potential utility in differentiating vant radiotherapy, and DCE MRI and validate the potential
tumors by type and grade, as the spatial properties and utility of DCE MRI in this clinical context. Limitations of
4 Neurosurg Focus Volume 46 • June 2019Chidambaram et al.
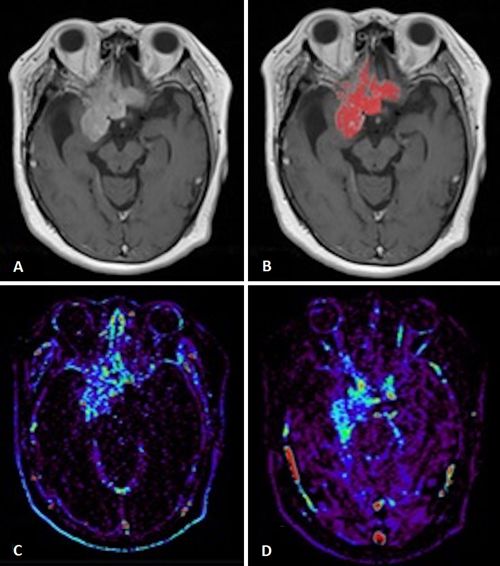
FIG. 3. DCE parameters in meningiomas treated with resection and adjuvant radiosurgery: correlation with TTP. Left: Logistic
regression analysis of Ktrans and TTP. B: Logistic regression of ve and TTP. Each data point represents a tumor; color indicates
WHO grade.
this study include the small sample size and retrospective rameters in meningiomas treated with resection and adju-
methodology. Furthermore, the median Ki-67 of this co- vant radiation therapy. This is the first study of a cohort of
hort was 15%, indicating an inherent bias toward more ag- patients with meningiomas who have undergone resection
gressive meningiomas. This also implies that DCE MRI and adjuvant radiotherapy that aims to validate the poten-
was done on more aggressive tumors, likely as a problem- tial usefulness of DCE MRI in this clinical context. Impor-
solving tool in treatment planning. Future directions in- tantly, despite the small sample size, time to progression
clude validating our findings in a prospective cohort in- after radiation therapy demonstrated a moderate positive,
cluding pre- and posttreatment surveillance DCE MRI, statistically significant correlation with ve and a moderate
allowing for the continued development of DCE MRI as a positive correlation with Ktrans that approached statistical
biomarker of diagnosis and treatment response assessment significance, indicating that these parameters may be help-
of meningioma, thereby improving patient outcomes. ful in predicting progression in meningiomas on posttreat-
ment surveillance imaging. Furthermore, when stratified
by Ki-67, tumors demonstrated statistically significant
Conclusions differences in vp and wash-in rate, which prompts the po-
In this study, we aimed to characterize DCE MRI pa- tential utility of vp and wash-in rate as diagnostic markers
TABLE 2. DCE MRI parameters stratified by Simpson grade, tumor location, Ki-67, and radiotherapy dosing strategy
DCE MRI Parameter*
No. of Meningiomas kep K trans
ve vp Wash-In Rate (sec−1)
Simpson grade
I, II, or III 9 0.38 0.21 0.29 0.03 2.12
IV or V 9 0.96 0.29 0.31 0.1 2.71
p value 0.09 0.08 0.81 0.07 0.55
Tumor location
Skull base 9 0.96 0.26 0.25 0.09 5.93
Not skull base 9 0.7 0.23 0.3 0.05 1.65
p value 0.13 0.44 0.78 0.75 0.06
Ki-67
≤15% 10 0.84 0.28 0.31 0.1 4.08
>15% 8 0.75 0.14 0.23 0.02 1.27
p value 0.54 0.2 0.6 0.002 0.04
SRS fractionation
Fractionated 9 0.7 0.26 0.3 0.03 2.12
Hypofractionated/other 9 0.84 0.24 0.25 0.09 4.78
p value 0.98 0.86 0.81 0.35 0.26
The Mann-Whitney U-test was performed to determine statistical significance.
* Parameter values are medians.
Neurosurg Focus Volume 46 • June 2019 5Chidambaram et al.
TABLE 3. DCE parameters stratified by radiotherapy dosing 11. Lüdemann L, Grieger W, Wurm R, Wust P, Zimmer C: Quan-
strategy titative measurement of leakage volume and permeability in
gliomas, meningiomas and brain metastases with dynamic
Dosing Strategy contrast-enhanced MRI. Magn Reson Imaging 23:833–841,
DCE MRI Fractionated Hypofractionated Other p 2005
Parameter (n = 9) (n = 4) (n = 5) Value 12. Lui YW, Malhotra A, Farinhas JM, Dasari SB, Weidenheim
K, Freeman K, et al: Dynamic perfusion MRI characteristics
kep 0.70 0.84 0.99 0.71 of dural metastases and meningiomas: a pilot study charac-
Ktrans 0.26 0.21 0.31 0.70 terizing the first-pass wash-in phase beyond relative cerebral
blood volume. AJR Am J Roentgenol 196:886–890, 2011
vp 0.03 0.05 0.17 0.06 13. Nguyen TB, Cron GO, Bezzina K, Perdrizet K, Torres CH,
ve 0.30 0.23 0.40 0.86 Chakraborty S, et al: Correlation of tumor immunohistochem-
Wash-in rate (sec−1) 2.12 2.45 10.19 0.08 istry with dynamic contrast-enhanced and DSC-MRI param-
eters in patients with gliomas. AJNR Am J Neuroradiol 37:
ANOVA was performed to determine statistical significance. 2217–2223, 2016
14. Ostrom QT, Gittleman H, Liao P, Vecchione-Koval T, Wo-
linsky Y, Kruchko C, et al: CBTRUS Statistical Report:
Primary brain and other central nervous system tumors di-
in preoperative treatment planning. Our findings indicate a agnosed in the United States in 2010-2014. Neuro Oncol 19
potential role for DCE MRI in the preoperative character- (suppl_5):v1–v88, 2017
ization and stratification of meningiomas and lay the foun- 15. Roberts HC, Roberts TP, Brasch RC, Dillon WP: Quantita-
dation for a prospective study incorporating DCE as a bio- tive measurement of microvascular permeability in human
marker in meningioma diagnosis and treatment planning. brain tumors achieved using dynamic contrast-enhanced
MR imaging: correlation with histologic grade. AJNR Am J
Neuroradiol 21:891–899, 2000
References 16. Rogers L, Barani I, Chamberlain M, Kaley TJ, McDermott
1. Bazyar S, Ramalho J, Eldeniz C, An H, Lee YZ: Comparison M, Raizer J, et al: Meningiomas: knowledge base, treatment
of cerebral blood volume and plasma volume in untreated outcomes, and uncertainties. A RANO review. J Neurosurg
intracranial tumors. PLoS One 11:e0161807, 2016 122:4–23, 2015
2. Cha S, Yang L, Johnson G, Lai A, Chen MH, Tihan T, et al: 17. Starr CJ, Cha S: Meningioma mimics: five key imaging fea-
Comparison of microvascular permeability measurements, tures to differentiate them from meningiomas. Clin Radiol
K(trans), determined with conventional steady-state T1- 72:722–728, 2017
weighted and first-pass T2*-weighted MR imaging methods 18. Vernimmen FJ, Slabbert JP: Assessment of the alpha/
in gliomas and meningiomas. AJNR Am J Neuroradiol beta ratios for arteriovenous malformations, meningiomas,
27:409–417, 2006 acoustic neuromas, and the optic chiasma. Int J Radiat Biol
3. Cuenod CA, Balvay D: Perfusion and vascular permeability: 86:486–498, 2010
basic concepts and measurement in DCE-CT and DCE-MRI. 19. Yang S, Law M, Zagzag D, Wu HH, Cha S, Golfinos JG,
Diagn Interv Imaging 94:1187–1204, 2013 et al: Dynamic contrast-enhanced perfusion MR imaging
4. Fujii K, Fujita N, Hirabuki N, Hashimoto T, Miura T, Kozuka measurements of endothelial permeability: differentiation
T: Neuromas and meningiomas: evaluation of early enhance- between atypical and typical meningiomas. AJNR Am J
ment with dynamic MR imaging. AJNR Am J Neuroradiol Neuroradiol 24:1554–1559, 2003
13:1215–1220, 1992 20. Zhang H, Rödiger LA, Shen T, Miao J, Oudkerk M: Perfu-
5. Ginat DT, Mangla R, Yeaney G, Schaefer PW, Wang H: sion MR imaging for differentiation of benign and malignant
Correlation between dynamic contrast-enhanced perfusion meningiomas. Neuroradiology 50:525–530, 2008
MRI relative cerebral blood volume and vascular endothe-
lial growth factor expression in meningiomas. Acad Radiol
19:986–990, 2012 Disclosures
6. Grand S, Pasquier BM, Hoffmann DM, Krainik A, Ashraf A, The authors report no conflict of interest concerning the materi-
Tropres IM, et al: Perfusion MR imaging and 1H spectrosco- als or methods used in this study or the findings specified in this
py: their role in the diagnosis of microcystic and lipomatous paper.
meningiomas. J Neuroradiol 37:185–188, 2010
7. Ivanidze J, Lum M, Pisapia D, Magge R, Ramakrishna R, Author Contributions
Kovanlikaya I, et al: MRI features associated with TERT Conception and design: Ivanidze, Chidambaram, Roytman.
promoter mutation status in glioblastoma. J Neuroimaging Acquisition of data: Ivanidze, Chidambaram, Pannullo, Pisapia,
[epub ahead of print], 2019 Liechty, Magge, Ramakrishna, Stieg, Schwartz. Analysis and
8. Jensen RL, Mumert ML, Gillespie DL, Kinney AY, Schabel interpretation of data: Ivanidze, Chidambaram, Pisapia, Liechty.
MC, Salzman KL: Preoperative dynamic contrast-enhanced Drafting the article: Ivanidze, Chidambaram, Pannullo, Pisapia,
MRI correlates with molecular markers of hypoxia and vas- Liechty, Magge, Ramakrishna. Critically revising the article:
cularity in specific areas of intratumoral microenvironment Ivanidze, Chidambaram, Pannullo, Roytman, Pisapia, Liechty,
and is predictive of patient outcome. Neuro Oncol 16:280– Magge, Ramakrishna. Reviewed submitted version of manuscript:
291, 2014 all authors. Statistical analysis: Ivanidze, Chidambaram, Liechty.
9. Keil VC, Pintea B, Gielen GH, Hittatiya K, Datsi A, Simon
Administrative/technical/material support: Pisapia, Liechty. Study
M, et al: Meningioma assessment: kinetic parameters in dy-
supervision: Ivanidze, Chidambaram, Pannullo.
namic contrast-enhanced MRI appear independent from mi-
crovascular anatomy and VEGF expression. J Neuroradiol
45:242–248, 2018 Correspondence
10. Lehmann P, Vallée JN, Saliou G, Monet P, Bruniau A, Fich- Jana Ivanidze: Weill Cornell Medicine, New York, NY. jai9018@
ten A, et al: Dynamic contrast-enhanced T2*-weighted MR med.cornell.edu.
imaging: a peritumoral brain oedema study. J Neuroradiol
36:88–92, 2009
6 Neurosurg Focus Volume 46 • June 2019You can also read