Eco-Geography of Feral Cotton: A Missing Piece in the Puzzle of Gene Flow Dynamics Among Members of Gossypium hirsutum Primary Gene Pool - Frontiers
←
→
Page content transcription
If your browser does not render page correctly, please read the page content below
ORIGINAL RESEARCH
                                                                                                                                            published: 28 May 2021
                                                                                                                                    doi: 10.3389/fevo.2021.653271

                                            Eco-Geography of Feral Cotton: A
                                            Missing Piece in the Puzzle of Gene
                                            Flow Dynamics Among Members of
                                            Gossypium hirsutum Primary Gene
                                            Pool
                                            Valeria Alavez 1,2* , Ángela P. Cuervo-Robayo 3 , Enrique Martínez-Meyer 4 and
                                            Ana Wegier 2*
                                            1
                                             Posgrado en Ciencias Biológicas, Universidad Nacional Autónoma de México (UNAM), Mexico City, Mexico, 2 Laboratorio
                                            de Genética de la Conservación, Jardín Botánico, Instituto de Biología, Universidad Nacional Autónoma de México (UNAM),
                                            Mexico City, Mexico, 3 Comisión Nacional Para el Conocimiento y Uso de la Biodiversidad (CONABIO), Insurgentes
                           Edited by:       Sur-Periférico, Tlalpan Mexico City, Mexico, 4 Departamento de Zoología, Instituto de Biología, Universidad Nacional
                Raymond L. Tremblay,        Autónoma de México (UNAM), Mexico City, Mexico
University of Puerto Rico, Puerto Rico
                        Reviewed by:
          Antonio Gonzalez-Rodriguez,       Mexico is the center of origin and genetic diversity of upland cotton (Gossypium
      Universidad Nacional Autónoma         hirsutum L.), the most important source of natural fiber in the world. Currently, wild
                    de México, Mexico
                                            and domesticated populations (including genetically modified [GM] varieties) occur in
                   James Frelichowski,
             United States Department       this country and gene flow among them has shaped the species’ genetic diversity and
  of Agriculture (USDA), United States      structure, setting a complex and challenging scenario for its conservation. Moreover,
                   *Correspondence:         recent gene flow from GM cultivars to wild Mexican cotton populations has been
                         Valeria Alavez
           v.alavez@ciencias.unam.mx        reported since 2011. In situ conservation of G. hirsutum requires knowledge about the
                           Ana Wegier       extent of its geographic distribution, both wild and domesticated, as well as the possible
                  awegier@ib.unam.mx
                                            routes and mechanisms that contribute to gene flow between the members of the
                   Specialty section:       species wild-to-domesticated continuum (i.e., the primary gene pool). However, little is
         This article was submitted to      known about the distribution of feral populations that could facilitate gene flow by acting
Evolutionary and Population Genetics,
                a section of the journal
                                            as bridges. In this study, we analyzed the potential distribution of feral cotton based on
    Frontiers in Ecology and Evolution      an ecological niche modeling approach and discussed its implications in the light of the
         Received: 14 January 2021          distribution of wild and domesticated cotton. Then, we examined the processes that
           Accepted: 28 April 2021          could be leading to the escape of seeds from the cultivated fields. Our results indicate
           Published: 28 May 2021
                                            that the climatic suitability of feral plants in the environmental and geographic space
                              Citation:
        Alavez V, Cuervo-Robayo ÁP,         is broad and overlaps with areas of wild cotton habitat and crop fields, suggesting a
     Martínez-Meyer E and Wegier A          region that could bridge cultivated cotton and its wild relatives by allowing gene flow
      (2021) Eco-Geography of Feral
Cotton: A Missing Piece in the Puzzle
                                            between them. This study provides information for management efforts focused on the
     of Gene Flow Dynamics Among            conservation of wild populations, native landraces, and non-GM domesticated cotton
   Members of Gossypium hirsutum            at its center of origin and genetic diversity.
                  Primary Gene Pool.
          Front. Ecol. Evol. 9:653271.      Keywords: upland cotton (Gossypium hirsutum L.), ecological niche modeling ENM, conservation, gene flow,
     doi: 10.3389/fevo.2021.653271          wild-to-domesticated complex

Frontiers in Ecology and Evolution | www.frontiersin.org                         1                                             May 2021 | Volume 9 | Article 653271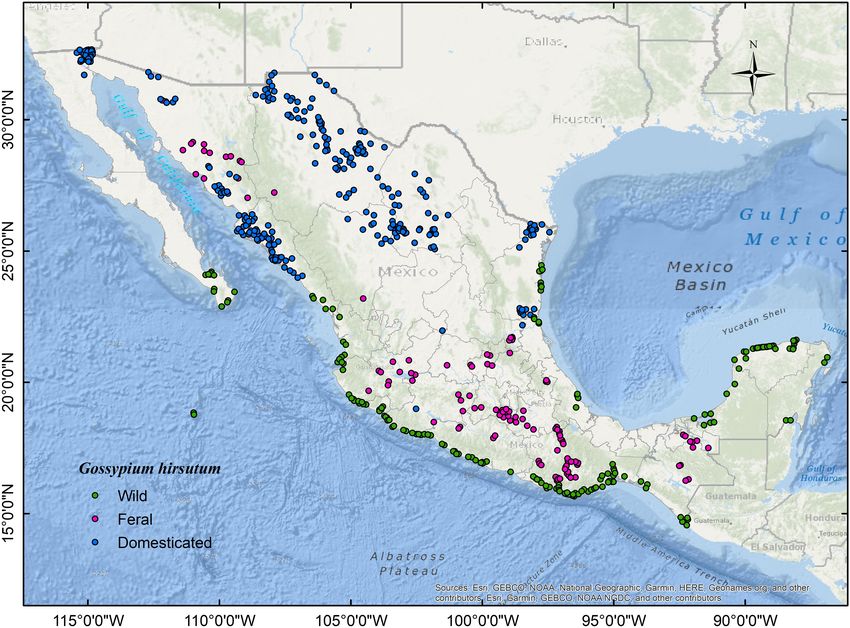
Alavez et al.                                                                                                  Feral Cotton Eco-Geography in Mexico

INTRODUCTION                                                               Peninsula and the Caribbean (Coppens d’Eeckenbrugge and
                                                                           Lacape, 2014) to accounting for a broader distribution at coastal
Crop ferality can play an important role in gene flow between              habitats along Pacific islands, the Caribbean, Mexican Pacific
crops and their wild relatives and introgression from artificially         coasts, the Gulf of Mexico, and Baja California Sur (Fryxell, 1979;
selected sources can have significant evolutionary consequences            Wegier et al., 2011).
(Ashiq Rabbani et al., 1998; Berville et al., 2005; Snow and                   As a domesticate, upland cotton has a long history of human
Campbell, 2005; Devaux et al., 2007; Gering et al., 2019).                 management and utilization. In Mexico, evidence indicates that
Furthermore, with the growing adoption of genetically modified             cotton has been cultivated since pre-Hispanic times where it
(GM) crops worldwide, transgenic flow turned into a widely                 was probably grown in many of the coastal valleys along the
discussed topic and ferality an issue of concern amongst biosafety         Gulf coast in Veracruz, on the Pacific coast of Oaxaca, the coast
specialists. Feral plants are commonly known as cultivated taxa            of Sinaloa, and throughout the lowland Maya region at the
whose domestication syndrome has been partially or totally                 Yucatán Peninsula (Mathiowetz, 2020). Moreover, growing areas
reverted (a process also known as atavism or de-domestication)             extended inland toward regions that provided suitable warm
(Gressel, 2005; Gering et al., 2019). However, recent research             temperatures and sufficient water through rainfall or irrigation
indicates that feralization is not simply a “reversal” from                (e.g., along river valleys), such as the states of Morelos and
domestication, but rather a complex phenomenon that can                    Oaxaca (Berdan, 1987; Charlton et al., 1991; Hironymous, 2007).
involve several processes: adaptation to new habitats, novel               Later, during the colonial period, cotton cultivation followed
selection pressures, admixture with wild relatives and other               almost the same pattern (Hironymous, 2007); however, between
domesticated varieties, and even when feralization restores                the nineteenth and twentieth centuries, with the modernization
ancestral phenotypes, novel genetic mechanisms (Gering et al.,             of the textile industry, the production grew significantly and
2019). Thus, as diverse and complex evolutionary histories                 new cotton-growing regions emerged (Cerutti and Almaraz,
shape ferality, three fundamental characteristics common to                2013; Rocha-Munive et al., 2018), namely: Comarca Lagunera
feral populations can be summarized: (1) they are composed                 (Coahuila and Durango); Colorado River Delta and Mexicali
of free-living organisms that are primarily descended from                 valley (Baja California); the Ascensión area, Juárez valley, and the
semi-domesticated ancestors that escaped cultivation; (2) they             Meoqui region (Chihuahua); San Luis Río Colorado, Caborca,
are able to reproduce successfully without intentional human               Hermosillo coast, and the valleys of Guaymas, Yaqui, and
intervention; and (3) they can establish and perpetuate                    Mayo (Sonora); and Matamoros (Tamaulipas). Cotton cultivation
themselves in natural or semi-natural habitats, not necessarily            peaked from 1935 to 1955 (e.g., from a quarter of a million
returning to truly “wild” habitats, but rather frequently occurring        bales collected in 1940, the harvest increased to more than
within disturbed settings (White et al., 2006; Bagavathiannan              two million in 1955) (Cerutti and Almaraz, 2013), but the
and van Acker, 2008; Gering et al., 2019). Given the above,                large areas of monoculture enabled the emergence and rapid
feral populations are part of wild-to-domesticated systems that            dispersal of pests, leading to a drastic decline due to the high
could experience gene flow among their members, especially in              costs associated to extensive applications of insecticides and the
areas where they coexist. Gene flow represents an important                evolution of pest resistance. Consequently, since 1996, GM cotton
mechanism for the spread and establishment of domesticated                 expressing tolerance to herbicides and lepidopteran resistance
genetic material (including transgenes) into the wild, which has           has been sowed in northern Mexico in the same regions that were
several conservation implications for crop wild relatives, as is the       established during the nineteenth and twentieth centuries. Today,
case of upland cotton (Gossypium hirsutum L.) in Mexico.                   practically all the cultivated area depends on imported GM seed
   At its indigenous range (i.e., semi-arid tropics and subtropics         (Jiménez Martínez and Ayala Angulo, 2020).
of the Caribbean, northern South America, and Mesoamerica)                     Although cotton utilization in Mesoamerica can be traced
(Brubaker and Wendel, 1994), upland cotton exists as a complex             back before the pre-Classic period (Smith and Stephens, 1971),
of wild-to-domesticated forms that belong to the primary gene              G. hirsutum has been subjected to incomplete domestication;
pool of the species (Brubaker and Wendel, 1994; Andersson and              therefore, individuals can reproduce and persist without human
de Vicente, 2010). Presently, in Mexico—its center of origin,              intervention. The species’ semi-domestication coupled with its
diversity, and domestication (Ulloa et al., 2005; Burgeff et al.,          capacity for long-distance dispersal are the main factors that
2014; Mendoza et al., 2017)—cotton occurs as a continuum of                account for cotton ferality. As in the tribe Gossypieae, dispersal in
cultivated and highly improved varieties, genetically modified             G. hirsutum is virtually synonymous with seed dispersal (Fryxell,
varieties, traditionally managed landraces, feral, and wild                1979). Several mechanisms are involved in this capacity and
populations. Predominantly, wild cotton populations are found              are tightly associated with the species’ evolutionary history. For
in coastal habitats—as part of littoral vegetation or derived              instance, the origin of tetraploid cottons –the phylogenetic group
from it (Fryxell, 1979)—in scattered patches that conform                  to which G. hirsutum belongs (i.e., G. barbadense, G. tomentosum,
to metapopulation dynamics (Hanski, 1998; Freckleton and                   G. darwinii, G. mustelinum, and G. hirsutum)- resulted from
Watkinson, 2002; Wegier et al., 2011). Particularly, the natural           the union of genomes A and D of the eight diploid genomes
distribution of the latter has been widely discussed by several            described for the genus (i.e., genomes A to G, and K). Although
authors as a result of a debate regarding the “truly wild” status.         sharing an ancestral African origin, Genomes A and D diverged
Views on this subject range from describing a very restricted              separately for millions of years –the former in Africa and the
distribution of few remaining wild populations at the Yucatán              latter in America– until a second transoceanic migration led to

Frontiers in Ecology and Evolution | www.frontiersin.org               2                                        May 2021 | Volume 9 | Article 653271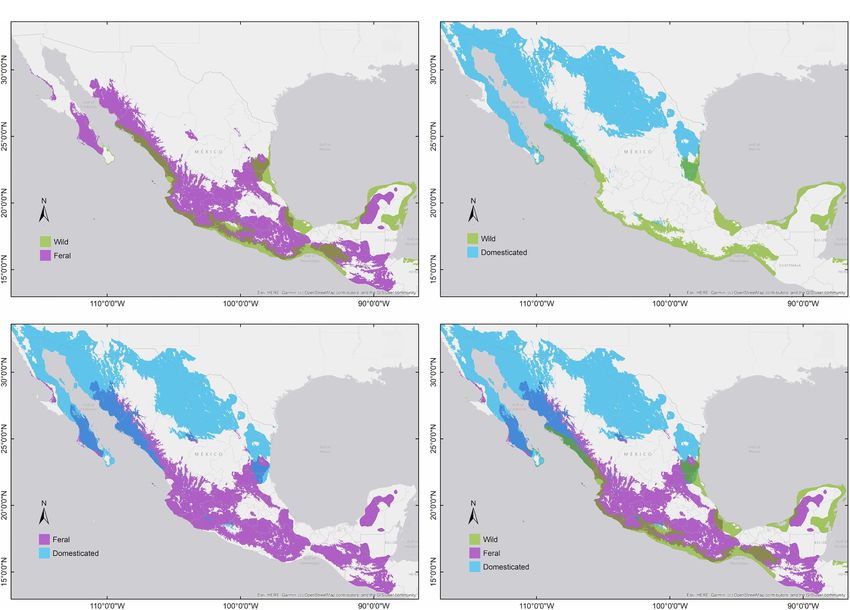
Alavez et al.                                                                                                   Feral Cotton Eco-Geography in Mexico

their allopolyploidization in America. The latter event allowed             is one of the main concerns and should always be evaluated
for the propagation in littoral habitats that differ from the inland        on a case-by-case basis. Key aspects in this regard are the
arid environments where diploid cottons occur (Fryxell, 1979).              geographical distribution of wild and highly improved crops,
Moreover, its dense hairy seeds –a trademark of the Gossypieae              their potential to escape cultivation and establish elsewhere,
and the target trait to cotton domestication – have a central role in       and the dispersal mechanisms that would allow them to reach
natural mechanisms of seed dispersal by: (1) enabling floatation            these areas. In this study, we aim to describe the potential
for water dispersal; (2) facilitating wind dispersal; and (3) being         distribution of feral cotton through an ecological niche modeling
an attractive material to nest-building birds (Fryxell, 1979;               approach and discuss its relation to the distribution of wild
Arteaga Rojas, 2021). Additionally, activities related to cotton            and domesticated cotton. To that end, we have reviewed and
production and utilization involve transporting domesticated                gathered an extensive dataset of occurrences of the three
seeds through long distances, from the cultivation fields to                groups, modeled their ecological niches, and assessed their
temporary storage facilities, cotton gins, distribution centers, and        differences and overlap to evaluate how feral cotton may be
final locations (Wegier, 2013). This dynamic has taken place                accounting for gene flow between crops and wild relatives. We
since pre-Columbian times when communities imported the raw                 hope that our findings can encourage a necessary discussion
materials to spun, wave, and prepare textiles that were used                on the management and conservation of G. hirsutum in
locally or further moved to be offered as tribute (Berdan, 1987).           the complex and dynamic scenario in which its wild-to-
   With such dispersal capabilities in mind, gene flow among                domesticated forms coexist.
G. hirsutum primary gene pool members is feasible, even between
distant populations. Wegier et al. (2011) described patterns of
historical long-distance gene flow among wild metapopulations               MATERIALS AND METHODS
in Mexico and demonstrated that recent gene flow, followed by
introgressive hybridization, occurred between wild populations              Occurrence Data
and commercial cotton cultivars, through the detection of                   We collated occurrence records for G. hirsutum wild, feral,
transgene expression at the former. Considering that cotton                 and highly domesticated populations across their geographic
volunteers and feral populations usually reach reproductive                 range in Mexico. We examined, gathered, and cleaned the data
maturity, produce fruits with seeds, and are very common in                 from the following sources: (1) Wild records, through direct
areas where cottonseed is supplied as livestock feed (Andersson             observation during several surveys across the Mexican coastal
and de Vicente, 2010), they could also contribute actively to gene          dunes performed annually over the last 17 years (Wegier, 2007).
flow within the primary gene pool. Cotton ferality can be limited           Populations were considered wild if they were found in the
by unintentional factors that hinder plant germination, growth,             expected littoral habitat and the growth form conformed to a
and reproduction, such as the relative drought of non-managed               perennial shrub or tree (Fryxell, 1979; Wegier et al., 2011). In
habitats, roadside weed removal, or cattle grazing. However, if             addition, we carefully revised plant collections (i.e., XAL, MEXU)
suitable conditions prevail, feral cotton populations can persist           to retrieve inaccessible but relevant localities (e.g., Revillagigedo
for decades, as has happened in several tropical regions such               or Tamaulipas) considering geographic and taxonomic accuracy.
as northern Australia, Vietnam, southern United States, Hawaii,             (2) We registered feral cotton occurrences from field observations
Brazil, and Mexico (Hilbeck et al., 2004; Hawkins et al., 2005;             and the National Biodiversity Information System (SNIB, for
Andersson and de Vicente, 2010).                                            its acronym in Spanish) (CONABIO, 2020). Records were
   Given that Mexico is the center of origin and genetic                    considered feral if they occurred outside cultivation, without
diversity of G. hirsutum and several other important crops to               apparent human management (i.e., agricultural land use), and
humankind, specific regulatory instruments safeguard its genetic            away from the habitat described for wild cotton (Gering et al.,
and morphological diversity (i.e., the total gene pool of the               2019). Additionally, to obtain records of established populations,
crop, including wild relatives, landraces, or varieties), as well           we only considered localities reported by two or more authors
as the areas in which they occur, such as the Law of Biosafety              and/or in different years. (3) In Mexico, practically all the
of Genetically Modified Organisms—LBOGM (Diario Oficial de                  area cultivated with cotton is GM. Therefore, we inferred
la Federación [DOF], 2005), LBOGM regulation (DOF, 2008),                   occurrences for commercial cultivars (i.e., highly domesticated
and the Cartagena Protocol on Biosafety to the Convention                   varieties that hereafter we will refer to as “domesticated”) by
on Biological Diversity (Secretariat of the Convention on                   calculating the centroids of the polygons requested in the
Biological Diversity, 2000). Moreover, the IUCN Red List of                 GM-cotton release applications submitted from 1995 to 2016
Threatened Species and the Mexican Official Standard NOM-                   (Burgeff et al., 2014; SIOVM, 2020). After cleaning, we thinned
059-SEMARNAT-2010 (a normative instrument that identifies                   all datasets following a distance-based approach (excluded
species or populations at risk) list G. hirsutum as a vulnerable            duplicated records within a grid of 5 × 5 Km) to avoid
species or subjected to special protection, respectively (DOF,              spatial correlation with the NTBOX package version 0.4.6.1
2019; Wegier et al., 2019). Considering the legal background                (Osorio-Olvera et al., 2020) in R version 3.5.0 (R Core Team,
described above, the release of GM cotton in Mexico must                    2017). Finally, for modeling and evaluation purposes, we split
be preceded by environmental risk assessments designed to                   thinned databases into two sets (i.e., training and testing)
identify potential adverse effects and estimate the level of risk           of nearly identical size following the checkerboard partition
associated with them. Gene flow to native cotton populations                method implemented in the package ENMeval version 0.3.0

Frontiers in Ecology and Evolution | www.frontiersin.org                3                                        May 2021 | Volume 9 | Article 653271
Alavez et al.                                                                                                                  Feral Cotton Eco-Geography in Mexico

  FIGURE 1 | Map of the study area showing occurrence data: wild cotton (n = 175; green), feral cotton (n = 120; magenta), and highly domesticated cultivars,
  hereafter referred to as “domesticated” (n = 278; blue).

(Muscarella et al., 2018). We show the localities used in this                        for further modeling (Wegier, 2013; Simoes et al., 2020). For
study in Figure 1 (wild: n = 175; feral: n = 120; domesticated:                       wild cotton, we used six variables: annual mean temperature
n = 278) and in an interactive map at http://rpubs.com/valav/                         (Bio1), mean diurnal range (Bio2), temperature seasonality
712873.                                                                               (Bio4), maximum temperature of the warmest month (Bio5),
                                                                                      temperature annual range (Bio7), and precipitation of the
Climatic Variables                                                                    driest quarter (Bio17). For feral cotton, five: isothermality
The environmental layers used in this study correspond                                (Bio3), temperature seasonality (Bio4), minimum temperature
to bioclimatic variables summarizing annual, seasonal, and                            of the coldest month (Bio6), precipitation of the driest month
extreme tendencies derived from monthly temperature and                               (Bio14), and precipitation seasonality (Bio15). And also
precipitation data for Mexico between 1910 and 2009 at 30”                            five for the domesticated group: annual mean temperature
resolution (∼1 km) (Table 1; Cuervo-Robayo et al., 2014).                             (Bio1), isothermality (Bio3), temperature seasonality (Bio4),
We excluded four variables (i.e., mean temperature of the                             annual precipitation (Bio12), and precipitation of the
most humid quarter, mean temperature of the least humid                               driest month (Bio14).
quarter, precipitation of the warmest quarter, and precipitation                         The calibration area, or the “M” element of the BAM diagram,
of the coldest quarter) due to artifacts resulting from the                           refers to areas that have been accessible to the species via
combination of temperature and precipitation data (Escobar                            dispersal over relevant time periods (Barve et al., 2011; Peterson
et al., 2014). To avoid model overfitting due to multicollinearity                    and Soberón, 2012). Given G. hirsutum long-distance dispersal
among variables, we selected a sub-set of uncorrelated and                            features, both historical and recent, we considered the geographic
biologically meaningful variables for each cotton group. For                          extent of Mexico as the calibration area. This approach allows
this, we first assessed variables’ contribution in exploratory                        to predict areas that wild, feral, and domesticated cottons could
runs of a Maxent model (Phillips et al., 2006; Supplementary                          potentially occupy within this range and allow comparisons
Table 1) by measuring the variable contribution percentage,                           among these groups.
permutation importance, and model gain through jackknife
tests for each cotton group. Then, we calculated pairwise                             Ecological Niche Modeling
Pearson’s correlation coefficients from the occurrences of                            We modeled the ecological niche of wild, feral, and domesticated
the three cotton groups. From these analyses, we excluded                             cotton using the Maxent algorithm version 3.3.3k (Phillips et al.,
highly correlated variables (| r | > 0.85) and retained                               2006). Maxent is a machine-learning algorithm that uses the
important variables with the greatest biological relevance                            maximum entropy principle to identify a target probability

Frontiers in Ecology and Evolution | www.frontiersin.org                          4                                              May 2021 | Volume 9 | Article 653271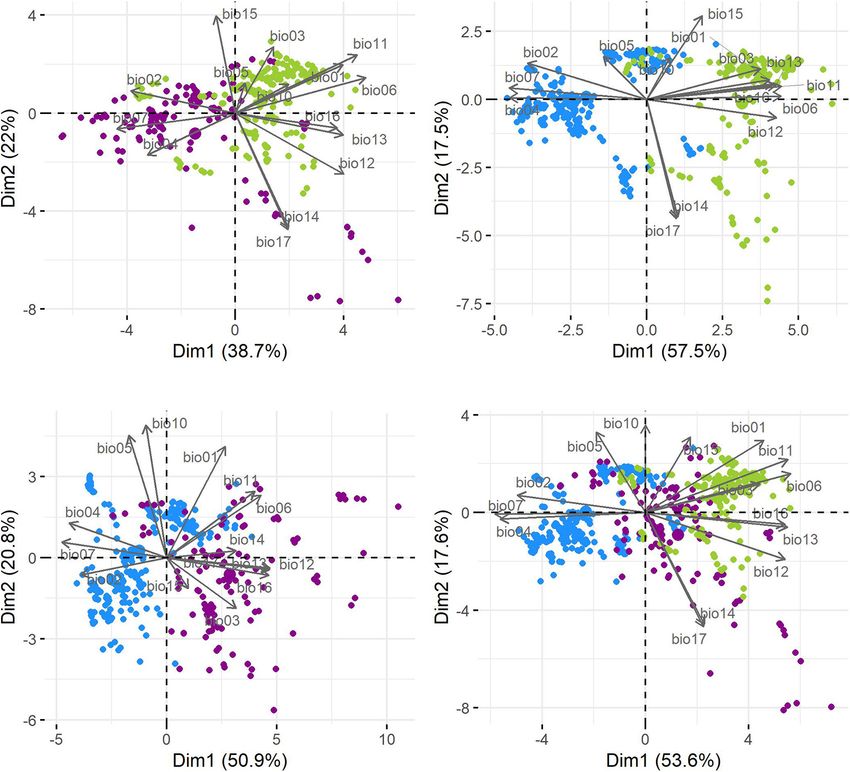
Alavez et al.                                                                                                                        Feral Cotton Eco-Geography in Mexico

TABLE 1 | Importance of variables to model construction.

Variable                            Wild                                                   Feral                                             Domesticated

                 PC      PI      JK with only      JK without        PC         PI        JK with only    JK without        PC         PI      JK with only      JK without

Bio1            54.73   66.55         1.51             2.01         7.73      14.44          0.18             1.20         10.40     17.99          0.14             1.05
Bio2            9.23    1.43          0.48             2.19           -         -              -                -            -         -              -                -
Bio3              -       -             -                  -        2.51       5.44          0.66             1.17         5.62      7.81           0.59             1.21
Bio4            10.18   2.75          0.81             2.19         46.59     16.79          0.59             1.21         33.42     37.63          0.43             1.17
Bio5            3.37    8.65          0.11             2.16           -         -              -                -            -         -              -                -
Bio6              -       -             -                  -        11.82     19.59          0.70             0.99           -         -              -                -
Bio7            10.00   0.93          1.11             3.20           -         -              -                -            -         -              -                -
Bio11             -       -             -                  -          -         -              -                -            -         -              -                -
Bio12             -       -             -                  -          -         -              -                -          7.09      13.71          0.65             1.23
Bio14             -       -             -                  -        0.76       5.76          0.18             1.21         43.46     22.85          0.59             1.23
Bio15             -       -             -                  -        30.59     37.97          0.63             1.13           -         -              -                -
Bio17           12.49   19.68         0.36             2.92           -         -              -                -            -         -              -                -
For each parameter, the two variables with the highest values are highlighted in boldface, except for the jackknife test when one variable is omitted (JK without) where the
lowest two values are shown. PC, Percent contribution; PI, permutation importance; JK with only, model gain with only one variable (jackknife test); JK without, model gain
with all variables except one (jackknife test). Variables: Bio1 = annual mean temperature; Bio2 = mean diurnal range (mean of monthly maximum temperature-minimum
temperature); Bio3 = isothermality [(Bio2/Bio7) *100]; Bio4 = temperature seasonality (standard deviation *100); Bio5 = maximum temperature of the warmest month;
Bio6 = minimum temperature of the coldest month; Bio7 = temperature annual range (Bio5-Bio6); Bio10 = mean temperature of the warmest quarter; Bio11 = mean
temperature of the coldest quarter; Bio12 = annual precipitation; Bio13 = precipitation of the wettest month; Bio14 = precipitation of the driest month; Bio15 = precipitation
seasonality (coefficient of variation); Bio16 = precipitation of the wettest quarter; Bio17 = precipitation of the driest quarter.

distribution subject to a set of constraints related to the                               overlap, similarity, and equivalency analyses using the package
environmental characteristics of occurrences and a sample of the                          “ecospat” (Broennimann et al., 2012; Di Cola et al., 2017) in R
calibration area (Phillips et al., 2004, 2006). To select an optimal                      version 3.5.0 (R Core Team, 2017). These methods are based on
combination of Maxent parameters [regularization multipliers                              an ordination approach (i.e., PCA) to estimate the occurrence
(RM) and feature classes (FC), see below], we developed a series                          and climatic factor densities along environmental axes (PCA-
of candidate models with the R package ENMeval (Muscarella                                env) and calculate niche overlap with them. We evaluated niche
et al., 2018); thus, we assessed five FC combinations: L, LQ,                             overlap with the Schoener’s D metric and Hellinger’s I distance
LQH, LQHP, and LQHPT (where, L: linear; Q: quadratic; H:                                  (Broennimann et al., 2012), both ranging from 0 (no overlap) to 1
hinge; P: product, and T: threshold) and tested RM values                                 (complete overlap). In addition, we evaluated niche conservation
ranging from 0.5 to 4 in increments of 0.5. We selected the                               or niche divergence hypotheses through niche equivalence and
best combination of model parameters according to performance                             niche similarity tests (100 permutations for each analyses) and
and complexity criteria, namely: area under the ROC curve                                 assessed the statistical significance of the measured niche overlap
(AUC) > 0.9, omission rates < 0.10, and the Akaike information                            against null model niches taken randomly from the background
criterion (AICc) where delta AIC ≤ 2. Then, models with specific                          area. The equivalence analysis tests if the ecological niches are
RM and FC settings for each cotton group were run in Maxent                               identical (interchangeable): if the estimated niche overlap value
(i.e., 10-fold cross-validation models, 20,000 background points,                         falls below the 95% confidence interval of the null model, niche
and 1,000 maximum iterations). We selected the average Cloglog                            equivalence is rejected. Niche similarity test compares the niche
output for environmental continuous suitability visualization                             overlap of one range in a randomly drawn background, while
and reclassified it into a binary map (i.e., presence or absence                          keeping the other unchanged. In our study, this process was
of suitable conditions) in ArcGIS version 10.2.1 (ESRI, 2015)                             repeated in either direction (1 ↔ 2): values above or below
by applying a threshold value balancing a low omission error                              the 95% confidence interval of the null model support niche
and the proportional predicted area. Finally, to assess model                             conservatism or niche divergence, respectively.
performance and significance, we evaluated the AUC ratio of
the partial receiver operating characteristic curve (pROC; 1,000                          Niche Optimum and Breadth
replicates, and E = 0.05), calculated the omission rate, and                              Additionally, we performed a post hoc test to assess differences
performed binomial tests with the testing datasets obtained                               in central tendency and statistical dispersion among ecological
previously (see the occurrence data section above) in NTBOX                               niches of the three cotton groups when equivalency or similarity
(Osorio-Olvera et al., 2020).                                                             analyses were inconclusive (Molina-Henao and Hopkins, 2019).
                                                                                          Specifically, we evaluated differences in niche optimum and
                                                                                          breadth following the bootstrap resampling approach described
Niche Overlap, Similarity and                                                             by Molina-Henao and Hopkins (2019), as follows: we calculated
Equivalence in the Environmental Space                                                    niche optimum and breadth values for each cotton group as the
In order to assess how feral cotton may be accounting for                                 median and length of the 95% inter-percentile interval along the
gene flow between crops and wild relatives, we performed niche                            first two principal components (PCA-env), respectively. Then,

Frontiers in Ecology and Evolution | www.frontiersin.org                              5                                                May 2021 | Volume 9 | Article 653271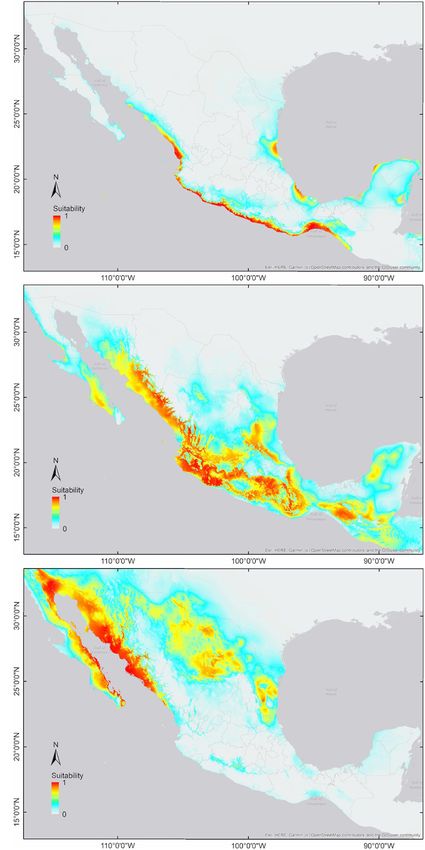
Alavez et al.                                                                                                  Feral Cotton Eco-Geography in Mexico

we estimated the difference in medians and inter-percentile               in R. Particularly, the silhouette analysis measures how well
interval lengths between each group. Afterward, we created                an observation is clustered by estimating the average distance
a null distribution of differences in optima and breadths for             between clusters: if Si is close to 1, objects are very well clustered;
each comparison by pooling the observed presence data and                 if Si is close to 0, objects lie between two clusters; and if Si is
resampling them at random with replacement into two new sets              negative, objects are probably placed in the wrong cluster. On
of the same size as the original samples. From these resampled            the other hand, the CRI quantifies the agreement between the
sets, we calculated the median and length of the 95% inter-               clustering results and an external reference, in this case, cotton
percentile interval and estimated pairwise differences in optima          classes, ranging from −1 (no agreement) to 1 (perfect agreement)
and breadths from the two sets, generating a null model of                (Kassambara, 2017).
differences with these results. We repeated this process 1,000
times for each comparison (i.e., wild-feral, wild-domesticated,
and feral-domesticated). If the observed test statistic (i.e.,            RESULTS
difference in optima and difference in breadths) was higher
than the 95% confidence interval of the null models, the null             Ecological Niche Model Predictions
hypothesis was rejected, meaning that niche optimum or breadth            We generated 40 candidate models for each cotton group and
were significantly different.                                             selected the parameter combinations that obtained the best
                                                                          performance and complexity estimates (i.e., wild: FC = LQHP,
K-Means Clustering                                                        RM = 4; feral: FC = LQ, RM = 0.5; domesticated: FC = LQHP,
To further assess if wild, feral, and domesticated cotton                 RM = 3; Supplementary Materials 2). With these settings,
could be partitioned into different environmental groups, we              all niche models were statistically significant (p < 0.0001∗∗∗ )
evaluated the clustering tendencies of the dataset. First, to             according to both significance evaluations (binomial tests and
observe if the described cotton groups also congregated and               partial ROC analysis; AUC ratios: wild = 1.84; feral = 1.48;
conformed to corresponding groups in the environmental                    domesticated = 1.65). Wild and domesticated cotton models
space, we constructed pairwise bivariate distributions (pair-             exhibited good predictive performance (omission error:
plots), univariate density distributions in the “Seaborn” package         wild = 0.06; domesticated = 0.078), while the feral model
v.0.11.0 (Waskom et al., 2020) in Python 3.4.8 (van Rossum                showed a higher omission error (i.e., 0.185). Model outputs
and Drake, 2009), and a principal component analysis with the             indicate differences in climatic suitability and geographic
“FactoMineR” package in R (Husson et al., 2013). We confirmed             distributions among the three G. hirsutum groups: wild cotton
the clustering tendency by estimating the Hopkins statistic (H)           toward the coasts of the Pacific, southern Baja California Sur,
with the “clustertend” package (YiLan and RuTong, 2015) in R.             and the Yucatán Peninsula, as well as patches along the Gulf
The Hopkins statistic tests the spatial randomness of the data            of Mexico and Isla Socorro; domesticated cotton with broad
by measuring the probability that a given dataset is generated            suitability in northern Mexico; and feral cotton showing a
by a uniform data distribution (i.e., H = 0.5). Thus, if the              wide northwest-southeast pattern, predominantly across inland
Hopkins statistic is close to 0, the null hypothesis is rejected,         regions (Figures 2, 3).
meaning that the data are significantly clusterable (Kassambara,              The most important variables for the three cotton models
2017). Afterward, we conducted clustering analyses through the            were: (1) Wild: annual mean temperature (Bio1); (2) Feral:
k-means unsupervised algorithm with the “factoextra” package              temperature seasonality (Bio4), minimum temperature of
(Kassambara and Mundt, 2017) in R. This method makes                      coldest month (Bio6), and precipitation seasonality (Bio15);
inferences from empirical data without previously referring               and (3) Domesticated: annual mean temperature (Bio1),
to known labels by grouping within the same cluster objects               temperature seasonality (Bio4), annual precipitation (Bio12), and
that are as similar as possible. Briefly, the algorithm randomly          precipitation of driest month (Bio14) (Table 1).
selects k objects from the dataset defined as centroids or
cluster means; then, the remaining objects are assigned to                Niche Overlap
their closest centroid based on their Euclidean distance from             The estimates of niche overlap in the environmental space
the mean, and a new mean is calculated for each cluster. As               indicate that the three cotton groups overlap to some extent
centroids are recalculated, observations are reassigned iteratively       (Table 2). Specifically, feral cotton has a wider overlap
until convergence (i.e., cluster assignments stop changing). We           with both wild (Schoener’s D = 0.29; Hellinger’s I = 0.54)
analyzed four datasets: (1) wild + feral; (2) wild + domesticated;        and domesticated cotton (Schoener’s D = 0.27; Hellinger’s
(3) feral + domesticated; and (4) the three groups together.              I = 0.46), than the latter pair. However, although wild and
The number of clusters (k) to be generated must be specified              domesticated cotton show lower overlap values (Schoener’s
before the analyses, so we set k as the expected number of                D = 0.11; Hellinger’s I = 0.19), their niches slightly share an
clusters according to the known structure of each dataset (i.e.,          environmental space proportion. In addition, the results from
k = 2 or 3) to assess the agreement between the k-means                   the equivalency tests suggest that wild, feral, and domesticated
clusters and our data. To evaluate the goodness-of-fit of our             niches are not equivalent as the overlap estimates fall below
clustering results, we estimated the Silhouette Coefficients (Si )        the 95% confidence interval of the null hypothesis and
and the corrected Rand Index (CRI) for internal and external              significantly support the alternative hypothesis of niche
validation, respectively, with the “fpc” package (Hennig, 2007)           divergence (Table 3 and Supplementary Figure 1). Similarity

Frontiers in Ecology and Evolution | www.frontiersin.org              6                                         May 2021 | Volume 9 | Article 653271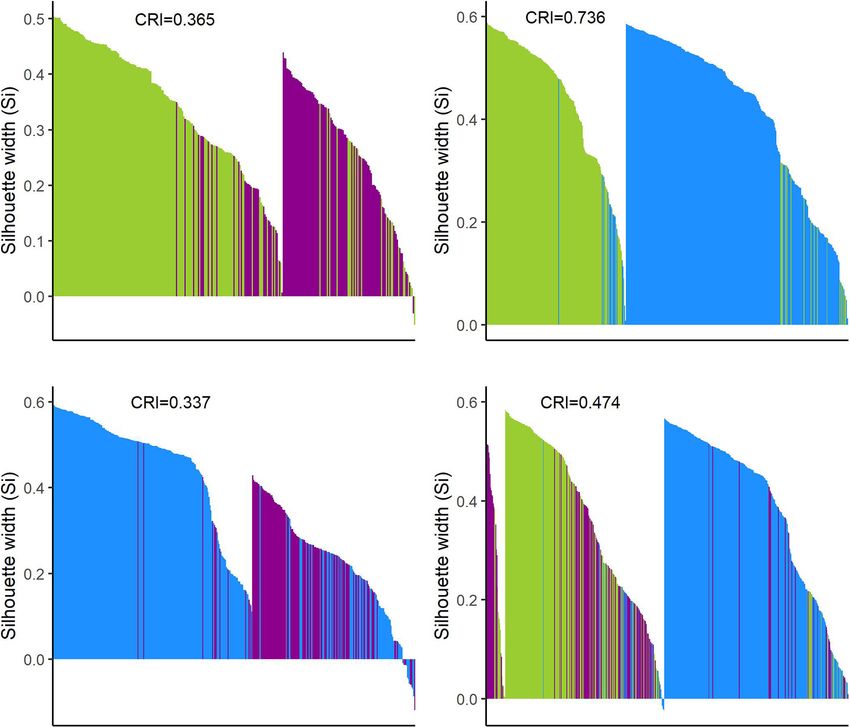
Alavez et al.                                                                                                                  Feral Cotton Eco-Geography in Mexico

                                                                                           Niche Optimum and Breadth
                                                                                           Analyses of niche optimum and breadth show that wild, feral,
                                                                                           and domesticated cotton significantly differ in optimum along
                                                                                           both PCA axes; therefore, central tendencies of PC values are
                                                                                           dissimilar among cotton groups. Conversely, breadth along the
                                                                                           first axis is not statistically different for any of the groups, while
                                                                                           along the second axis, feral cotton breadth shows a broader
                                                                                           inter-percentile range that significantly differs from the other two
                                                                                           (Figure 4, Table 4, and Supplementary Figures 2, 3).

                                                                                           Clustering
                                                                                           The cotton groups showed clustering tendencies in the pairwise
                                                                                           comparison of environmental variables (Supplementary
                                                                                           Figure 4) and PCA biplots (Figure 5). For the three cotton
                                                                                           groups, the first two components explained 71.2% of the
                                                                                           variation in cotton occurrence within the climatic space. PC1
                                                                                           described 53.6% of the variance: Bio7, Bio6, Bio4, Bio11,
                                                                                           Bio13, Bio12, Bio16, Bio2, and Bio1 were the most important
                                                                                           variables explaining variation on this axis (in decreasing order)
                                                                                           with higher contribution values than expected if all variables
                                                                                           contributed uniformly. PC2 described 17.6% of the variance
                                                                                           with Bio17, Bio14, Bio10, Bio5, Bio15, and Bio1 contributing
                                                                                           the most. In both axes temperature and precipitation explained
                                                                                           variability; however, in PC1, temperature variables accounted for
                                                                                           the higher contributions, while along PC2, precipitation variables
                                                                                           did (Supplementary Figure 5). Interestingly, wild, feral, and
                                                                                           cultivated cottons formed corresponding groups along the first
                                                                                           axis, although not completely separated (Figure 5), with feral
                                                                                           cottons laying between the more distant wild and domesticated
                                                                                           cottons (Figure 5D).
                                                                                              These observations were supported by Hopkins index values
                                                                                           close to 0 for all pairwise comparisons as well as for the
                                                                                           whole dataset. Pairwise k-means analysis resulted in clusters
                                                                                           that retrieved the expected groups with acceptable agreement
                                                                                           (Table 5 and Figure 6), with the wild-domesticated cotton
                                                                                           comparison obtaining the highest CRI value (0.736). The
                                                                                           analysis with the whole dataset obtained a good CRI (0.474),
                                                                                           mainly because the two larger clusters recovered most wild
                                                                                           and domesticated groups as expected; however, feral cottons
                                                                                           divided among the three resulting clusters, failing to retrieve
                                                                                           most of its members in a predominant cluster (Table 5
  FIGURE 2 | Predicted environmental suitability (continuous output) for                   and Figure 6).
  members of G. hirsutum wild-to-domesticated complex. (A) Wild cotton;
  (B) feral cotton; and (C) domesticated cotton. Color range: High suitability
                                                                                              The Silhouette plots (Figure 6) depict the assignment of
  (red-orange), medium suitability (yellow-pale green), low suitability (turquoise),       each individual to a cluster as well as its Silhouette index. For
  and no suitability (no color).                                                           pairwise analyses, the resulting clusters predominantly recovered
                                                                                           the expected groups with some inaccurate assignments; again,
                                                                                           the wild-domesticated analysis resulted in the better resolved
                                                                                           clusters according to their expected identity (Figures 6B, 7B),
tests were not significant for niche conservatism nor niche                                while in wild-feral and domesticated-feral clusterings, the
divergence (Table 3), indicating that niches among cotton                                  predominantly feral cluster showed more inexact assignments
groups are not more similar or dissimilar than expected by                                 (Figures 6A,C, 7A,C). The Silhouette plot with the whole dataset
chance. This indicates that the niches are not significantly                               shows a variable degree of cluster resolution (Figures 6D, 7D):
conserved and they may differ in measures of central                                       a predominantly domesticated cluster with few inexact
tendency, statistical dispersion, or both; thus, we conducted                              assignments, a predominantly wild cluster with more inexact
post hoc analyses comparing niche optimum and breadth                                      assignments than the latter (mostly feral), and a small feral-
(Molina-Henao and Hopkins, 2019).                                                          wild cluster with the highest Silhouette indices belonging

Frontiers in Ecology and Evolution | www.frontiersin.org                               7                                        May 2021 | Volume 9 | Article 653271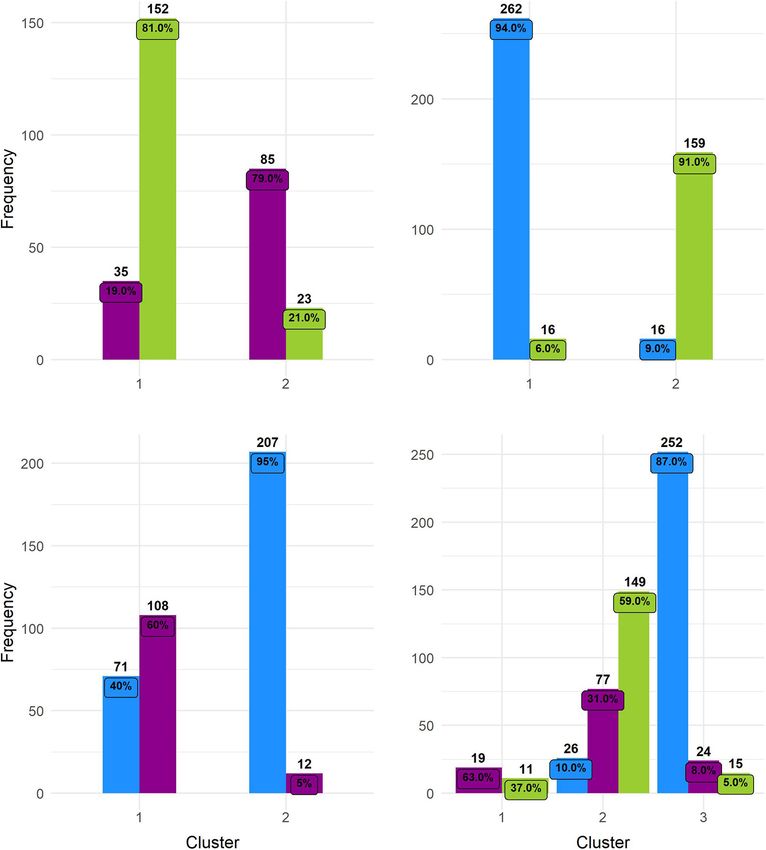
Alavez et al.                                                                                                                         Feral Cotton Eco-Geography in Mexico

  FIGURE 3 | Binary environmental suitability models comparing the extent of the potential distribution of members of G. hirsutum wild-to-domesticated complex
  (colors indicate suitability: wild = green, feral = magenta, and domesticated = blue). (A) Wild vs. feral; (B) wild vs. domesticated; (C) feral vs. domesticated; and (D)
  the three cotton groups.

to feral individuals. In all analyses, Si values indicate that                            cotton niches overlap in the environmental and geographic
several points are between clusters meaning that although                                 space. For wild and cultivated cotton, the resulting potential
the clustering tendency exists, some members of the resulting                             distributions agree with their known occurrences, the former
groupings are proximate to each other, as can be seen in the PCA                          at litoral habitats in the Pacific and Atlantic coasts of Mexico,
and the pair-plots.                                                                       and the latter at the north of the country, which is consistent
                                                                                          with the low omission rates obtained for these models. Moreover,
                                                                                          as we gathered a very complete dataset of highly domesticated
DISCUSSION
Ecological Niches of the
                                                                                          TABLE 3 | Similarity and equivalence tests p-values for niche conservatism (Co)
Wild-to-Domesticated Cotton Continuum                                                     and divergence (Di) hypotheses between wild (W), feral (F), and domesticated (D)
Our results show substantial differences in the ecological                                cotton.
niches of members of the wild-to-domesticated cotton complex;
                                                                                                                W vs. F (Co/Di)       W vs. D (Co/Di)         F vs. D (Co/Di)
however, they also highlight that wild, feral, and domesticated
                                                                                          Equivalency              1/0.0099**            1/0.0099**             1/0.0099**
                                                                                          (Schoener’s D)
TABLE 2 | Niche overlap indices.                                                          Equivalency              1/0.0099**            1/0.0099**             1/0.0099**
                                                                                          (Hellinger’s I)
                            Wild                 Feral               Domesticated
                                                                                          Similarity              0.297/0.525            0.277/0.762            0.436/0.594
Wild                                            0.5402                   0.1846           (Schoener’s D)
Feral                      0.2921                                        0.4548           Similarity              0.248/0.584            0.267/0.733            0.426/0.614
Domesticated               0.1049               0.2734                                    (Hellinger’s I)

Schoener’s D (below diagonal) and Hellinger’s I (above diagonal).                         **Significant p-values (boldface).

Frontiers in Ecology and Evolution | www.frontiersin.org                              8                                                May 2021 | Volume 9 | Article 653271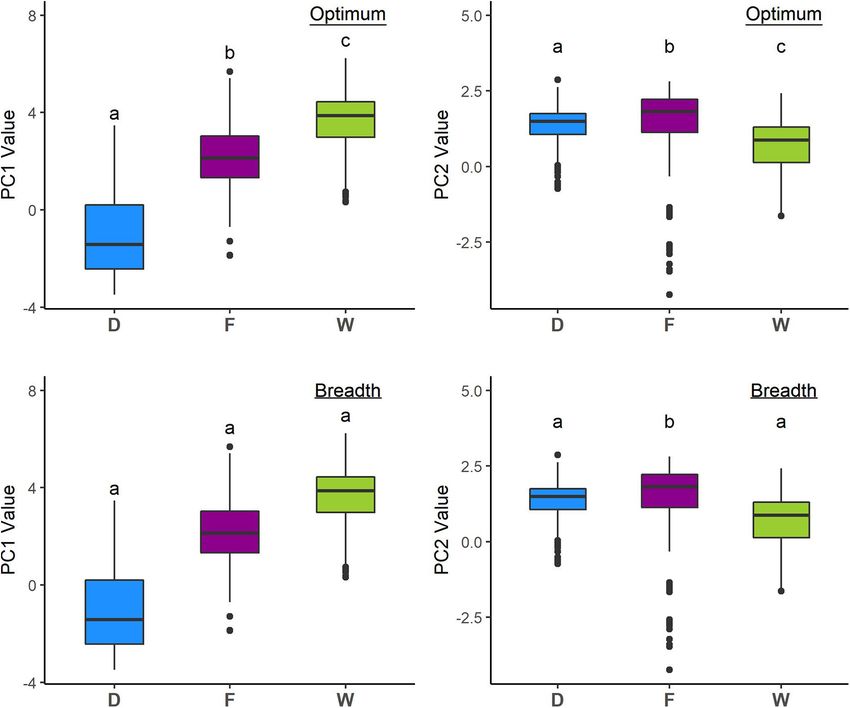
Alavez et al. Feral Cotton Eco-Geography in Mexico
FIGURE 4 | Niche optimum and breadth of the two first principal components (PCA-env). Letters depict statistically significant differences according to bootstrap
tests (see Table 4). Optimum corresponds to the median and breadth to the length of the 95% inter-percentile interval of the PCA values along the first two PC axes.
(A) PC1 optimum, (B) PC2 optimum, (C) PC1 breadth, and (D) PC2 breadth.
cotton localities, its potential distribution is wider than previously Pairwise niche equivalence tests suggest that the niches of
reported in other studies (Rocha-Munive et al., 2018). Feral wild, feral, and domesticated cotton are less equivalent than
potential distribution is broad and extends through northwest- expected by chance, significantly rejecting these niches are
southeast Mexico, thus bridging wild and cultivated distributions, identical. Specifically, no significant p-values were found for
and almost creating a continuum among the three groups the hypothesis of niche conservatism (i.e., complete overlap)
along the country. and highly significant results were obtained for the divergence
hypothesis for any pair of comparisons (Table 3). Indeed, MaxEnt
results illustrate that the suitabilities and potential distribution
TABLE 4 | Niche optimum, breadth, and differences (1) in both parameters of the three cotton groups are very different (Figures 2, 3)
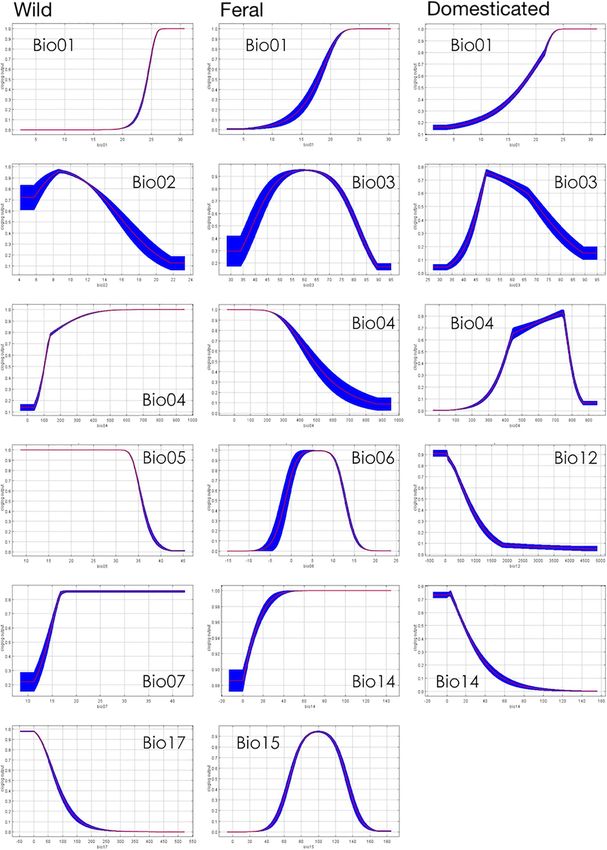
among cotton groups. and, overall, temperature is an important factor in determining
differences among groups, specifically with regard to tolerance
PC1 PC2
to low temperatures: domesticated cottons exhibit the highest
Optimum Breadth Optimum Breadth
tolerance, although cold temperature affects yield (Constable
and Bange, 2015), and feral and wild cottons show intermediate
Wild 3.869 5.055 0.869 2.829 and low tolerance, respectively (Supplementary Figure 4, see
Feral 2.123 5.989 1.817 5.828 distribution densities for Bio1, Bio6, and Bio11; Figure 8
Domesticated −1.426 4.955 1.495 3.005 see response curves for Bio1). However, the three groups
1 wild-feral 1.747*** 0.934 0.948*** 2.999*** also exhibit overlap in several areas: wild and domesticated
1 wild -domesticated 5.296*** 0.099 0.625*** 0.176 cotton in southern Baja California Sur, Sinaloa, and Tamaulipas
1 feral -domesticated 3.549*** 1.034 0.323*** 2.823*** (Figure 3B); wild and feral along the Pacific and Atlantic coasts
Differences with bootstrap significant p-values (***p < 0.0001) are highlighted in (Figure 3A); and, feral and domesticated in northern Baja
boldface. Optimum = median; Breadth = length of the 95% inter-percentile interval. California Sur, Sinaloa, Sonora, and Tamaulipas (Figure 3C).
Frontiers in Ecology and Evolution | www.frontiersin.org 9 May 2021 | Volume 9 | Article 653271Alavez et al. Feral Cotton Eco-Geography in Mexico
FIGURE 5 | Principal component analysis (biplots). (A) Wild and feral; (B) wild and domesticated; (C) feral and domesticated; and (D) the three cotton groups.
Wild = green, feral = magenta, and domesticated = blue.
Moreover, similarity tests indicated that observed values are algorithm retrieved the expected groups with an acceptable
not significantly different than the background and although agreement, supporting correlation within groups and differences
niche optimum analyses revealed significant differences in the between them, especially in pairwise analyses. However, clusters
central tendency (median) of each group –supporting the were not fully separated and some occurrences laid between
conclusion that niches are not identical-, niche breadths were groups, resulting in inaccurate assignments, particularly when
not statistically different in PC1, suggesting that the dispersion the whole dataset was analyzed. In all cases, wrong designations
of the data is similar in the three groups and may account for the were more frequent in the predominantly feral cluster (Figure 6)
observed overlap and non-significant results of the similarity test. but, as our results have shown, this group lays between
Clustering analyses resulted in comparable findings. The k-means the wild and domesticated groups (Figures 3D, 5D), which
explains this pattern.
Notably, the omission rate of the feral model is high
TABLE 5 | Cluster tendency and validation indices for all datasets. despite its width, which reveals that the dataset contains
environmentally uncharacteristic localities. This is consistent
H CRI Si (average) with its breadth being significantly different in the PC2 and
W+F 0.087 0.365 0.311 possessing more outliers than any of the other two groups.
W+D 0.060 0.736 0.421 This could be explained by the heterogeneous nature of cotton
F+D 0.064 0.337 0.348 ferality. Routes to feralization are diverse and comprise numerous
W+F+D 0.065 0.474 0.370 survival strategies that result in genetic and phenotypic variation
Hopkins statistic (H), Corrected Rand Index (CRI), and average Silhouette index (Si). (Ammann et al., 2005; Gering et al., 2019). For instance, feral
Wild (W), Feral (F), and (D) Domesticated cotton. populations can be categorized as “endoferal” or “exoferal”: the
Frontiers in Ecology and Evolution | www.frontiersin.org 10 May 2021 | Volume 9 | Article 653271Alavez et al. Feral Cotton Eco-Geography in Mexico FIGURE 6 | Silhouette plots of k-means clustering analyses. Plots show the Silhouette coefficient (Si) of each observation (bar). Si close to 1: objects are very well clustered; Si close to 0: objects lie between two clusters; and negative Si: objects are probably placed in the wrong cluster. (A) Wild and feral; (B) wild and domesticated; (C) feral and domesticated; and (D) the three cotton groups. Wild = green, feral = magenta, and domesticated = blue. former originating from a single domesticated lineage, whereas the genotype–phenotype interactions across new environmental the latter are derived from further admixture with domesticated conditions. Thus, feral populations can exhibit a greater range taxa, wild relatives, or both (Gressel, 2005; Gering et al., of phenotypes than their domesticated ancestors and also adapt 2019). As mentioned above, G. hirsutum has a long history of locally to different settings (Hendrickson, 2013; Burger and domestication in Mexico and like other domesticated plants in Ellstrand, 2014). The resulting genetic divergence can cause a Mesoamerica, it has been subjected to a diversity of in situ and shift in the species’ fundamental niche (Mukherjee et al., 2012) ex situ management practices, coupled with constant human- while plasticity can be important in colonizing new environments mediated seed movement (Casas et al., 2007). These continuous (Gering et al., 2019). Therefore, feral G. hirsutum most likely and ongoing processes, along with gene flow and introgression encompasses mixed populations with different evolutionary within the primary gene pool, have shaped the evolutionary histories and origins which, in turn, could comprise wider history of G. hirsutum resulting in complex relationships among environmental tolerances and potential ranges. the members of the wild-to-domesticated continuum. As a The feralization process and its population dynamics are still result, feral populations could have emerged from multiple unclear (Meffin et al., 2015). The diverse pathways from which domesticated sources (e.g., pre-Hispanic or post-Columbian feral populations originate and evolve obscure the elucidation cultivars, varieties from the nineteenth to twentieth centuries, of their evolutionary history. In addition, individual populations past or contemporary incipient domesticates, or current highly may differ in their responses to particular environments and domesticated cottons) and experienced admixture from different the conditions that allow their establishment may differ from wild and cultivated lineages at multiple timepoints. Moreover, those that determine their persistence (Meffin et al., 2015). feralization can produce rapid evolutionary changes due to novel Furthermore, local biotic interactions can also play a role in selective pressures and introgression (Mukherjee et al., 2012; structuring populations. Knowledge on these processes is lacking Ellstrand et al., 2013; Gering et al., 2019). The consequences of for feral cotton and this complicates the characterization of its these processes will depend on endo and/or exoferal origins and niche. Yet, recognizing these caveats will benefit future modeling Frontiers in Ecology and Evolution | www.frontiersin.org 11 May 2021 | Volume 9 | Article 653271
Alavez et al.                                                                                                                   Feral Cotton Eco-Geography in Mexico

  FIGURE 7 | Histograms of k-means clustering results. Numbers above bars = total number of individuals grouped in a particular cluster. Numbers inside
  bars = percentage. (A) Wild and feral; (B) wild and domesticated; (C) feral and domesticated; and (D) the three cotton groups. Wild = green, feral = magenta, and
  domesticated = blue.

approaches dealing with ferality. For instance, community based                        currents, or hurricanes), irrigation channels, and nearby roads;
approaches built on phylogenetic and ecological information                            (2) biotic factors such as birds that collect fibers and seeds to
could lead to improved niche construction by capturing the                             build their nests (Arteaga Rojas, 2021) or livestock that feeds on
environmental responses of particular lineages within the feral                        seeds and disperse them; and (3) by human activities associated
group and revealing cryptic niche evolution or local adaptation                        with cotton production (Wegier et al., 2011; Wegier, 2013).
events (Alvarado-Serrano and Knowles, 2014; Smith et al., 2019).                       Human-mediated seed movement is of particular interest when
                                                                                       looking into ferality sources. For instance, seed leakage occurs
Origin of Cotton Ferality: Seed                                                        during transportation when unsuitable vehicles are used and the
Dispersion in Mexico                                                                   lack of route records hinders actions to address this issue. In
In Mexico, cotton seeds can escape cultivation through several                         Mexico, most seeds are distributed as cattle feed after ginning.
processes that can be classified into three broad categories: (1)                      It should be noted that after passing through the digestive tract
Abiotic factors associated with the climate (e.g., storms, ocean                       of livestock, 3% of the seeds are able to germinate, grow into

Frontiers in Ecology and Evolution | www.frontiersin.org                          12                                             May 2021 | Volume 9 | Article 653271
Alavez et al. Feral Cotton Eco-Geography in Mexico FIGURE 8 | Response curves showing the relationships between suitability and bioclimatic variables. an adult plant –if suitable environmental conditions prevail– are stored in cool, ventilated places to reduce the likelihood of fire , and subsequently disperse seeds and pollen (Wegier, 2013). (seeds are flammable due to their high lipid content). These are Additionally, these seeds are transferred to ranches where they usually roofed warehouses, often built with branches, with wide Frontiers in Ecology and Evolution | www.frontiersin.org 13 May 2021 | Volume 9 | Article 653271
Alavez et al. Feral Cotton Eco-Geography in Mexico
ventilation openings, thus allowing both biotic and abiotic seed relationship between cultural richness and biological diversity.
dispersal (Wegier, 2013). Moreover, cotton is also grown under With the advent of GM crops, concerns about gene flow toward
traditional management systems and home gardens. Within these wild relatives have been increasing and several international
practices, Mexican locals and small-scale farmers traditionally agreements and national legal frameworks have been set to
participate in plant and seed exchange networks that influence minimize or prevent adverse effects (e.g., Convention on
seed movement, and their involvement in ferality merits further Biological Diversity, Cartagena Protocol on Biosafety, Nagoya-
assessment. In the past few years, cotton has increasingly joined Kuala Lumpur Supplementary Protocol, Mexican Biosafety Law
the ornamental plant business and the sale of fully grown cotton of Genetically Modified Organisms, among others), particularly
plants has progressively become popular across Mexico. With in areas where GM varieties and wild relatives coexist. As a
this in mind, genetic evidence reveals that some feral populations response, measures involving buffer zones or separation distances
could correspond to highly improved plant escapes. According to between crops and native distributions have been established
Wegier et al. (2011), the feral populations that they evaluated had to reduce admixture. For instance, in Mexico, geographical
the same single haplotype that was found homogeneously in all separation is mandatory for the sowing and release of GM cotton
cultivated plants. The only exception was the feral population of into the environment, and the distribution of wild populations
Morelos, in central Mexico, which was genetically more diverse and cultivars is taken into consideration in risk assessments
(Wegier et al., 2011). (Rocha-Munive et al., 2018).
Unlike voluntary plants, which rarely last more than one In this study, for niche modeling the wild cotton, we chose
or two seasons, feral populations are self-perpetuating and a “broad distribution” approach for two main reasons: (1) the
occur in uncultivated areas (Gressel, 2005; Devaux et al., 2007). occurrence of wild forms scattered throughout the Pacific Islands
Nevertheless, volunteers in field margins can be sources for feral as well as the Caribbean and Mexican coasts suggests wide
populations because crop ferality is initiated by dispersion to diffusion via ocean currents (Fryxell, 1979) and, as Sauer (1967)
adjacent unmanaged ecosystems. Moreover, if cultivation ceases stated, “if lint bearing cottons were naturally present in the
in previously cultivated fields, semi-domesticated species could New World as sea dispersed pioneers, they were not likely to
still grow in those lands for many years, becoming feral (or be confined to Yucatán”; and (2) even if Mexican populations
ruderal) when agricultural management stops. That could be from the Pacific coast would not be regarded as “truly wild”
the case for many feral populations described in this study. (Coppens d’Eeckenbrugge and Lacape, 2014), they are part of
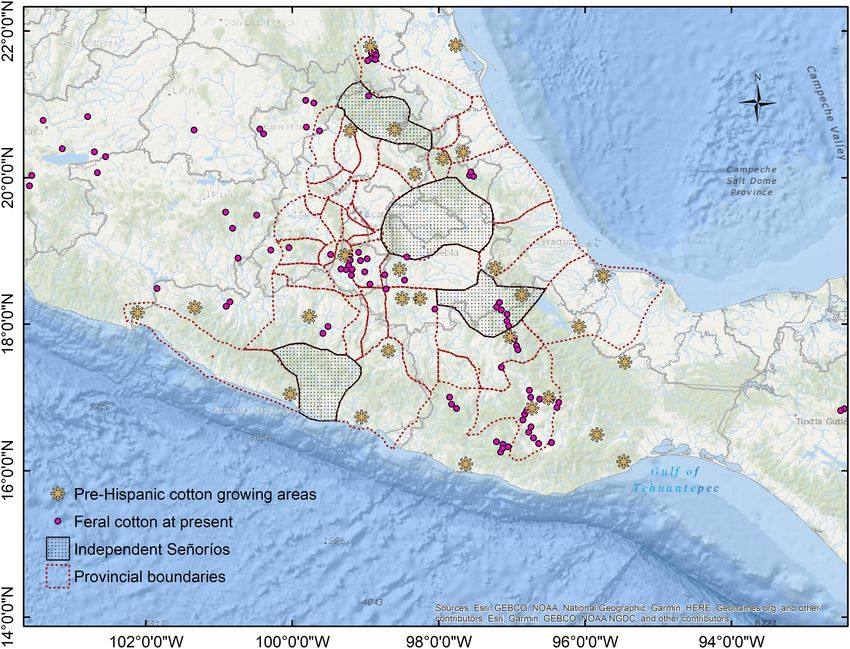
Notably, when reviewing the history of localities where feral the naturally occurring flora at coastal dunes of the region
cotton has been described, several sites corresponded to pre- and harbor valuable genetic diversity (Wegier et al., 2011).
Columbian inland cotton-growing areas, particularly within and Thus, they deserve equal attention to conservation efforts. We
nearby the Aztec Empire (such as the above mentioned Morelos have also modeled the ecological niche of domesticated cotton
population; Berdan, 1987; Figure 9). Moreover, as cotton and using an extensive set of localities from GM cotton release
its derived products played a major role on Mesoamerican applications and not only the sites that have permission for
civilizations’ economy, a dynamic productive chain involving commercial sowing (Sandoval Vázquez, 2017). The reasoning
constant transportation of raw cotton and textiles was created for this approach was also twofold: (1) solicited polygons
around production, spinning, weaving, and trade. As such, cotton should reflect the environmental requirements preferred for
has been anciently moving across Mexico due to economic domesticated cotton, allowing us to better characterize its niche;
and cultural activities, as have been documented for the Aztec and (2) including more data would portray a scenario of the
Empire and its tributary provinces (Berdan, 1987), the Mayan extent of GM cotton potential distribution if the majority of
region at Yucatán Peninsula (Ardren et al., 2010), Mixtec Oaxaca the applications were approved, which would be of interest
(King, 2011), and the Huichol Sierra (Mathiowetz, 2020). These for adequate risk assessments. Moreover, we have modeled the
productive networks remained during Colonial times; however, environmental niche of feral cotton, a heterogeneous group that
when northern cultivars replaced most of the cotton production occurs in populations scattered throughout Mexico and could
in Mexico, former cotton growing areas and transportation be playing a role in gene flow dynamics within G. hirsutum
routes declined. Yet, feral cotton distribution today may have wild-to-domesticated complex. Furthermore, as some of these
been influenced by these activities and some localities conform populations may be vestiges of pre-Hispanic cultivation, their
to vestiges of pre-Columbian cotton-related activities. genetic diversity could be very valuable for documenting the
domestication history of cotton in Mexico.
The evolutionary processes that originate and maintain
Implications on Cotton Conservation in cotton’s diversity have led to unique and shared variation.
Mexico Conserving the populations that harbor that diversity should
Centers of origin, domestication, and genetic diversity are be an imminent endeavor. From our perspective, an integral
fundamental areas for the conservation of biodiversity and the approach toward this goal is essential, meaning that both in situ
sustainable use of its genetic resources, particularly of crop wild and ex situ conservation are necessary and complementary. For
relatives (Mercer and Perales, 2010; Casas et al., 2019). Therefore, this purpose, understanding that G. hirsutum conforms to a
in Mexico, access and management of the G. hirsutum wild- wild-to-domesticated continuum is fundamental, as it recognizes
to-domesticated complex must be responsible and considering that valuable genetic diversity is contained in wild populations,
in situ conservation as a priority, while also recognizing the close native landraces, and some feral and domesticated lineages.
Frontiers in Ecology and Evolution | www.frontiersin.org 14 May 2021 | Volume 9 | Article 653271You can also read