Effect of Environmental Gradient on Species Composition and Structure of Gemeshat Forest, North Wollo, Ethiopia - Iiste . Org
←
→
Page content transcription
If your browser does not render page correctly, please read the page content below
Advances in Life Science and Technology                                                                 www.iiste.org
ISSN 2224-7181 (Paper) ISSN 2225-062X (Online)
Vol.66, 2018

   Effect of Environmental Gradient on Species Composition and
       Structure of Gemeshat Forest, North Wollo, Ethiopia
                                    Andualem A1       Amare T2    Yigard M3
              1.Sirinka agricultural research center, P.O.Box 74, Woldiya, North Wollo, Ethiopia
    2.Hawassa university Wondo Genet college of forestry and natural resource, P.O. Box 128, Shashamene,
                                                     Ethiopia
3.Ethiopia Environment and Forest Research Institute (EEFRI); B.O.Box 24536 code 1000, Senior, Addis ababa,
                                                     Ethiopia

Abstract
A study on Gemeshat remnant forest sites were conducted to determine their woody species diversity and
structure to provide information for a sustainable management of the forest. A total of 60 quadrants, measuring
20 × 20 m each, were established along line transects laid across Gemshat forest using stratified random
sampling. Sixty species, representing 38 families and 60 genera, were recorded and documented. From all the
species identified, 29(48.3%) and 31(51.7%) were trees and shrubs respectively. The major families are
Fabaceae and Oleaceae. The highest diversity of woody species was 3.3 recorded in Chekaw forest followed by
3.1 in kelta forest while their corresponding evenness values were 0.81 and 0.86 respectively. The vegetation
structure of Gemeshat forest implies that larger diameter classes are lost because of illegal cutting of woody
species by local inhabitants for firewood collection and timber production. The highest basal area is recorded by
Chekaw forest (6.28 m2ha-1) followed by kelta forest (4.09m2ha-1). IVI values of woody species ranges from 0.6
to 63.55. The forest requires urgent conservation measures by minimizing grazing of livestock and selective tree
cuttings. Moreover, the remnant forest patches host several woody species, wild animals and bird species. Based
on the results, regeneration status of the forest and appropriate conservation measures for sustainable use of the
forest resources are suggested.
Keywords: Species diversity, Importance value index (IVI), Population Structure, sustainable use of forest

1. Introduction
Ethiopia is one of the top 25 biodiversity-rich countries in the world as the major center of diversity and
endemism for several plant species, due to its great geographical diversity, elevation, vegetation, soil types and
also diverse climate (Abiyou et al., 2013, Amogne, 2014). Woody plants constitute about 1000 species out of
which 300 are trees (Bekele, 2016). Biodiversity measurement typically focuses on the species level and species
diversity is one of the most important indices for sustainable land use practice to reverse the decline of
biodiversity by evaluating ecosystems at different scales (Shackelton, 2000, Ardakani, 2004).
      According to MEFCC (2016), current Ethiopia’s forest cover is 15.5 % which includes enormous areas of
forest, dense wood lands,bamboo and plantation forests of the country. Forest is also defined as a land area
covering a minimum of 0.05‐1 ha that is covered by trees and bamboo at least of height 2m at maturity with tree
crown cover of more than 20 %.
      The knowledge of the floristic composition of an area is a prerequisite for phytogeographical studies,
conservation, protection, management and monitoring forest resource activities, (Jafari and Akhani,
2008).Structural analysis and Species diversity are essential to provide information on species richness, forest
management, forest ecology and ecosystem functions (Pappoe et al.,2010). Forest composition, community
structure and diversity pattern are important ecological attributes significantly associated with principal
environmental and anthropogenic variables (Gairola et al.,2008).Very few remnant forests remain today due to
human activities (Badege ,2001).The flora of North wollo is the least known still now, mainly due to lack of
access (Alerts et al., 2006) and the species-elevation relationship is also less studied (Lomolinoes ,2001).
      Identifying biodiversity-rich areas along environmental gradients is used as a criterion for biodiversity
conservation priority setting (Brashear et al., 2005).
      Remnant forests are secured from cutting when tropical forests are cleared for agriculture or grazing, act as
nuclei of forest regeneration. They have a clear effect on the species diversity, composition, and ecology of the
surrounding vegetation (Manette and Robin, 2014).The study areas have been rich in flora, fauna and bird
species. However, remnant forest has been pressurized by the surrounding society through in appropriate land
use, the increase in settlement expansion nearby dwellers and also an increase in deforestation in associated with
landslide. Soil erosion is a serious problem in the study areas (Habru WOA, 2012). Therefore, it is important to
prioritize biodiversity conservation sites by taking conservation activities which are basic and useful for the
forests as well as the surroundings (Margules et al., 2007).The availability of accurate data on forest resources is
an essential requirement for protection, conservation, management and planning for sustainable development
(Sandalow, 2000, FAO, 2007). There is a need to generate relevant information in order to ensure the

                                                         8
Advances in Life Science and Technology www.iiste.org
ISSN 2224-7181 (Paper) ISSN 2225-062X (Online)
Vol.66, 2018
conservation, management and sustainable utilization of remnant forests of north wollo in particular and other
forests of Ethiopia in General. Therefore, the objectives of this study were to: (1) assess the species composition
the forests; (2) determine the diversity of woody species in and; (3) to study the population structure of woody
species.
2. Materials and methods
2.1. Description of the Study Area
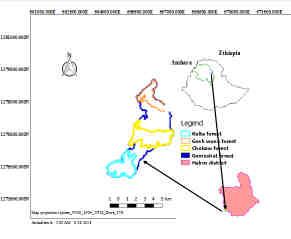
The study area (Figure 1) is located in Habru District, North Wollo Zone,Amahra Region at the distance of 478
km far from Addis Ababa along Dessie to Woldiya road. It is found at 23 km from Habru district at Wurgessa
town. The forest is located between UTM 56°40'00"-56°70'00”E longitude and latitude 37N 12°73'.50"to
12°78'.40"N latitude. Gemeshat forest is estimated to cover an area of 527 hectare; of these, 94 hectare accounts
an area of kelta forest (2045-2300m a..l), 74 hectare for Gosh Wona forest (and 128 hectare belongs to Chekaw
forest(1996-2433m a.s.l). The annual mean temperature of study area is 27˚c with mean annual rain of 923mm.
The altitudinal ranges is from 1996 to 2433 meters above sea level (m.a.s.l.) and its rainfall distribution is
bimodal with the main rainy season July to September and the small rainy season at end of February to end of
April (Shimelse,2007).
Figure 1.Map of the study area
2.2. Sampling design
A systematic stratified random sampling technique was used to collect vegetation data in the forest. Sample plot
of 20 m× 20 m (400 m2 ) was for trees of height >2m and DBH>10cm. Five sub plot of 5mx5m (25 m2 ) were
laid for shrubs with height greater than 0.5-5m.Five smaller plot of 2mx2m (4 m2 ) also used for seedling 2 m and diameter at Brest Height (DBH) >2 cm
9Advances in Life Science and Technology www.iiste.org
ISSN 2224-7181 (Paper) ISSN 2225-062X (Online)
Vol.66, 2018
were measured for tree and shrubs and. DBH measurement was taken at about 1.3m from the ground using
measuring tape. Seedling and saplings of trees and shrubs were counted to estimate the regeneration status of the
forest.
2.3.3 Environmental Data Collection
The altitude of each quadrates was recorded by using global position system (GPS) and geographical coordinates
were measured using (Garmin 72 Chanel GPS) and slope degree (using Suunto clinometers), in the middle of the
main plots. Engineering compass was used to measure direction and aspect of plots. Altitude, slope, and aspect
of each study plots were recorded using GPS and clinometer. Woody species diversity, stand characteristics and
regeneration status are the major biotic factors. While Altitude, slope and aspects are the abiotic factors
considered for study.
2.4. Data Analysis
2.4.1. Floristic Data analysis
The collected Floristic data were recorded, summarized and analyzed by using Microsoft Excel, SPSS soft ware
version 16.
2.4.2. Plant Diversity
Species diversity is determined by Shannon‘s diversity index and it was calculated by using Kent and Coker
(1992), which gives more weight to rare species. = −∑ × — (1)
Species evenness was calculated as the ratio of observed diversity to maximum diversity using the equation
∑ ×
(Kent and Coker, 1992): = = − − − − − −(2)
The Sorenson’s coefficient of similarity (SC) was calculated using (Sorensen,1948).
#$
!" = × 100 − − − − − − − − − − − − − (3)
%&%#$
Where C=Number of species common to both forest sites;a and b =the number of species at forest sites a and b
(Magurran, 1988).
2.4.3. Plant Population Structure Data Analysis
Relative density, relative frequency, relative basal area, important value index (IVI) and basal area were
calculated to determine the vegetation structure and the dominant species of the forest using formulas used by
(Mueller-Dombois. and Ellenberg, 1974).
2.4.4. Stand characteristics of remnant forest
Stand characteristics expressed in number of trees/ha, DBH and height class distribution.
The vegetation and environmental factors was analyzed Using SPSS 16 and Microsoft Excel, 2013.Effect of
environmental gradient on structure was analyzed using one way ANOVA The result of the analysis was
summarized and presented using tables, and bar graphs.
3. Result and discussion
3.1. Species Composition
Sixty species recorded in the quadrats from all Gemehsat forest sites represented 60 genera and 38 families.
Totally 31, 38 and 25 families and, 39, 56 and 34 Genera and species were identified in Kelta,Chekaw and Gosh
wona forests respectively. Among these 21 families, 25 genera and 25 species are common to Gemeshat forest
sites.
5
4
3
2
1
Rhizophorac…
0
Fabaceae
Rosaceae
Rubiaceae
Celastraceae
Sapindaceae
Tiliaceae
Ebenaceae
Anacardiaceae
Apiaceae
Apocynaceae
Asteraceae
Boraginaceae
Capparidaceae
Ericaceae
Flacourtiaceae
Loganiaceae
Meliaceae
Melianthaceae
Myrsinaceae
Phytolaccaceae
Pittosporaceae
Santalaceae
Sapotaceae
Solanaceae
Ulmaceae
Oleaceae
Lamiaceae
Moraceae
Loganiaceae
Araliaceae
Myrtaceae
Oliniaceae
Podocarpaceae
Polygonaceae
Sterculiaceae
Cupressaceae
Figure 2.All woody species per families across Gemeshat forest sites
The most frequent families are Fabaceae and Oleaceae (4 species), and Euphorbiaceae, Lamiaceae,
Rosaceae, and Rubiaceae (3 species each),Celastraceae, Moraceae, Sapindaceae, and Tiliaceae (2 species each)
28 families( represented by 1 species accounts 5.26%, 10.53%, and 10.53% share in the study areas
respectively. Twenty eight families were represented by only one species (73.68%).
10Advances in Life Science and Technology www.iiste.org
ISSN 2224-7181 (Paper) ISSN 2225-062X (Online)
Vol.66, 2018
The number of families recorded is greater than the works of (Kitessa and Bishaw .2008).This might be due
to the more percentage of trees than shrub species. Woody species belongs to shrub and trees account 48.3% and
51.7 % respectively. The total number of tree species recorded from the study area also comparable with Wof-
Washa reported by (Gebremicael et al., 2013).
3.2. Species diversity indexes and similarity of Gemeshat Forest sites
Sixty woody species were recorded from Gemeshat forests. The total number of woody species recorded (i.e.,
species richness) were 34 and 60 for Gatira Georgis and Gemeshat forest respectively. The Shannon wiener
index and Species richness is higher in Chekaw forest followed by Keleta forest (Table 1).
Table 1.Diversity indices across remnant forest sites in North Wollo, Ethiopia
Diversity indices Keleta forest Chekaw forest Gosh wona forest
Shannon-weiner index 3.1 3.3 2.78
species richness 39 56 34
Species evenness 0.86 0.81 0.8
The species diversity values are highest in Chekaw forest followed by Keleta forest. Moreover, the study
areas in species diversity are also higher than yilat natural forests (H’=2.94 and lower E=0.84 reported by (Sisay,
2016).
Higher species diversity is generally thought to indicate a more complex and healthier community due to a
variety of species allowed for more species interaction, hence greater system of stability. The difference in
species diversity and evenness between remnant forests is due to type of tree, number of regenerated species, soil
nutrient status and geographical location (Robert and John, 2014, Manette et al., 2014, Koushik et al., 2015,
Ermias, 2011).In general, compared to most of the studies conducted in the country higher species richness and
diversity index were recorded for Gemeshat forest sites.
Woody species retained on Gemeshat forest are remnants of the natural vegetation found in the same agro
ecology with slight altitudinal difference in north Wollo, Ethiopia. Hence, similarities in woody species
composition are expected between the forests. Accordingly, 80 % of the species in the Kelta forest were also
observed chekaw forests followed by 78.3% of species found in Kelta and Gosh wona (Table 2). This difference
is due to nature of species, altitude and soil status of the forest.
Table 2.Sorensen similarity coefficient in Gemeshat forests of North Wollo, Ethiopia
Forest sites Keleta forest Chekaw forest Gosh wona forest
Similarity
Keleta forest 1 80 78.3
Chekaw forest 1 66.7
Gosh wona forest 1
3.3. Vegetation structure
3.3.1. Density and diameter at breast height
Woody species with a diameter at breast height (DBH) greater than 2.5cm were measured to analyze the DBH
and height class distribution in the forests. The DBH size classes were defined as to nine class intervals( 35cm. Individuals
with DBH less than 2.5 cm and height less than 2m were counted.
The number of tree species in DBH class less than 2.5cm.were represented by 526 stems ha-1(42.1%) ,470
stem /ha(26.2%), and 328 stems/ha(26.2%) at Kelta forest,chekaw and Gosh , while,453(31.86%) stems/ha at
Gemeshat forest While the DBH class >10cm were also highest in chekaw forest followed by Keleta and Gosh
wona forests(Figure 3).
800 Kelta forest
600
Chekaw forest
No of 400
Gosh wona forest
individual 200
ha-1
0
Figure 3.The DBH class of Gemeshat forest sites
The density of woody species also decrease as the DBH class increases, implies the number of individuals
11Advances in Life Science and Technology www.iiste.org
ISSN 2224-7181 (Paper) ISSN 2225-062X (Online)
Vol.66, 2018
ha-1 is highest in the lower DBH class. A similar result was reported by (John et al., 2015, Ahmed et al.,
2017,Tesfaye et al., 2017,).The density of plant species with DBH class as their contribution of the numbers of
species were given in Table 3.The density of woody plant species increases with increasing number of species.
So the general pattern of DBH class size distribution forms an irregular inverted J-shape (Figure 3) for the most
selected dominant trees species. This might be associated with selective cutting of trees by people for
construction and other house use.
Table 3.DBH class and the density of plant species in Kelta,chekaw and Gosh wona forest
DBH Class No. Species Density ha-1 BA(m 2ha-1)
Kelta Chekaw Goshona Kelta Chekaw Goshona Kelta Chekaw Goshona
35cm 1 5 1 4 12 2 0.63 2.05 0.29
The density of all woody species in Gemeshat forest sites based on DBH (Diameter at Breast Height)
greater than 10 cm (a) was found to be 74,188 and 112 individuals per hectare in kelta, Chekaw and Gosh wona
forest respectively. While it was 15, 20 and 28 individuals per hectare on DBH greater than 20 cm (b) in Kelta,
Chekaw and Gosh Wona forest respectively. Similar result on Bale mountain national park also reported (Haile
et al.,2008).
The highest basal area is recorded in DBH class 10.1-15 cm and the highest basal area attained by chekaw
forest followed by Gosh Wona forest.In Gemeshat forest sites, the number of individuals per hectare for both
DBH classes (DBH>10 and DBH > 20) was also high. This indicates the forest is under serious degradation due
to human activities such as illegal cutting of woody species; grazing and browsing of by livestock. The ratio of
DBH greater than 10 cm (a) to DBH greater than 20 cm (b) for Kelta, Chekaw and Gosh wona forest was found
to be 4.9,9.4 and 4 respectively,. So, this ratio is used as a good indicator as to the status of a particular forest. In
this regard, compared many forests, the Gemeshat forest sites showed a higher ratio implies the predominance of
small size trees and shrubs. Hence, it could be considered as a regenerating forest.
The total number of species found in the lower DBH class is highest in Chekaw forest followed by Keleta
and Gosh wona forest. This trend also decrease as the DBH class increases in all Gemeshat forest sites. The
result is higher than Wotagisho forest south west Ethiopia reported by (Dikaso and Tesema, 2016).
Table 4.The three most abundant species in each Gemeshat forest sites according to decreasing order of the
importance value index (IVI)
Forest type Species Relative Relative Relative basal IVI (%)
frequency (%) density (%) area ( %)
Keleta forest Juniperus procera 8.8 6.4 22.0 37.1
Olea europaea 8.1 6.4 14.3 28.8
Olinia rochetiana 11.2 6.4 8.5 26.1
Chekaw forest Podocarpus falcatus 8.67 3.35 14.34 26.36
Olinia rochetiana 6.15 5.49 12.25 23.89
Psdyrax shemperi 7.01 4.57 11.22 22.80
Gosh-wona Juniperus procera 15.29 8.33 39.93 63.55
forest Acacia abyssinica 14.79 8.33 34.14 57.26
Maytenus arbitifolia 13.78 9.03 2.74 25.55
Juniperus procera and Olinia rochetiana are the most important species in Keleta and Gosh wona forests.
Podocarpus falcatus is the most important species in Chekaw forest. Species less than 10 ranks in the IVI values
deserve appropriate conservation measures (Simon and Girma, 2004).
Basal area
The normal value of basal area in Africa is expected to be between 23-37m2/ha reported by (lamperchet,
1989).In this regards, the total basal area of Gemeshat forest sites was recorded in the order of Chekaw forest
(6.28 m2ha-1) followed by kelta forest (4.09m2ha-1), and Gosh wona forests (2.43 m2 ha-1) (Table 5).However, the
total basal area recorded in the study areas are less than Gurra Farda Forest(90.6 m2 ha-1)( Kitessa and
Bishaw,2008),and lammo natural forest(13.35 m2 ha-1)(Melese and Wendawek,2016),Wof-Washa,Wontagisho
forest(46.32m2ha-1) (Gebermicael et al.2013) and Denkoro forest(45 m2 ha-1)(Ayalew et al.,2006) of Ethiopia.
12Advances in Life Science and Technology www.iiste.org
ISSN 2224-7181 (Paper) ISSN 2225-062X (Online)
Vol.66, 2018
While, the total basal area of Gemeshat forest are greater than Yilat(1 m2 ha-1 (Sissay(2016).
Table 5.Basal area distribution across Gemeshat forests of North Wollo, Ethiopia
Forest sites Gosh wona forest Kelta forest Cheakw forest
Basal area(m2/ha) 2.43 4.09 6.28
3.4. Population structure and diversity environment gradient relationship of Gemeshat forest sites
Altitude had showed a decreasing trend for Shannon weiner index, species evenness and species richness in the
remnant forests.The highest and lowest species diversity is attained in the lower and upper altitude classes
respectively (Table 5).The maximum species diversity values recorded in 1900-2100m a.s.l.While the minimum
values of species diversity is attained by >2300m a.s.l.This imlies shannon weiner index , species evenness and
species richness values decrease as altitude increases. The result is comparable with other studies (Alemayehu et
al., 2010).
Table4.Altitudinal effect on species diversity of remnant forests of north Wollo
Altitude Shannon-weiner index Species evenness Species
richness
1900-2100 3.32 0.84 52
2100-2300 3.19 0.81 49
>2300 3.05 0.79 49
Altitude had showed significant effect on height and basal area at p2300 m a.s.l 6.5+0.8 5.2+3.4 0.05+0.1 b
Ns b
Slope 70% 6.8+7 5.5+3.9 0.13+0.1Ns
Ns a
Aspect E 6.7+0.1 5.8+ 4.1 0.06+0.1Ns
Ns b
EW 6.9+9 4.7+ 3.1 0.05+0.1Ns
Mean within the same column followed by the same letter are not significantly different at (p = 0.05).Ns=non
significant
4. Conclusion and recommendation
The major families identified in Gemehsat forest include Fabaceae and Oleaceae (four species each).
The highest species diversity is attained in Chekaw forest and the lowest species diversity is recoded in
Gosh Wona forest. The less diverse forest site implies degraded forest than the two forest sites.
The highest basal area is recorded by Chekaw forest (6.28 m2ha-1) followed by kelta forest (4.09m2ha-1).
The highest IVI value was contributed by Juniperus procera in Gosh wona and Keleta forest.
The density of woody species decreases with increasing DBH implies the larger trees in Gemeshat forest
were under huge pressure due to illegal cutting of woody species and cattle grazing in the forest.
it can be concluded that remnant forests in the study area possess high species diversity, diverse floristic
composition, & healthy structural population with good regeneration status.
However, the major natural & anthropogenic activates observed include landslide, erosion, overgrazing,
inappropriate land use, illegal cutting of tree for timber and fuel wood collection.
Therefore, it needs effective management intervention to sustain goods &services from forests.
Based on the findings the following recommendation was forwarded:
Raising awareness on the values of the forest and its ecological consequences of deforestation..
Species with low IVI needs to be prioritized for conservation.
Sustainable protection and management of the forests needed through the collaborative effort of the
government, NGO and the local community for reduction of woody species cutting.
Regeneration and soil status of the forest should be further investigated from remnant forest on suitable
basis
References
13Advances in Life Science and Technology www.iiste.org
ISSN 2224-7181 (Paper) ISSN 2225-062X (Online)
Vol.66, 2018
Abiyou, T.(2013).The Contribution of Ethiopian Orthodox Tewahido Church in Forest Management and It’s
Best Practices to be Scaled up in North Shewa Zone of Amhara Region, Ethiopia.
Aerts R, Van-Overtveld K, DeckersJ. (2006).Species composition and diversity of small Afromontane forest
fragment in northern Ethiopia. Plant Ecology187:127-142.
Ahmed E, Ali S and Addisu A (2017).Structure and regeneration status of woody plants in the Hallideghie
wildlife reserve, North East Ethiopia
Alemayehu W, Frank J.and Frans B (2010).Species and structural diversity of church forests in a fragmented
Ethiopian Highland landscape.
Amare T and Bhardwaj D(2016). Study on natural regeneration of Quercus glauca Thunberg forest and its
relation with site Condition.
Amogne A. (2013).Forest resource management systems in Ethiopia: Historical Perspective.
Ardakani M. R. (2004). Ecology. Tehran University Press, 340p.
Ayalew A., Bekele T and Demissew S. (2006) The Undifferentiated Afromontane forest of Denkoro in the
central highland of Ethiopia: a floristic and structural analysis. SINET: Ethiop. J. Sci.29, 45–56.
Badege B (2001).Deforestation and land degradation in the Ethiopian highlands; a strategy for physical recovery.
North African studies. 8(1):7-26.
Bekele T. (2016) Review on Woody Plant Species of Ethiopian High Forests. Vol.27
Breshears D D,Cobb N S, Rich P M (2005).Regional vegetation dieback in response to global-change-type
drought. PNAS 102:15144-15148
Dikaso U, Tesema T(2016).Floristic Composition and Diversity of Woody Plant Species of Wotagisho Forest,
Boloso Sore Woreda, Wolaita Zone, Southwest, Ethiopia
Edwards S and Hedberg I.(1989). Flora of Ethiopia,Vol. 3.Addis Ababa and Asmara, Ethiopia and Uppsala,
Sweden.
FAO (2007).State of the World’s Forests, Forestry Department, 144
Farzam T and Mehrzad N (2014).Effects of slope aspect on woody species diversity and stand structure in
mountain Hyrcanian forests: 2(2): 151-156
FRA, (2015).Terms and definitions, Forest resources Assessment Working Paper, 180
Gairola S, Rawal RS &Todaria NP (2008) Forest vegetation pattern along an altitudinal gradient in sub-alpine
zone of West Himalaya, India. African of Plant Science 2(6):42–48
Gebremicael F, Kitessa H and Gemedo D (2013).Woody plants’ diversity, structural analysis and regeneration
status of Wof-Washa natural forest, North-east Ethiopia
Habru WOA (2012).North Wollo, ANRS, Annex P Report on damages resulted from Rainfall of 06/11/2002 to
17/12/2002 E.C.
Haile Y, Ensermu K, Tamrat B and Ermias L.(2008). Floristic Composition and Structure of the Dry
Afromontane Forest at Bale Mountains National Park, Ethiopia
Jafari SM, Akhani H (2008).Plants of jahan name protected area, golestan province, N. Iran. Pakistan Journal of
Botany, 40(4): 1533-1554.
Juying J, Panteleimon X, Jonathan M. (2015).Factors affecting distribution of vegetation types on abandoned
cropland in the hilly gullied loess plateau
Kent M and Coker P.(1992).Vegetation description and analysis a practical approach. John Wiley and Sons, New
York Károly RÉDEI, Irina VEPERDI
Koushik M,Bal K,Bk D(2015).Changes of woody species diversity, horizontal and vertical distribution of stems
across interior to outside within a primate.
Lomolino, MV. (2001).Elevation gradients of species-density: historical and prospective views. Global Ecology
& Biogeography 10:3-13
Magurran A. (1988) Ecological Diversity and Its Measurements. Chapman & Hall, London, 179 p.Maji zone,
southwestern,Ethiopia.MSc thesis;Addis Ababa University, Ethiopia.
Manette E and Robin L. (2014). Remnant Trees Affect Species Composition but Not Structure of Tropical
Second-Growth Forest.
Margules CR,Lemperiere RL,William PH(2007).Representing biodiversity:Data & procedures for identifying
priority areas for conservation.J. Biosein 27(Supp.21:309-326)
MEFCC (2016).Ethiopia’s Forest Reference level Submission to the UNFCCC.
Melese B, Wendawek A,(2016).Floristic Composition and Vegetation Structure of Woody
Species in Lammo Natural Forest in Tembaro Woreda,Kambata-Tambaro Zone, Southern Ethiopia
Mueller-Dombois, D.,and Ellenberge, H. (1974). Aims and Methods of Vegetation Ecology
(p. 304). New York, NY: John Wiley and Sons
Opium, C, Jacobi N, Coppersmith D. (2000) Height to diameter ratio as a competition index for young conifer
plantations in northern British Forest Ecol & Management 137: 245–252
Pappoe A, Armah F, Quay E, Wake P. and Buxton G (2010).Composition and stand structure of a tropical moist
14Advances in Life Science and Technology www.iiste.org
ISSN 2224-7181 (Paper) ISSN 2225-062X (Online)
Vol.66, 2018
semi deciduous forest in Ghana.Inters. J. Plant Sci., 1, 095-106..
Robert F and John R. (2014).Tropical Forest Management and Conservation of Biodiversity: an Overview.
Sandalow D.(2000). Protecting and conserving the world’s forests.
Shackelton,C.M (2000).Comparison of Plant Diversity in Protected and Communal Lands in Bushbuck ridge
Lower Savannah, South Africa. Biological Conservation 94, 273 – 285.
Shimelse M, (2007). Land policy and tenure insecurity in Habru district, northeastern Ethiopia Msc Thesis,
NorwegianUniversity of life sciences, Norway.
Simon S and Girma B (2004).Composition, structure and regeneration status of woody species in Dindin natural
forest, Southeast Ethiopia: An implication for conservation. Ethiopian Journal of biological sciences (1)3:
15-35.
Sisay N (2008).Ethiopian government efforts to increase forest cover: a policy oriented discussion paper.
Sorensen T.(1948).A method of establishing groups of equal amplitude in plant sociology based on similarity of
species content and its application to analyses of the vegetation on Danish commons. 5, 1–34.
Tesfaye T B, Demeke D, Shiferew B(2017).Structure and Natural Regeneration Status of Woody Plants of
Berbere Afromontane Moist Forest, Bale Zone, South East Ethiopia; Implication to Biodiversity
Conservation.
?????check the refernaces part
15You can also read