Effectiveness of an exercise based prehabilitation program for patients awaiting surgery for lumbar spinal stenosis: a randomized clinical trial ...
←
→
Page content transcription
If your browser does not render page correctly, please read the page content below
www.nature.com/scientificreports
OPEN Effectiveness of an exercise‑based
prehabilitation program
for patients awaiting surgery
for lumbar spinal stenosis:
a randomized clinical trial
Andrée‑Anne Marchand1*, Mariève Houle2, Julie O’Shaughnessy1,
Claude‑Édouard Châtillon3,4, Vincent Cantin5 & Martin Descarreaux5
Lumbar spinal stenosis is the most common reason for spine surgery in older adults, but the effects
of prehabilitation on perioperative outcomes among these patients have not been investigated.
This study aims to evaluate the effectiveness of a preoperative exercise-based intervention program
compared with usual care on the improvement of clinical status, physical capacities and postoperative
recovery of patients awaiting surgery for lumbar spinal stenosis. Sixty-eight participants were
randomised to receive either a 6-week supervised exercise-based prehabilitation program or hospital
usual care. The outcomes included both clinical and physical measures. Data collection occurred at
post-intervention, and 6 weeks, 3- and 6-months post-surgery. Significant but small improvements
were found in favour of the experimental group at the post-intervention assessment for pain intensity,
lumbar spinal stenosis-related disability, lumbar strength in flexion, low back extensor muscles
endurance, total ambulation time, and sit to stand performance. A significant difference in favor of the
intervention group was found starting at the 3-month postoperative follow-up for low back-related
disability. No adverse events were reported. Exercise-based prehabilitation did not improve short-
term postoperative recovery in patients with lumbar spinal stenosis.
As populations worldwide continue to grow older, increasing demand is to be expected on health care systems,
including surgery-related resources. The metabolic response that results from surgical procedures is character-
ized by changes in body composition, loss of muscle function and strength, decreased vasomotor control, and
sympathetic hyperactivity1,2. Considering that the extent of this response impacts postoperative recovery and
long-term outcomes, attempts to minimize it have become paramount for the perioperative t eams3,4.
The aging process is naturally associated with some degree of physical deconditioning5,6, which compromises
the physiologic reserve required to better withstand the stress of surgery7. Furthermore, loss of physiologic
reserve is aggravated by sedentary behavior that in turn contributes to negative consequences on functional
independence8. Physical exercise, including resistance and aerobic training, is part of the solution to attenuate
physical decline in older i ndividuals9,10. As such, interventions aimed at augmenting patients’ physiological fit-
ness prior to a surgical intervention to allow them to increase their metabolic reserve and retain a higher level
of functional capacity over their entire perioperative trajectory, are known as p rehabilitation8,11.
Most publications on prehabilitation pertain to life-threatening diseases and complex surgeries while the
body of evidence in the context of elective spine surgery remains scarce12–14. In a recent systematic review, Jans-
sen et al. reported on the effectiveness of prehabilitation in patients with degenerative disorders of the lumbar
spine15. Based on data from twelve interventions, the authors concluded that prehabilitation has no effect when
compared to usual care in patients undergoing lumbar spinal surgery. However, only one of the included studies
1
Department of Chiropractic, Université du Québec à Trois-Rivières, 3351 Boul. des Forges, Trois‑Rivières, QC G9A
5H7, Canada. 2Department of Anatomy, Université du Québec à Trois-Rivières, Trois‑Rivières, Canada. 3Centre
Intégré Universitaire de Santé et de Services Sociaux de la Mauricie-et-du-Centre-du-Québec, Trois‑Rivières,
Canada. 4Division of Neurosurgery, Faculty of Medicine, University of Montreal, Montréal, Canada. 5Department of
Human Kinetics, Université du Québec à Trois-Rivières, Trois‑Rivières, Canada. *email: andree-anne.marchand@
uqtr.ca
Scientific Reports | (2021) 11:11080 | https://doi.org/10.1038/s41598-021-90537-4 1
Vol.:(0123456789)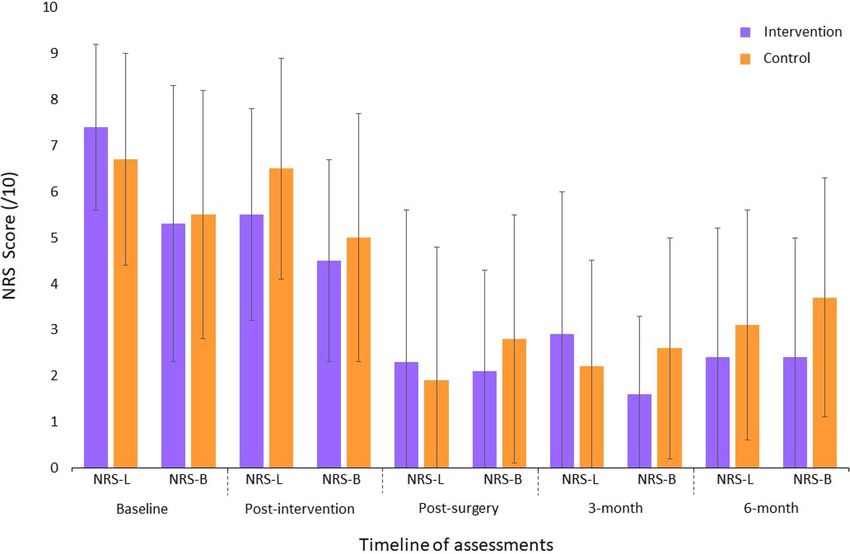
www.nature.com/scientificreports/
(with unclear risk of bias) looked at e xercise16, which was not enough to draw any conclusion regarding the
effectiveness of exercise-based p rehabilitation15.
Lumbar spinal stenosis (LSS) is one of the most frequent degenerative conditions in older-aged patients17 and
represents the main reason for undergoing surgery in adults over the age of 6518. It is hallmarked by neurogenic
claudication, causing high levels of disability, disrupting activities of daily leaving and leading to a more sedentary
lifestyle19. With as little as 4% of patients meeting the Canadian recommendations for physical activity20 and
considering that watchful-waiting is safe in this slowly progressing c ondition21, LSS may be best suited to study
the effect of prehabilitation prior to spine surgery.
Therefore, the aim of the study was to assess the effectiveness of an active exercise-based prehabilitation
programme compared to usual care in patients with LSS. It was hypothesized that patients in the intervention
group would have greater preoperative functional capacities, which would lead to faster post-operative recovery,
compared to the control group.
Methods
Study design. The study was a single-centre, parallel-group randomized controlled trial with an internal
pilot component. We previously conducted a pilot study to test the intervention, the choice of outcome meas-
ures, and to gather preliminary data. Given that the intervention was not modified between the pilot and the
main trial, the forty participants from the pilot study were included in the final analysis presented herein. The
trial was conducted at the Université du Québec à Trois-Rivières (UQTR) research facility, Canada. Enrollment
started in February 2015, with the last follow-up in February 2020. The trial protocol22 as well as the feasibility
and pilot results23 have been published elsewhere. The study received ethical approval from the institutional
review board of UQTR (CÉR-2014-008-00) and was registered in ClinicalTrials.gov (NCT02258672; October
7th, 2014). All methods were carried out in accordance with relevant guidelines and regulations. Informed writ-
ten consent was obtained from each participant prior to data collection.
Participants. We included individuals ≥ 18 years, diagnosed with degenerative LSS primarily of central ori-
gin (confirmed with matching clinical history and diagnostic imaging), awaiting surgery (minimally invasive or
open approach) and able to provide written informed consent voluntarily. Exclusion criteria included presence
of non-degenerative LSS, inflammatory arthritic conditions, vertebral instability requiring non-instrumental
or instrumented fusion and altered cognitive capacities; individuals deemed ineligible by their treating neuro-
surgeon; and being unable to understand or express oneself in French. All patients were recruited at the Centre
intégré universitaire de santé et de services sociaux de la Mauricie-et-du-Centre-du-Québec (Trois-Rivières’
regional hospital (Quebec, Canada)) in collaboration with the neurosurgery team. Neurosurgeons were respon-
sible for identifying eligible patients during outpatient clinical encounters. Patients meeting inclusion criteria
and interested in the study were asked for consent to be later contacted by a member of the research team.
Interventions. All participants, regardless of group allocation, received the day prior to surgery, standard-
ized written information on how to keep a good back posture when getting in or out of bed and when sitting
down after the surgery. That is the usual care provided by the hospital staff for all patients undergoing back
surgery.
Participants in the exercise group were offered individually supervised exercise sessions 3 times per week
for 6 weeks, prior to their surgery. Training sessions took place at the Université du Québec à Trois-Rivières
rehabilitation facility and were led by a certified kinesiologist. A typical training consisted of a 5-min warm-up
(stationary cycling or walking on a treadmill based on participants’ preference), followed by 25 min of exercises
with concentric or isometric phases that aimed to improve muscle and structures involved in walking capaci-
ties. Exercise intensity level was individually tailored to the participants’ capacity and progressively modified to
provide increasing levels of difficulty. For a full description of the exercise intervention, see previous r eports22,23.
Adherence to the exercise program was documented in the kinesiologist logbook. For each exercise, recorded
data include the number of sets, repetitions and levels of difficulty reached (1 being the lowest and 4 the highest
level of difficulty), perceived effort and location, intensity, and character of discomfort if any. Participants in the
control group were not discouraged from performing physical activity or exercise.
Outcomes. Sociodemographic data were collected via a structured interview and by self-reported question-
naires at baseline, with a trial researcher available to clarify questions if needed.
Treatment effect was assessed using both clinical patient-reported outcome measures and objective physical
tests. Clinical patient-reported outcome measures were collected at UQTR’s research facility at baseline, 6-week
from baseline (post-intervention), and 6 weeks post-surgery, and by post at 3- and 6-month post-surgery. Physical
outcome measures were collected at UQTR’s research facility at baseline, after 6 weeks prehabilitation interven-
tion, and 6 weeks post-surgery.
Primary outcome measures were current low back and leg pain intensity (11-point Numerical Rating Scale)24,
and low back-related disability (Oswestry Disability Index)25.
Secondary outcome measures included quality of life (EuroQol-5D)26, fear avoidance behavior (Tampa Scale
of Kinesiophobia)27, level of anxiety and depression (Beck Disability Index)28, patient perception of treatment
effect (7-point scale Patient Global Impression of Change29—measured at the post-intervention assessment only),
lumbar extensor muscles endurance (modified Sorensen test)30, trunk flexor and extensor muscle strength (iso-
metric contraction)31, knees extensor muscle strength (isometric contraction)32, active lumbar ranges of m
otion33,
and walking abilities (time to first symptoms and total ambulation time). Lastly, perioperative data including
blood loss, length of surgery, surgical technique used, intraoperative complications, and length of hospital stay
Scientific Reports | (2021) 11:11080 | https://doi.org/10.1038/s41598-021-90537-4 2
Vol:.(1234567890)
www.nature.com/scientificreports/
were documented as potential explanatory factors of between group differences in recovery. The study protocol
provides further information about the selected o utcomes22.
23
Based on results from the pilot s tudy , physical tests better reflecting patients’ activities of daily living were
deemed necessary to capture functional capacities as oppose to physiological changes to exercise. As such, in the
main trial, we included the 30 s sit-to-stand34 and the timed up and go35 tests that allowed for the measurement
of progress regarding balance, sit to stand, and short-distance walking capacities. In addition, in response to the
participants comment that the ODI did not completely capture their daily challenges we also added the French
Swiss Spinal Stenosis q uestionnaire36 to measure LSS-related disability. These newly collected outcomes are avail-
able for the latest recruited participants only (15 and 13 from the intervention and control group respectively).
Sample size. The sample size calculation for the main trial was conducted using the pilot study’s means and
standard deviations for leg pain intensity23 (measured after the 6-week prehabilitation intervention), assuming
a one-tailed test and considering a significance level of p = 0.01, a power of 90%, and a 20% attrition rate. An
estimated 36 patients per treatment arm were required to detect a significant between-group difference.
Randomization and blinding. Randomisation and minimization were performed after the baseline
assessment using a computer random number generator, prepared by a research assistant not involved in the
study process. Allocation concealment was ensured using sequentially numbered, opaque and sealed envelopes.
The envelopes were opened in front of the participants by the main investigator after enrollment. Participants
were not blinded to intervention allocation, but to prevent cross-contamination between groups content of exer-
cise sessions was known only to those in the intervention group. Further details about randomisation, minimiza-
tion and blinding are published elsewhere22,23.
Statistical methods. For between-group comparisons of demographic and perioperative data, the inde-
pendent Student t test for continuous variables and the chi-square test for categorical variables were used. Mixed
model ANOVAs were used for group comparison over time and Bonferroni post hoc tests were conducted
whenever necessary. Based on observations from the pilot study during which a significant effect of surgery
was observed for primary clinical o utcomes23, the analyses were first conducted using the baseline and post-
intervention data, and then the post-intervention and follow-ups data together. Whenever baseline variables
did not follow normal distribution using the Shapiro–Wilk test, appropriate transformations were applied in
order to conduct parametric statistics. Analyses of primary and secondary outcomes were conducted accord-
ing to the intention-to-treat principle with participants analyzed according to randomly assigned treatment
group irrespective of compliance. Missing data (mean number = 19.1% per table) were replaced using multiple
imputation regression modeling methods and an aggregate of 1000 imputed data sets was used to conduct the
analysis of variance. All analyses were conducted in SPSS Statistics version 25.0. (IBM, Armonk, NY). The level
of significance was set to 0.05.
Results
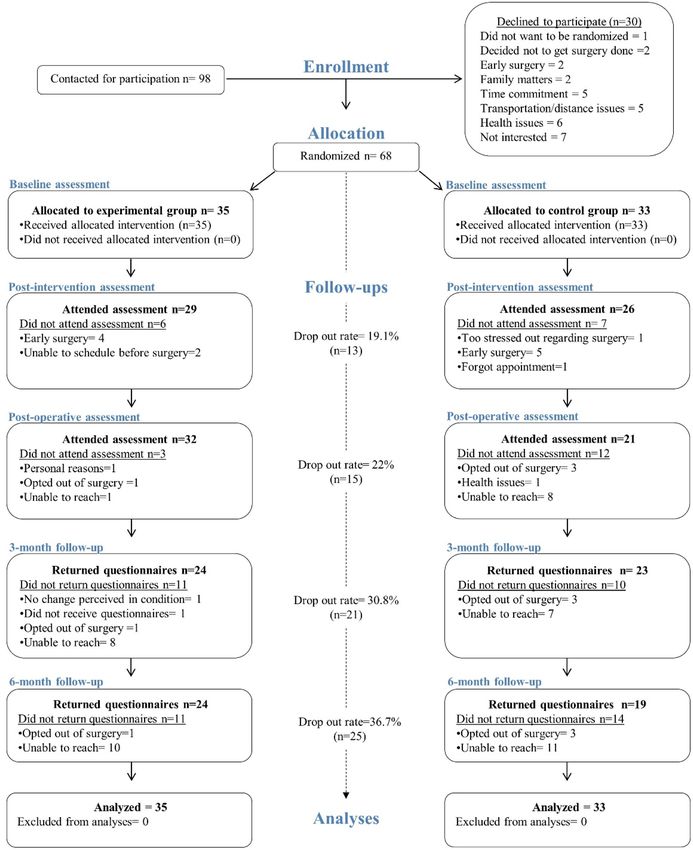
Recruitment. Between February 2015 and June 2019, a total of 98 eligible patients were contacted, of whom
68 agreed to participate and were randomly assigned to the intervention (n = 35) or control group (n = 33). Due
to the long follow-up period and a much lower patient load during summer months for the neurosurgeons, it
was decided to stop the recruitment prematurely, with 94% of the recruitment goal achieved. Figure 1 presents
participants flow in the study along with reasons for non-participation and attrition.
Baseline data. There was no significant difference between the groups with respect to baseline characteris-
tics except for age which was lower (p = 0.01) in the intervention group. Table 1 presents the baseline character-
istics for all participants.
Participants’ adherence to intervention. A total of 14 participants completed all 18 training sessions
as planned (40% compliance) whereas 17 completed more than 50% of sessions (range 10–17), and 4 less than
50% (range 2–7). Considering that the intervention period was shortened for some participants due to the vari-
able rate of surgical operation for elective surgeries, we can consider that a maximum of 569 sessions could be
provided to participants yielding a compliance rate of 90.3% (288/569) with a mean of 14.7 sessions provided per
participant. Assessment of physical activities performed outside of the study protocol at the post-intervention
assessment was similar in both groups (p = 0.39) with 8 and 10 participants reporting being active in the inter-
vention and control group respectively. (Results based on 29 individuals in the intervention group and 26 in the
control group). Types of physical activity included treadmill or outdoor walking, stationary or outdoor cycling,
snowshoeing, fall risk prevention program, and performing the prehabilitation exercises on off days.
Participants’ adherence to surgical plan. Out of the 68 enrolled participants, 4 did not undergo sur-
gery as planned. All 3 individuals from the control group opted out because the risks associated with the surgery
were perceived as too high given their advanced age or concomitant health issues. The one individual that opted
out of surgery in the intervention group did so in accordance with the neurosurgeon’s opinion that her func-
tional status had improved beyond surgical candidacy. In total 64 participants underwent lumbar laminectomy/
laminotomy over the course of the study and none underwent a revision surgery within the 6-month follow-up.
Scientific Reports | (2021) 11:11080 | https://doi.org/10.1038/s41598-021-90537-4 3
Vol.:(0123456789)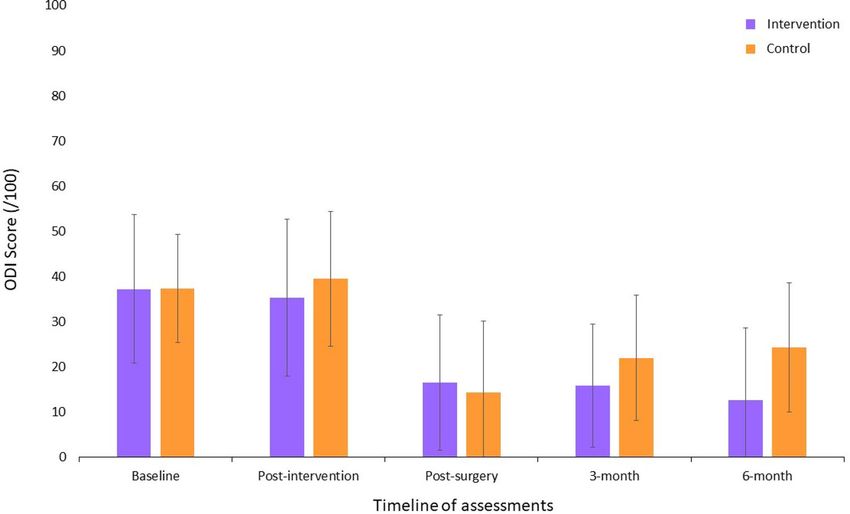
www.nature.com/scientificreports/
Figure 1. CONSORT flowchart of the randomized controlled trial.
Outcomes and estimation of intervention effect. Results of analyses conducted using preoperative
data. Significant Group × Time interactions were found between the baseline and the preoperative assessments
in favor of the intervention group for leg pain intensity (F1,66 = 4.63, p = 0.03, ηp2 = 0.07); LSS-related disabil-
ity (F1,25 = 4.48, p = 0.04, ηp2 = 0.15); maximum lumbar strength in flexion ( F1,66 = 5.15, p = 0.02, ηp2 = 0.07); low
back extensor muscles endurance ( F1,63 = 6.67, p = 0.002, ηp2 = 0.15); total ambulation time ( F1,64 = 5.63, p = 0.02,
ηp2 = 0.08); and sit to stand ( F1,25 = 7.02, p = 0.01, ηp2 = 0.22). Figures 2, 3 and 4 present between group compari-
sons of low back related disability, leg and back pain intensity and walking capacities respectively.
Results of analyses conducted using postoperative data. The only significant Group × Time interaction found
in the postoperative period, was for low back-related disability in favor of the intervention group (F2,132 = 6.20,
p = 0.003, ηp2 = 0.06) with the largest difference being at 6 months. Means, standard deviations and 95% con-
Scientific Reports | (2021) 11:11080 | https://doi.org/10.1038/s41598-021-90537-4 4
Vol:.(1234567890)www.nature.com/scientificreports/
Intervention (N = 35) Control (N = 33)
Mean ± SD Mean ± SD p
Demographics
Age—years 66.2 ± 9.6 71.6 ± 7.6 0.01*
Gender, female—n (%) 14 (40) 14 (42) 0.83
BMI 29.0 ± 5.2 28.9 ± 5.2 0.90
Weight—kg 81.3 ± 16.5 82.7 ± 19.1 0.74
Height—cm 169.9 ± 11.7 166.2 ± 10.0 0.16
Minimisation criteria
Diabetes—n (%) 4 (11) 7 (21) 0.27
Positive EMG findings—n (%) 7 (20) 3 (9) 0.20
ODI score ≥ 41%—n (%) 14 (40) 9 (27) 0.26
Smoker—n (%) 2 (5) 1 (3) 0.59
Employment situation—n (%) 0.39
Currently working 3 (8.6) 5 (15.2)
Sick leave or retired due to pain 11 (31.4) 5 (15.2)
Retired unrelated to pain 21(60) 23 (69.6)
Work satisfaction—/100a 83.8 + 7.5 86.2 ± 10.9 0.49
Operated vertebral segment(s)
1 level 18 (53%) 16 (53%) 0.97
2 levels 8 (24%) 8 (27%) 0.77
3 levels 7 (20%) 6 (20%) 0.95
4 levels 1 (3%) 0 (0%) –
Primary outcomes
Leg pain intensity—/10 7.4 ± 1.8 6.7 ± 2.3 0.16
Secondary outcomes
Clinical outcomes
Back pain intensity—/10 5.3 ± 3.0 5.5 ± 2.7 0.77
Leg pain dominant—n (%) 27 (77) 22 (66) 0.33
Weekly days with pain—(/7) 6.9 ± 0.1 6.9 ± 0.3 0.62
Back disability—/100 37.2 ± 16.4 37.4 ± 11.9 0.93
Kinesiophobia—/68 47.4 ± 8.0 45.2 ± 7.7 0.24
Depression—/63 4.4 ± 5.0 4.7 ± 4.1 0.79
Physical outcomes
Lumbar active ROMs—degrees
Flexion 66.0 ± 25.1 67.2 ± 20.8 0.84
Extension 14.4 ± 7.0 14.4 ± 5.4 0.99
Left lateral flexion 13.0 ± 7.3 12.0 ± 6.1 0.58
Right lateral flexion 13.8 ± 7.9 13.7 ± 6.8 0.97
Trunk muscles strength—N m
Flexion 46.2 ± 23.4 44.1 ± 28.1 0.66
Extension 33.2 ± 28.8 28.4 ± 24.2 0.47
Right knee extensor strength—lbs 62.1 ± 31.7 60.7 ± 28.6 0.84
Left knee extensor strength—lbs 72.6 ± 27.3 75.6 ± 26.9 0.77
Lumbar extensor endurance—s 45.2 ± 59.9 38.7 ± 49.2 0.64
Walking capacities—s
Time to 1st symptoms 116.8 ± 87.4 97.4 ± 93.4 0.38
Total ambulation time 196.7 ± 94.0 190.0 ± 139.1 0.81
Newly added outcomesb
LSS disability—(/55) 39.5 ± 4.2 38.0 ± 4.2 0.40
Sit to stand—repetitions 9.6 ± 3.8 9.0 ± 2.7 0.65
Get up and go—s 8.3 ± 1.5 9.8 ± 3.8 0.23
Table 1. Participants’ baseline characteristics. EMG electromyography, ODI Oswestry disability index, LSS
lumbar spinal stenosis. *Statistically significant difference between groups. a Measured using the Minnesota
Satisfaction Questionnaire37, results based on 4 participants from the intervention group and 5 from the
control group (those employed or on sick leave at the time of the study). b For the newly added outcomes, 15
and 13 participants provided data from the intervention and control group respectively.
Scientific Reports | (2021) 11:11080 | https://doi.org/10.1038/s41598-021-90537-4 5
Vol.:(0123456789)www.nature.com/scientificreports/
Figure 2. Comparison of low back related disability (means ± SD) (Greater scores indicate greater disability;
ODI Oswestry disability index).
Figure 3. Comparison of leg and back pain intensity (means ± SD) (Greater scores indicate greater pain
intensity; NRS-L numerical rating scale for leg pain intensity, NRS-B numerical rating scale for low back pain
intensity).
fidence intervals for each group are presented based on clinical and physical outcomes for all time points in
Tables 2 and 3 respectively.
Quality of life. Changes in quality of life were assessed by comparing the proportions of individuals from
each group that reported an improvement in each of the questionnaire 5 dimensions. No between group signifi-
cant difference was found at any of the assessment timepoints (all ps > 0.05).
Participants’ perceived change in global status. At the preoperative assessment, participants in the
intervention group reported greater positive change in their global status (mean ± SD: 2.9 ± 1.3) compared to
the control group (4.5 ± 1.0). Sixty-nine per cents reported that their status had “improved” (= very much better,
much better, or slightly better) in the intervention group compared to 11.5% in the control group (p < 0.001).
Scientific Reports | (2021) 11:11080 | https://doi.org/10.1038/s41598-021-90537-4 6
Vol:.(1234567890)www.nature.com/scientificreports/
Figure 4. Comparison of walking capacities (means ± SD) (Greater scores indicate better walking capacities; 1st
Sx walking time to first symptoms).
Similarly, 13% percent reported that their status had “worsened” (= very much worse, much worse, or slightly
worse) in the intervention group compared with 46% in the control group (p < 0.01).
Participants’ satisfaction. Thirty-one participants provided an objective evaluation of their overall satis-
faction with the intervention program. The mean satisfaction score (mean ± SD) reached 94.4% ± 8.3. Both groups
provided similar satisfaction rates with regards to postoperative back pain outcome with a score (mean ± SD) of
84.4% ± 22.2 for the intervention group and of 84.0% ± 22.5 for the control group (p = 0.23). Satisfaction rates for
postoperative leg pain outcome were also similar with 82.3% ± 23.4 in the intervention group and 84.6% ± 23.9
in the control group (p = 0.34).
Intraoperative data. Intraoperative measures and length of hospital stay were similar in both groups.
Results are presented in Table 4.
Harms. At no point in time were adverse events reported as a result of either the training program or physical
assessments.
Discussion
The aim of the present study was to assess the effectiveness of an exercise-based prehabilitation program, com-
pared to usual care, on improving preoperative capacities, and postoperative recovery in patients with lumbar
spinal stenosis. The results showed improvements in both self-reported clinical and objective physical outcomes
at the post-intervention assessment in favor of the prehabilitation group. However, theses differences were not
maintained after the surgery. As such, in the postoperative phase, back-related disability was the only param-
eter that followed distinct trajectories between groups, with improvements seen in the intervention group and
deteriorations seen in the control group, over the 6-month follow-up.
Clinical significance. The within group differences observed in the intervention group after the preha-
bilitation intervention were clinically significant for decreased leg pain intensity38 (− 1.9 point), LSS-related
disability38 (− 4.5 points), and the sit-to-stand test39 (+ 2.4 repetitions) (major clinically important improvement
determined from patients with hip osteoarthritis ≥ 2). To the best of our knowledge no minimal clinically impor-
tant difference has been determined for maximum isometric flexor strength and trunk extensor endurance. We
noted a 13.7% increase in trunk flexor strength (+ 6.4 Nm) and a 45% improvement in low back extensor endur-
ance (+ 20.5 s) from baseline. On the other hand, improvement in total ambulation time (+ 34.9 s = 17.7%) did
not reach the proposed 30% threshold for clinical significance40.
The between group differences identified for low back extensor endurance (+ 47.8 s = 267.0% increase) and
total ambulation time (+ 85.4 s = 58.4% increase) correspond to a large and medium effect size, r espectively41.
Scientific Reports | (2021) 11:11080 | https://doi.org/10.1038/s41598-021-90537-4 7
Vol.:(0123456789)www.nature.com/scientificreports/
Intervention group Control group
Mean + SD (95% Mean + SD (95% Main effect of Main effect of Group × time
Variable N CI) N CI) time (p) group (p) interaction (p)
Back pain intensity/10
Baseline 35 5.4 ± 3.0 (4.3 to 6.4) 33 5.6 ± 2.7 (4.6 to 6.5)
0.09 0.69 0.91
Post-intervention 29 4.5 ± 2.2 (3.6 to 5.3) 26 5.0 ± 2.7 (3.9 to 6.1)
Post-surgery 32 2.1 ± 2.2 (1.3 to 2.9) 21 2.8 ± 2.7 (1.5 to 3.9)
3 months 24 1.6 ± 1.7 (0.9 to 2.3) 23 2.6 ± 2.4 (1.5 to 3.6) 0.01 0.17 0.90
6 months 24 2.4 ± 2.6 (1.3 to 3.5) 19 3.7 ± 2.6 (2.4 to 4.9)
Leg pain intensity/10
Baseline 35 7.4 ± 1.9 (6.8 to 8.1) 33 6.7 ± 2.4 (5.9 to7.6)
0.001 0.76 0.03
Post-intervention 29 5.5 ± 2.3 (4.6 to 6.4) 26 6.5 ± 2.4 (5.5 to 7.4)
Post-surgery 32 2.3 ± 3.3 (1.1 to 3.5) 21 1.9 ± 2.9 (0.6 to 3.2)
3 months 24 2.9 ± 3.1 (1.6 to 4.3) 23 2.2 ± 2.3 (1.2 to 3.2) 0.11 0.99 0.30
6 months 24 2.4 ± 2.8 (1.2 to 3.6) 19 3.1 ± 2.5 (1.8 to 4.3)
LSS disability/55 or 79*
39.5 ± 4.3 (36.6 to 38.0 ± 4.2 (35.5 to
Baseline 15 13
42.4) 40.6)
0.005 0.47 0.04
35.0 ± 7.9 (28.9 to 37.5 ± 6.5 (32.1 to
Post-intervention 9 8
41.0) 42.9)
29.6 ± 8.5 (24.5 to 28.5 ± 10.6 (17.4
Post-surgery* 13 6
34.7) to 39.6)
37.9 ± 10.2 (29.3 to 39.2 ± 14.4 (24.0
3 months* 8 6 0.27 0.72 0.83
46.4) to 54.3)
30.5 ± 10.1 (22.7 to 45.0 ± 21.6 (8.8 to
6 months* 9 3
38.4) 78.8)
Back disability/100
37.2 ± 16.5 (32.5 to 37.5 ± 11.9 (33.2
Baseline 35 33
42.9) to 41.7)
0.95 0.29 0.12
35.3 ± 17.4 (28.7 to 39.5 ± 14.9 (33.5
Post-intervention 29 26
41.9) to 45.5)
16.5 ± 15.0 (11.0 to 14.3 ± 15.8 (7.1 to
Post-surgery 32 21
22.0) 21.5)
15.8 ± 13.6 (10.1 to 22.0 ± 13.9 (15.9
3 months 24 23 0.02 0.36 0.003
21.6) to 28.0)
12.7 ± 16.0 (6.1 to 24.3 ± 14.3 (17.6
6 months 24 19
19.4) to 31.0)
Kinesiophobia/68
47.5 ± 8.1 (44.7 to 45.2 ± 7.7 (42.5 to
Baseline 35 33
50.3) 47.9)
0.74 0.90 0.02ǂ
44.2 ± 7.7 (41.3 to 47.6 ± 8.0 (44.4 to
Post-intervention 29 26
47.1) 50.8)
38.2 ± 8.9 (35.0 to 38.9 ± 9.3 (34.7 to
Post-surgery 32 21
41.4) 43.2)
37.9 ± 7.8 (34.7 to 41.3 ± 7.3 (38.1 to
3 months 24 23 0.47 0.48 0.78
41.1) 44.5)
37.6 ± 7.6 (34.5 to 40.4 ± 10.7 (35.5
6 months 24 19
40.7) to 45.3)
Depression/63
Baseline 35 4.4 ± 5.1 (2.7 to 6.2) 33 4.7 ± 4.2 (3.2 to 6.2)
0.42 0.28 0.97
Post-intervention 29 4.3 ± 5.3 (2.3 to 6.3) 26 5.3 ± 5.2 (3.2 to 7.3)
Post-surgery 32 2.0 ± 3.4 (0.8 to 3.3) 21 1.8 ± 3.1 (0.4 to 3.3)
3 months 24 2.7 ± 3.5 (1.3 to 4.2) 23 3.9 ± 4.6 (1.9 to 5.9) 0.009 0.87 0.87
6 months 24 1.7 ± 2.0 (0.8 to 2.5) 19 3.4 ± 3.3 (1.9 to 4.9)
Table 2. Results for clinical outcome measures. SD standard deviation, CI confidence interval. *LSS-
related disability measured using the Swiss Spinal Stenosis Questionnaire—maximum score at baseline
and post-intervention assessments is 55 (includes symptoms and function subscales) and maximum score
at postoperative, 3-month and 6-month assessments is 79 (includes symptoms, function and satisfaction
subscales). ǂ The Group × Time interaction term was statistically significant but post-hoc analysis using
Bonferroni test revealed no significant within or between group differences. Bold indicate a significant intra-
group change from baseline (for analyses conducted between baseline and post-intervention assessments)
or intra-group change from post-surgery (for analyses conducted between post-surgery and follow-ups
assessments).
Scientific Reports | (2021) 11:11080 | https://doi.org/10.1038/s41598-021-90537-4 8
Vol:.(1234567890)www.nature.com/scientificreports/
Intervention group Control group
Group × time interaction
Variable N Mean + SD (95% CI) N Mean + SD (95% CI) Main effect of time (p) Main effect of group (p) (p)
Trunk muscles strength N m
Flexion
Baseline 35 46.8 ± 23.4 (38.7 to 54.9) 33 44.1 ± 28.1 (33.7 to 54.3)
0.02 0.16 0.03
Post-intervention 29 53.2 ± 24.8 (43.4 to 63.1) 26 42.1 ± 26.1 (30.5 to 53.7)
Post-surgery 32 54.4 ± 28.5 (43.1 to 65.7) 21 50.1 ± 27.8 (37.9 to 63.9) 0.32
Extension
Baseline 35 32.8 ± 29.2 (22.8 to 42.9) 33 26.7 ± 26.3 (17.2 to 36.2)
0.004 0.21 0.51
Post-intervention 29 57.0 ± 61.0 (32.4 to 81.6) 26 26.3 ± 26.7 (14.1 to 38.5)
Post-surgery 32 46.4 ± 41.3 (29.8 to 63.1) 21 48.5 ± 40.0 (29.2 to 67.8) 0.85
Lumbar active ROMs (degrees)
Flexion
Baseline 35 66. 0 ± 25.2 (56.9 to 75.1) 33 67.2 ± 20.9 (59.1 to 75.3)
0.69 0.72 0.15
Post-intervention 29 68.6 ± 27.2 (57.6 to 79.6) 26 62.3 ± 25.8 (50.6 to 74.0)
Post-surgery 32 68.8 ± 17.6 (61.9 to 75.8) 21 72.9 ± 19.4 (63.6 to 82.3) 0.45
Extension
Baseline 35 14.4 ± 7.1 (11.7 to 17.2) 33 14.4 ± 5.5 (12.0 to 16.8)
0.28 0.10 0.05
Post-intervention 29 16.8 ± 6.9 (13.9 to 19.7) 26 12.7 ± 7.1 (9.4 to 15.9)
Post-surgery 32 17.7 ± 6.7 (15.1 to 20.4) 21 15.2 ± 5.9 (12.4 to 18.0) 0.15
Left lateral flexion
Baseline 35 13.0 ± 7.3 (10.4 to 15.7) 33 12.1 ± 6.2 (9.7 to 14.5)
0.97 0.30 0.37
Post-intervention 29 14.1 ± 8.8 (10.6 to 17.6) 26 10.6 ± 5.3 (8.2 to 13.0)
Post-surgery 32 13.5 ± 5.7 (11.3 to 15.8) 21 12.8 ± 5.4 (10.2 to 15.4) 0.63
Right lateral flexion
Baseline 35 13.8 ± 7.9 (10.9 to 16.7) 33 13.8 ± 6.8 (11.1 to 16.4)
0.26 0.65 0.29
Post-intervention 29 13.2 ± 8.2 (9.9 to 16.4) 26 11.2 ± 5.5 (8.7 to 13.7)
Post-surgery 32 14.4 ± 6.6 (11.8 to 17.1) 21 15.3 ± 7.9 (11.5 to 19.1) 0.75
Right knee extensors strength—lbs
Baseline 35 62.2 ± 31.7 (51.3 to 73.1) 33 60.5 ± 28.7 (50.6 to 70.9)
0.45 0.20 0.54
Post-intervention 29 65.6 ± 29.9 (53.5 to 77.7) 26 54.2 ± 31.5 (41.2 to 67.2)
Post-surgery 32 75.7 ± 37.6 (61.7 to 89.8) 21 62.4 ± 28.3 (49.5 to 75.3) 0.49
Left knee extensors strength—lbs
Baseline 35 72.6 ± 27.3 (55.3 to 89.9) 33 75.6 ± 26.9 (60.1 to 91.2)
0.45 0.54 0.20
Post-intervention 29 75.4 ± 26.2 (55.3 to 95.5) 26 69.3 ± 31.9 (46.5 to 92.1)
Post-surgery 32 87.5 ± 24.4 (72.8 to 102.3) 21 80.7 ± 27.4 (55.3 to 106.0) 0.30
Lumbar extensors endurance—s
Baseline 32 45.2 ± 59.9 (23.6 to 66.8) 30 38.8 ± 49.2 (20.4 to 57.1)
0.61 0.14 0.002
Post-intervention 27 65.7 ± 65.6 (39.8 to 91.7)* 23 17.9 ± 35.8 (2.4 to 33.4)*
Post-surgery 30 69.5 ± 59.2 (47.4 to 91.6) 21 57.3 ± 60.5 (29.8 to 84.8) 0.88
Walking capacities—s
Time to 1st symptoms
Baseline 35 116.8 ± 87.4 (86.8 to 146.8) 33 97.4 ± 93.4 (63.1 to 131.7)
0.44 0.01 0.08
Post-intervention 29 158.8 ± 102.4 (119.8 to 197.7) 25 79.4 ± 87.4 (43.3 to 115.4)
Post-surgery 30 223.1 ± 106.5 (182.6 to 263.6) 21 199.6 ± 122.8 (143.7 to 255.5) 0.39
Total ambulation time
Baseline 35 196.8 ± 94.0 (163.9 to 229.6) 33 190.1 ± 139.1 (139.9 to 240.2)
146.3 ± 104.7 (103.1 to 0.81 0.03 0.02
Post-intervention 29 231.7 ± 92.2 (195.9 to 267.5)* 25
189.5)*
Post-surgery 30 262.2 ± 78.5 (232.3 to 292.0) 21 262.0 ± 78.1 (226.5 to 297.6) 0.85
Continued
Scientific Reports | (2021) 11:11080 | https://doi.org/10.1038/s41598-021-90537-4 9
Vol.:(0123456789)www.nature.com/scientificreports/
Intervention group Control group
Group × time interaction
Variable N Mean + SD (95% CI) N Mean + SD (95% CI) Main effect of time (p) Main effect of group (p) (p)
Get up and go—s
Baseline 15 8.8 ± 1.7 (7.7 to 9.9) 13 10.2 ± 4.1 (7.7 to 12.7)
0.007 0.15 0.12
Post-intervention 9 7.5 ± 1.9 (6.0 to 8.9) 8 9.7 ± 2.6 (7.7 to 11.7)
Post-surgery 13 6.7 ± 1.3 (5.9 to 7.5) 6 8.0 ± 2.7 (5.2 to 10.9) 0.09
Sit to stand—repetitions
Baseline 15 9.7 ± 3.8 (7.2 to 12.1) 13 9.1 ± 2.7 (7.4 to 10.7)
0.001 0.14 0.01
Post-intervention 9 12.1 ± 3.6 (9.4 to 14.9) 8 8.4 ± 2.2 (6.8 to 10.1)
Post-surgery 13 11.8 ± 2.2 (10.4 to 13.1) 6 12.0 ± 2.1 (9.8 to 14.2) 0.89
Table 3. Results for physical outcome measures. SD standard deviation, CI confidence interval, ROM ranges
of motion. Bold indicate a significant intra-group change from baseline. *Denotes a significant between group
difference.
Intervention (n = 34) Control (n = 30)
Mean ± SD Mean ± SD p
Length of surgery (min) 101.3 ± 47.9 105.2 ± 57.8 0.77
Blood loss (ml) 213.4 ± 243.1 221.0 ± 226.3 0.90
Intraoperative complication (n) 0 2 –
Length of hospital stay (days) 4.1 ± 3.2 4.5 ± 2.0 0.58
Minimally invasive surgey (n) 11 8 0.62
Open surgery (n) 23 22 0.27
Received physiotherapy postoperatively (n) 3 3 0.87
Table 4. Perioperative data. Physiotherapy consisted of one hospital-based or home-based visit to ensure
adequate independency. The intraoperative complications were dural tears.
Comparison with other trials. As of today, only few publications have investigated the effectiveness of
prehabilitation interventions within the context of spine surgery. In the systematic review published in early
2021 by Janssen et al. a total of 15 studies were included, most of which (13/15) investigated cognitive behavioral
therapy. The authors concluded based on meta-analyses that there was very low to moderate quality evidence
that prehabilitation has no effect compared to usual care on physical functioning, leg and back pain intensity,
health-related quality of life, depression, anxiety, length of hospital stay, and analgesics use. The present trial adds
on to the review of Janssen et al. by being the first to report on adverse event related to both the prehabilitation
intervention and physical assessments. In addition, we did not exclude patients with multiple comorbidities or
with previous history of surgery and imposed no maximum age limit, which were identified as limitations in
previous studies.
Results of the present study somewhat contrast with the results previously reported by Nielsen et al.16 which
included greater function prior to surgery, and faster postoperative recovery and discharge from hospital in
favor of the intervention group compared to the standard care group. Their proposed intervention combined 6
to 8 weeks of preoperative daily individualized home training program, preoperative supplemental food intake,
and early in-hospital postoperative rehabilitation. In comparison, we decided to include only one aspect of the
recommended prehabilitation triad (exercise training, nutrition, and emotional wellbeing)6 in order to tease out
the effects of exercises alone given that evidence on how to best prepare for spine surgery is scarce. However,
there is evidence from studies investigating major surgeries that supports the use of multimodal interventions,
including modification of behavioural and lifestyle risk factors, to improve surgical outcome rather than solely
focusing on the underlying disease p rocess42. In addition, despite the fact that the focus of prehabilitation has
primarily been put on the optimisation of physical comorbidities, there is an increasing body of evidence that
emphasizes the role of preoperative psychological factors43 on both physical and psychological postoperative
outcomes. Likewise, patients with high-risks profiles, such as frailty and comorbidity, have been proposed to
be the ones that would most benefit from p rehabilitation44–46. Thus, pre-operative risk stratification taking into
account both modifiable and non-modifiable risk factors of poor surgical outcome and complications would
allow to tailor prehabilitation interventions to the patients’ needs and c apacities42,47. Nevertheless, such endeavour
to optimize patients’ preoperative status requires multidisciplinary input and substantial resources to ensure
proper monitoring.
Strengths and limitations. Considering the limited available evidence on the effect of prehabilitation
interventions within the context of spine surgery, the results of the present study should be interpreted with
caution. Among its strengths, the study followed a randomised, controlled design and complied with the related
Consolidated Standards of Reporting Trials guideline. Furthermore, the proposed intervention could be suited
Scientific Reports | (2021) 11:11080 | https://doi.org/10.1038/s41598-021-90537-4 10
Vol:.(1234567890)www.nature.com/scientificreports/
to individual participants’ level of physical capacities and no substantial protocol modifications were required
to accommodate day-to-day variation in patients’ symptomatology. The intervention was also delivered by a
single certified kinesiologist to decrease the probability of a clinician effect and avoid inter-clinician variations.
Of importance, the study reflects a pragmatic approach to rehabilitation intervention within the Quebec public
health care system, characterized by the variable intervention length based on the surgical waitlist. Participating
individuals came from both Trois-Rivières and its surrounding areas, which allows to infer the results to other
Canadian provinces with comparable public health care system. However, the results cannot be extrapolated to
patients with spinal instability or primary foraminal stenosis. Based on the collaborating neurosurgeons’ experi-
ence, patients requiring fusion surgery (instrumented or not) or foraminotomy would undergo more complex
procedures and have different recovery pathways and were therefore not included in the study. With regards to
the methods, missing data were dealt with using multiple imputations so that reasonable power could be main-
tained when conducting the statistical analyses.
In contrast, the study also has limitations, of which the first one is the use of the pilot study data. Although
using data from pilot study to conduct sample size estimate is widely debated in the literature, there was no
pooled results available at the time the study was c onducted48. In addition, estimating variance from a small
pool of data may inflate the type I error rate when conducting the main study49. Also, it will not be possible in
future meta-analysis to use the data from both the pilot study and the main trial because the data of pilot study
have been included in the main study and are no longer independent.
Similarly, the fact that the sample size fell short of the targeted number at enrollment combined with a high
drop out rate increased data heterogeneity which limits the power for some of the analyses. On the one hand,
recruitment was hampered by self-perceived health-related barriers and transportation issues. To have provided
education at the time of recruitment with regards to the benefits of being active, beyond study purposes, could
have improved participation rate47. Likewise, to have offered the option to perform the exercise program at
home, in the instance where it could be done safely without supervision, could have facilitated r ecruitment50.
On the other hand, the decision to prematurely stopped recruitment due to unforeseen organizational and time
constraints at the local hospital which significantly limited the referral pathway from the neurosurgery unit also
played a role in having a small final sample size.
With regards to limitations in the conduct of the study, the principal investigator was not blind to partici-
pants’ group allocation while conducting the assessments, which may have led to measurement bias. Finally,
considering that adding outcomes after the pilot phase of the study resulted in fewer than half of the participants
providing data (Swiss Spinal Stenosis questionnaire, get up and go test, and sit to stand test) which greatly limit
their interpretation, these results should be viewed as preliminary.
Overall, the current body of evidence on the effectiveness of prehabilitation program designed for spine sur-
gery is less robust than that of other surgical contexts and appears to be less promising. Considering that patients
awaiting elective surgery may have longer preoperative windows and, for some, lesser complex clinical profiles
than those awaiting non-elective surgery, preoperative interventions may play a different role than augmenting
fitness for surgery. As such, many of the participants in the present study did not seek conservative care prior to
undergoing surgery. Given that for patients with stable clinical status, a trial of conservative care is recommended
prior to surgical management51, preoperative interventions may be beneficial in terms of clinical improvements
and allow to better detect those for whom surgery is necessary to regain satisfactory functional capacities.
Conclusion
The main objective of the present study was to evaluate the effectiveness of a 6-week preoperative exercise-based
program, compared to usual care, in patients awaiting elective surgery for LSS. Our findings suggest that while
the intervention yielded improvements on clinical status and physical capacities preoperatively, it was insufficient
to foster a more rapid shot-term postoperative recovery. Tailored prehabilitation based on stratification of high-
risk patient profiles coupled with education should make the object of future studies looking at preoperative
intervention in the context of spinal surgery.
Received: 11 December 2020; Accepted: 12 May 2021
References
1. Carli, F., Bessissow, A., Awasthi, R. & Liberman, S. Prehabilitation: Finally utilizing frailty screening data. Eur. J. Surg. Oncol. 46,
321–325. https://doi.org/10.1016/j.ejso.2020.01.001 (2020).
2. Schricker, T. et al. Parenteral nutrition and protein sparing after surgery: Do we need glucose?. Metab. Clin. Exp. 56, 1044–1050.
https://doi.org/10.1016/j.metabol.2007.03.013 (2007).
3. Kehlet, H. & Wilmore, D. W. Evidence-based surgical care and the evolution of fast-track surgery. Ann. Surg. 248, 189–198. https://
doi.org/10.1097/SLA.0b013e31817f2c1a (2008).
4. Ljungqvist, O., Scott, M. & Fearon, K. C. Enhanced recovery after surgery: A review. JAMA Surg. 152, 292–298. https://doi.org/
10.1001/jamasurg.2016.4952 (2017).
5. Hawkins, S. A. & Wiswell, R. A. Rate and mechanism of maximal oxygen consumption decline with aging. Sports Med. 33, 877–888.
https://doi.org/10.2165/00007256-200333120-00002 (2003).
6. Carli, F. & Ferreira, V. Prehabilitation: A new area of integration between geriatricians, anesthesiologists, and exercise therapists.
Aging Clin. Exp. Res. 30, 241–244. https://doi.org/10.1007/s40520-017-0875-8 (2018).
7. Carli, F. & Zavorsky, G. S. Optimizing functional exercise capacity in the elderly surgical population. Curr. Opin. Clin. Nutr. Metab.
Care 8, 23–32. https://doi.org/10.1097/00075197-200501000-00005 (2005).
8. Topp, R., Ditmyer, M., King, K., Doherty, K. & Hornyak, J. 3rd. The effect of bed rest and potential of prehabilitation on patients
in the intensive care unit. AACN Clin. Issues 13, 263–276 (2002).
9. Carli, F. & Scheede-Bergdahl, C. Prehabilitation to enhance perioperative care. Anesthesiol. Clin. 33, 17–33. https://doi.org/10.
1016/j.anclin.2014.11.002 (2015).
Scientific Reports | (2021) 11:11080 | https://doi.org/10.1038/s41598-021-90537-4 11
Vol.:(0123456789)www.nature.com/scientificreports/
10. Puts, M. T. E. et al. Interventions to prevent or reduce the level of frailty in community-dwelling older adults: A scoping review of
the literature and international policies. Age Ageing 46, 383–392. https://doi.org/10.1093/ageing/afw247 (2017).
11. Carli, F. & Ferreira, V. Prehabilitation: A new area of integration between geriatricians, anesthesiologists, and exercise therapists.
Aging Clin. Exp. Res. https://doi.org/10.1007/s40520-017-0875-8 (2018).
12. Treanor, C., Kyaw, T. & Donnelly, M. An international review and meta-analysis of prehabilitation compared to usual care for
cancer patients. J. Cancer Surviv. Res. Pract. 12, 64–73. https://doi.org/10.1007/s11764-017-0645-9 (2018).
13. Santa Mina, D. et al. Effect of total-body prehabilitation on postoperative outcomes: A systematic review and meta-analysis. Physi-
otherapy 100, 196–207. https://doi.org/10.1016/j.physio.2013.08.008 (2014).
14. Gometz, A. et al. The effectiveness of prehabilitation (prehab) in both functional and economic outcomes following spinal surgery:
A systematic review. Cureus 10, e2675. https://doi.org/10.7759/cureus.2675 (2018).
15. Janssen, E. R. C. et al. Current prehabilitation programs do not improve the postoperative outcomes of patients scheduled for
lumbar spine surgery: A systematic review with meta-analysis. J. Orthop. Sports Phys. Ther. 51, 103–114. https://doi.org/10.2519/
jospt.2021.9748 (2021).
16. Nielsen, P. R., Jorgensen, L. D., Dahl, B., Pedersen, T. & Tonnesen, H. Prehabilitation and early rehabilitation after spinal surgery:
Randomized clinical trial. Clin. Rehabil. 24, 137–148. https://doi.org/10.1177/0269215509347432 (2010).
17. Sobottke, R. et al. Predictors of surgical, general and follow-up complications in lumbar spinal stenosis relative to patient age as
emerged from the Spine Tango Registry. Eur. Spine J. 21, 411–417. https://doi.org/10.1007/s00586-011-2016-y (2012).
18. Deyo, R. A. Treatment of lumbar spinal stenosis: A balancing act. Spine J. 10, 625–627. https://doi.org/10.1016/j.spinee.2010.05.
006 (2010).
19. Fanuele, J. C., Birkmeyer, N. J., Abdu, W. A., Tosteson, T. D. & Weinstein, J. N. The impact of spinal problems on the health status
of patients: Have we underestimated the effect?. Spine 25, 1509–1514 (2000).
20. Norden, J., Smuck, M., Sinha, A., Hu, R. & Tomkins-Lane, C. Objective measurement of free-living physical activity (performance)
in lumbar spinal stenosis: Are physical activity guidelines being met?. Spine J. 17, 26–33. https://doi.org/10.1016/j.spinee.2016.10.
016 (2017).
21. Weinstein, J. N. et al. Surgical compared with nonoperative treatment for lumbar degenerative spondylolisthesis: Four-year results
in the spine patient outcomes research trial (SPORT) randomized and observational cohorts. J. Bone Jt. Surg. Am. 91, 1295–1304.
https://doi.org/10.2106/JBJS.H.00913 (2009).
22. Marchand, A. A. et al. Effects of a prehabilitation program on patients’ recovery following spinal stenosis surgery: Study protocol
for a randomized controlled trial. Trials 16, 483. https://doi.org/10.1186/s13063-015-1009-2 (2015).
23. Marchand, A. A. et al. Feasibility of conducting an active exercise prehabilitation program in patients awaiting spinal stenosis
surgery: A randomized pilot study. Sci. Rep. 9, 12257. https://doi.org/10.1038/s41598-019-48736-7 (2019).
24. Hawker, G. A., Mian, S., Kendzerska, T. & French, M. Measures of adult pain: Visual analog scale for pain (VAS Pain), numeric
rating scale for pain (NRS Pain), McGill Pain questionnaire (MPQ), short-form McGill pain questionnaire (SF-MPQ), chronic
pain grade scale (CPGS), short form-36 bodily pain scale (SF-36 BPS), and measure of intermittent and constant osteoarthritis
pain (ICOAP). Arthritis Care Res. 63(Suppl 11), S240-252. https://doi.org/10.1002/acr.20543 (2011).
25. Vogler, D., Paillex, R., Norberg, M., de Goumoens, P. & Cabri, J. Cross-cultural validation of the Oswestry disability index in
French. Ann. Readapt. et de Med. Phys. 51, 379–385. https://doi.org/10.1016/j.annrmp.2008.03.006 (2008).
26. Coons, S. J., Rao, S., Keininger, D. L. & Hays, R. D. A comparative review of generic quality-of-life instruments. Pharmacoeconomics
17, 13–35 (2000).
27. French, D. J., Roach, P. J. & Mayes, S. Peur du mouvement chez des accidentés du travail: L’Échelle de Kinésiophobie de Tampa
(EKT). Can. J. Behav. Sci. / Revue Can. des Sci. du Comport. 34, 28–33 (2002).
28. Bourque, P. & Beaudette, D. Étude psychometrique du questionnaire de dépression de Beck auprès d’un échantillon d’étudiants
universitaires francophones (Psychometric study of the Beck Depression Inventory on a sample of French-speaking university
students). Can. J. Behav. Sci./Revue Can. des Sci. du Comport. 14, 211–218 (1982).
29. Dworkin, R. H. et al. Core outcome measures for chronic pain clinical trials: IMMPACT recommendations. Pain 113, 9–19. https://
doi.org/10.1016/j.pain.2004.09.012 (2005).
30. Champagne, A., Descarreaux, M. & Lafond, D. Comparison between elderly and young males’ lumbopelvic extensor muscle
endurance assessed during a clinical isometric back extension test. J. Manip. Physiol. Ther. 32, 521–526. https://doi.org/10.1016/j.
jmpt.2009.08.008 (2009).
31. Juan-Recio, C., López-Plaza, D., Barbado Murillo, D., García-Vaquero, M. P. & Vera-García, F. J. Reliability assessment and cor-
relation analysis of 3 protocols to measure trunk muscle strength and endurance. J. Sports Sci. 36, 357–364. https://doi.org/10.
1080/02640414.2017.1307439 (2018).
32. Padulo, J. et al. Validity and reliability of isometric-bench for knee isometric assessment. Int. J. Environ. Res. Public Health 17,
4326. https://doi.org/10.3390/ijerph17124326 (2020).
33. MacDermid, J. C., Arumugam, V., Vincent, J. I., Payne, K. L. & So, A. K. Reliability of three landmarking methods for dual incli-
nometry measurements of lumbar flexion and extension. BMC Musculoskelet. Disord. 16, 121. https://doi.org/10.1186/s12891-
015-0578-2 (2015).
34. Jones, C. J., Rikli, R. E. & Beam, W. C. A 30-s chair-stand test as a measure of lower body strength in community-residing older
adults. Res. Q. Exerc. Sport 70, 113–119. https://doi.org/10.1080/02701367.1999.10608028 (1999).
35. Podsiadlo, D. & Richardson, S. The timed “up & go”: A test of basic functional mobility for frail elderly persons. J. Am. Geriatr.
Soc. 39, 142–148. https://doi.org/10.1111/j.1532-5415.1991.tb01616.x (1991).
36. Marchand, A. A., Tetreau, C., O’Shaughnessy, J. & Descarreaux, M. French-Canadian adaptation and validation of the Swiss spinal
stenosis questionnaire for patients with lumbar spinal stenosis. Spine 44, E487-e493. https://d oi.o
rg/1 0.1 097/b rs.0 00000 00000 02896
(2019).
37. Roussel, P. P. Rémunération, Motivation et Satisfaction au Travail (Economica, Collection Recherche en Gestion, 1996).
38. Cleland, J. A., Whitman, J. M., Houser, J. L., Wainner, R. S. & Childs, J. D. Psychometric properties of selected tests in patients with
lumbar spinal stenosis. Spine J. 12, 921–931. https://doi.org/10.1016/j.spinee.2012.05.004 (2012).
39. Wright, A. A., Cook, C. E., Baxter, G. D., Dockerty, J. D. & Abbott, J. H. A Comparison of 3 methodological approaches to defin-
ing major clinically important improvement of 4 performance measures in patients with hip osteoarthritis. J. Orthop. Sports Phys.
Ther. 41, 319–327. https://doi.org/10.2519/jospt.2011.3515 (2011).
40. Schneider, M. J. et al. Comparative clinical effectiveness of nonsurgical treatment methods in patients with lumbar spinal stenosis:
A randomized clinical trial. JAMA Netw. Open 2, e186828. https://doi.org/10.1001/jamanetworkopen.2018.6828 (2019).
41. Richardson, J. T. E. Eta squared and partial eta squared as measures of effect size in educational research. Educ. Res. Rev. 6, 135–147.
https://doi.org/10.1016/j.edurev.2010.12.001 (2011).
42. Durrand, J., Singh, S. J. & Danjoux, G. Prehabilitation. Clin. Med. (Lond.) 19, 458–464. https://d oi.o
rg/1 0.7 861/c linme d.2 019-0 257
(2019).
43. Levett, D. Z. H. & Grimmett, C. Psychological factors, prehabilitation and surgical outcomes: Evidence and future directions.
Anaesthesia 74(Suppl 1), 36–42. https://doi.org/10.1111/anae.14507 (2019).
44. Carli, F. & Baldini, G. From preoperative assessment to preoperative optimization of frail older patiens. Eur. J. Surg. Oncol. 47,
519–523. https://doi.org/10.1016/j.ejso.2020.06.011 (2021).
Scientific Reports | (2021) 11:11080 | https://doi.org/10.1038/s41598-021-90537-4 12
Vol:.(1234567890)www.nature.com/scientificreports/
45. Hulzebos, E. H. & van Meeteren, N. L. Making the elderly fit for surgery. Br. J. Surg. 103, e12–e15. https://doi.org/10.1002/bjs.
10033 (2016).
46. Glance, L. G., Osler, T. M. & Neuman, M. D. Redesigning surgical decision making for high-risk patients. N. Engl. J. Med. 370,
1379–1381. https://doi.org/10.1056/NEJMp1315538 (2014).
47. Levett, D. Z., Edwards, M., Grocott, M. & Mythen, M. Preparing the patient for surgery to improve outcomes. Best Pract. Res. Clin.
Anaesthesiol. 30, 145–157. https://doi.org/10.1016/j.bpa.2016.04.002 (2016).
48. Thabane, L. et al. A tutorial on pilot studies: The what, why and how. BMC Med. Res. Methodol. 10, 1. https://doi.org/10.1186/
1471-2288-10-1 (2010).
49. Coffey, C. S. & Muller, K. E. Properties of internal pilots with the univariate approach to repeated measures. Stat. Med. 22,
2469–2485. https://doi.org/10.1002/sim.1466 (2003).
50. Ferreira, V. et al. Maximizing patient adherence to prehabilitation: What do the patients say?. Support Care Cancer 26, 2717–2723.
https://doi.org/10.1007/s00520-018-4109-1 (2018).
51. Siebert, E. et al. Lumbar spinal stenosis: Syndrome, diagnostics and treatment. Nat. Rev. Neurol. 5, 392–403. https://doi.org/10.
1038/nrneurol.2009.90 (2009).
Acknowledgements
The authors would like to acknowledge Mr. Pierre-Luc Yao for the assistance with the statistical analyses and
thank the neurosurgery team from the CIUSSS-MCQ and the patients who generously participated in the study.
Author contributions
A.A.M. contributed to the conception and design of the study, data acquisition, analysis and interpretation and
drafting of the manuscript. M.H. contributed to the design of the study and data acquisition. J.O., C.E.C. and
V.C. contributed to the design of the study and revision of the manuscript. M.D. contributed to the conception
and design of the study, data analysis and interpretation and drafting of the manuscript. All authors reviewed
and approved the final version of the manuscript.
Funding
This study was funded by the Chaire de recherche internationale en santé neuromusculosquelettique and its
partners the Centre intégré universitaire de santé et de services sociaux de la Mauricie-et-du-Centre-du-Québec
(CIUSSSMCQ) and the Université du Québec à Trois-Rivières. AAM received a doctoral scholarship by the
Institut de recherche Robert-Sauvé en santé et en sécurité du travail (IRSST) and the Fonds de recherche du
Québec—Santé (FRQS).
Competing interests
The authors declare no competing interests.
Additional information
Correspondence and requests for materials should be addressed to A.-A.M.
Reprints and permissions information is available at www.nature.com/reprints.
Publisher’s note Springer Nature remains neutral with regard to jurisdictional claims in published maps and
institutional affiliations.
Open Access This article is licensed under a Creative Commons Attribution 4.0 International
License, which permits use, sharing, adaptation, distribution and reproduction in any medium or
format, as long as you give appropriate credit to the original author(s) and the source, provide a link to the
Creative Commons licence, and indicate if changes were made. The images or other third party material in this
article are included in the article’s Creative Commons licence, unless indicated otherwise in a credit line to the
material. If material is not included in the article’s Creative Commons licence and your intended use is not
permitted by statutory regulation or exceeds the permitted use, you will need to obtain permission directly from
the copyright holder. To view a copy of this licence, visit http://creativecommons.org/licenses/by/4.0/.
© The Author(s) 2021
Scientific Reports | (2021) 11:11080 | https://doi.org/10.1038/s41598-021-90537-4 13
Vol.:(0123456789)You can also read