Energizing mobility's future - Roadmap Energy for Transport and Mobility (ETM) December 2019
←
→
Page content transcription
If your browser does not render page correctly, please read the page content below

Energizing mobility's future
Roadmap Energy for Transport and Mobility (ETM)
December 2019
Energizing mobility's
future

Introduction

4
How the climate crisis
shapes the future of
mobility
The world is in a crisis – a climate crisis. From wildfires in California, floods in India and
Bangladesh to heat waves in Europe (all happened in 2019) – at almost 1° C over
pre-industrial temperature levels, mankind already experiences what life in a warmer
climate will mean.

With the Paris accord, many countries aimed to hold the increase of global tempera-
tures to well below 1.5° or 2° C above pre-industrial levels. To reach the 2° C goal,
global carbon emissions needed to peak by 2021. To reach the 1.5° C goal, this would
need to happen in 2020 already. However, we are still far away from reaching those
levels. Following current trends, global carbon emissions will only fall by about 20% by
2050 – but 66% are required to reach 1.5° C.

Mobility and transport make up for 25% of all man-made CO2 emissions today – and
are one of the few sectors in which emissions still grow. This is not due to lacking
improvements in vehicle technology, transport infrastructure, and the energy systems –
but mainly due to a still growing demand for mobility for both people and goods.

By 2050, the passenger km traveled will grow by a factor of nearly 3 – from 44 trillion
in 2015/16 to 120 to 130 trillion in 2050. Freight tons will increase more than threefold
from 108 trillion to 340 to 360 trillion. And energy demand and hence CO2 emissions?
Innovation already identified today – in mobility and transport, could help curb demand and
emissions to about 7,000 million tons in 2050 – lower than today’s 7,800 tons. But this
is far from enough.

Besides the sheer need for decarbonization, there are also other factors driving the
revolution in mobility and transport. First, a growing world population and increasing
urbanization change how people and goods move. By 2050, almost 10 billion people will
live on earth (nearly 2.5 billion more people than what we have today) – 70% of them
in cities. The global economy is projected to double in size by about 2042. Emerging
economies will drive 80% of this growth.

Second, the good news is that we see more and more bold regulatory actions in certain
world regions. Europe aims to reduce CO2 emissions from new passenger cars from
130 g/km in 2015 to about 95 g/km in 2030. Cities begin to play a major role in the future
of mobility – becoming orchestrators for different mobility in urban environments. In
addition to defined regulations, organizations are also making new commitments for
addressing climate change. The International Maritime Organization agreed to reduce
total annual GHG emissions from shipping by at least 50% by 2050 (compared to 2008).

Energizing mobility’s future                                                                     5

Third, in order to drive this disruption, we need breakthroughs in technology which will
reshuffle the mobility ecosystem. In road transport it is primarily the so-called four
ACES (autonomous driving, connectivity, electrification, and smart mobility) which
transform the industry.

Fourth, the stakeholder and value chain for mobility is being challenged and opened.
For example, 515 partnerships have been concluded by global automakers since 2010 –
including joint ventures, strategic alliances, and acquisitions. One example is the
cooperation of Daimler and BMW in autonomous driving and in mobility services;
another the cooperation of Volkswagen and Ford on electric vehicles (EVs).

And finally, consumers begin to rethink their mobility behavior. Shared mobility is taking off:
25% of respondents state that their use of mobility services is the reason why they do
not own a car. And: the total number of micromobility trips rose from 35 million in 2017 to
84 million in 2018.

In short: mobility will change tremendously, and it needs to –
otherwise mankind will not be able to solve the climate crisis. In
the next chapter, we describe in more detail what role InnoEnergy –
together with you – can play in this undertaking.

6
Energizing mobility’s future 7

8

Contents

InnoEnergy’s purpose of investing in Energy   11
for Transport and Mobility (ETM)

The ETM focus areas                           12

1. Zero-emission drivetrains                  14
    New battery systems

    Hydrogen as a carrier

    E-drive systems

2. Autonomous driving technology              28

3. Innovative vehicle concepts                34
    Mobility services for people

    The last mile for goods

    Mission-optimized vehicles

4. Energy provision infrastructure            48
    Electric charging infrastructure

    Hydrogen infrastructure

5. Mode-shifting new mobility services        58

Energizing mobility’s future                   9
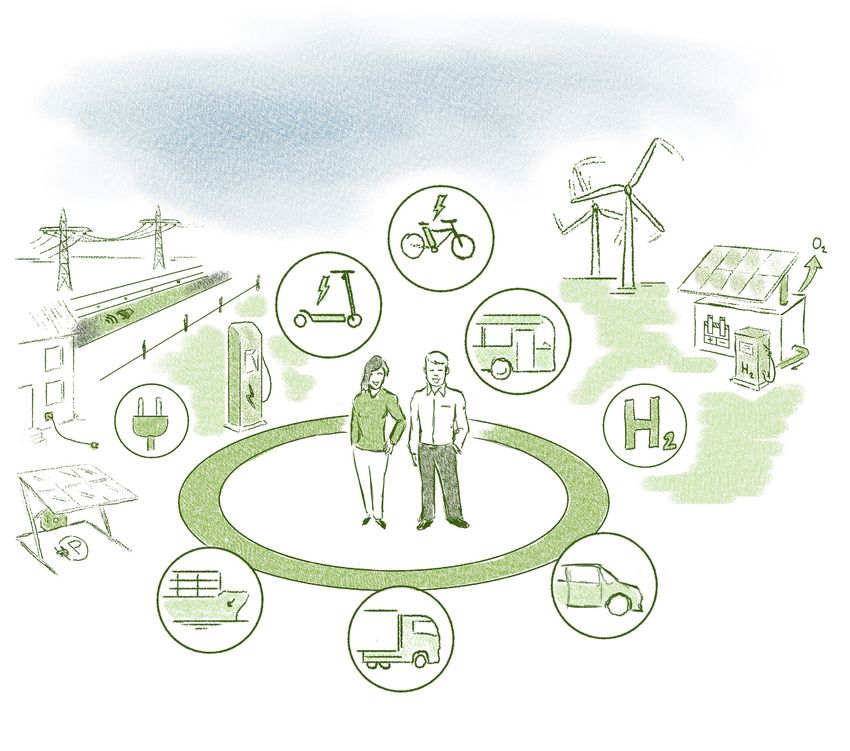
Sustainable
                     utilization of our
                         Planet

     Accessibility
     and health of
      People
                                          Value creation
                                          and long-term
                                          Profitability

10
InnoEnergy’s purpose of investing in Energy for Transport and Mobility (ETM) InnoEnergy’s purpose is to bring the strong European energy, transport and mobility landscape to a new level in sustainable energy use and GHG reductions. With the challenges and needs for action described, we are committed to live up to be the inno- vative ecosystem that helps drive the disruption in sustainable transport and mobility in Europe. We also build on our strength to successfully create and grow ecosystems in Europe (such as with the European Battery Alliance). Our focus is to support technology-driven, young, small, and medium-sized companies which are based in Europe but have the potential to reach global impact. To guide our activities, we base our decisions on a concise 3P framework: “planet, people, profitability.” We assess the impact of each of our investments on whether it fosters the sustainable utilization of our planet, improves accessibility and health of people, and creates long- term value. Those are the key considerations for each dimension. Planet Does the investment opportunity prevent dangerous global warming through lowering emissions, reducing energy demand – hence contributing to climate goals? Does it contribute to a more sustainable use of resources, and especially an efficient use of scarce resources? Does the investment create more livable communities and green spaces – especially in cities? The concrete KPIs behind this dimension may include the reduction of GHG emissions measured in ppm or gram, the reduction of total energy demand in GW or GWh, or physical space improved (measured in m2). People Does the investment support ethical standards and proliferates safe, healthy, and efficient transport of people and goods? Does it expand convenient, flexible, and affordable solutions and promote a shift to more sustainable mode of transport? Does it improve a more secure energy supply? And does the investment help reduce traffic and the time spent in traffic? KPIs for this dimension are air quality improve- ments, average idle time in transport, typical total commuting times, or a shift towards more sustainable modes of transport. Profitability Does the investment support a proven product market fit and does it have enough attraction and market pull with consumers? Does it improve the economics of the energy system for transport and mobility? Does InnoEnergy have the potential to significantly accelerate commercialization and scaling of selected companies? Is the market entry clear and the associated stakeholders able to be convinced of the solution? Our key KPIs for this dimension will be revenues, time to market, and return on investment. Energizing mobility’s future 11
The ETM focus areas
Overview
Against the background of the climate crisis and changing mobility patterns we assessed
the whole playing field along all modes of transport and the mobility value chain. For
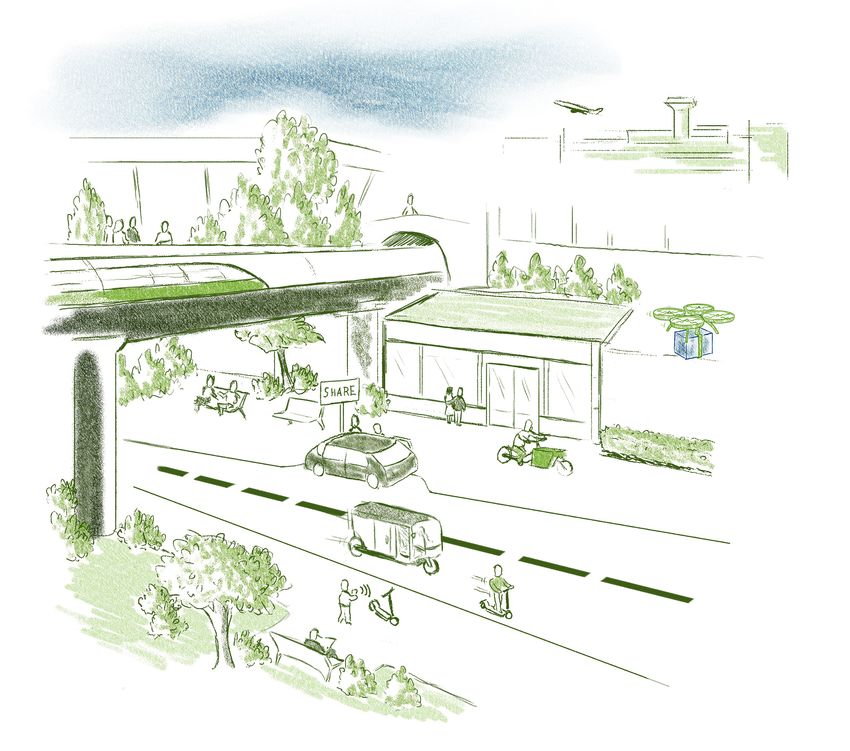
the modes of transport, the scope went from small to big: walking/cycling, two-/
three-wheelers and micromobility, cars and shuttles, buses, commercial vehicles, rail,
marine, planes, urban aerial mobility and construction/utility, and off-road vehicles. We
also looked at the whole value chain: from vehicle concepts and technologies (e.g., zero-
emission drivetrain), and enabling technologies such as charging infrastructure to new
mobility services (e.g., shared mobility and aggregator platforms).
Along this value chain, cars, shuttles, and commercial vehicles have and will continue to
have the greatest global energy demand. As a consequence, they also contribute the
greater share of CO2: road transport with more than 70% of total CO2 emission and 65% of
the energy demand from all transport.
Along those priorities, we concentrate our investments on five focus areas to support
and strengthen the European transport and mobility landscape. The majority of
these focus areas cover multiple modes of transport to ensure strong impact on
energy and emissions.
The focus areas are:
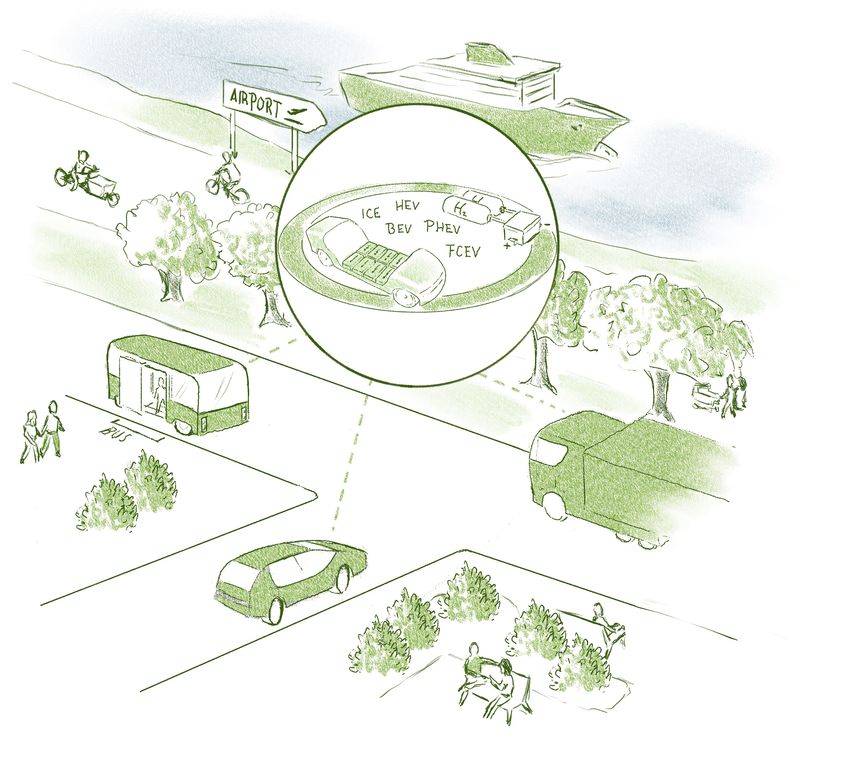
1. Zero-emission drivetrain, including, e.g., advanced battery technology with
higher energy density for passenger cars; hydrogen as a carrier for fuel cells or
internal combustion engine; and e-drive systems.
The technology in this focus area is already market-fit and has a direct impact on
GHG emissions, raw material use, and energy efficiency. As a second order effect it
thus also improves public health and the affordability of transport.
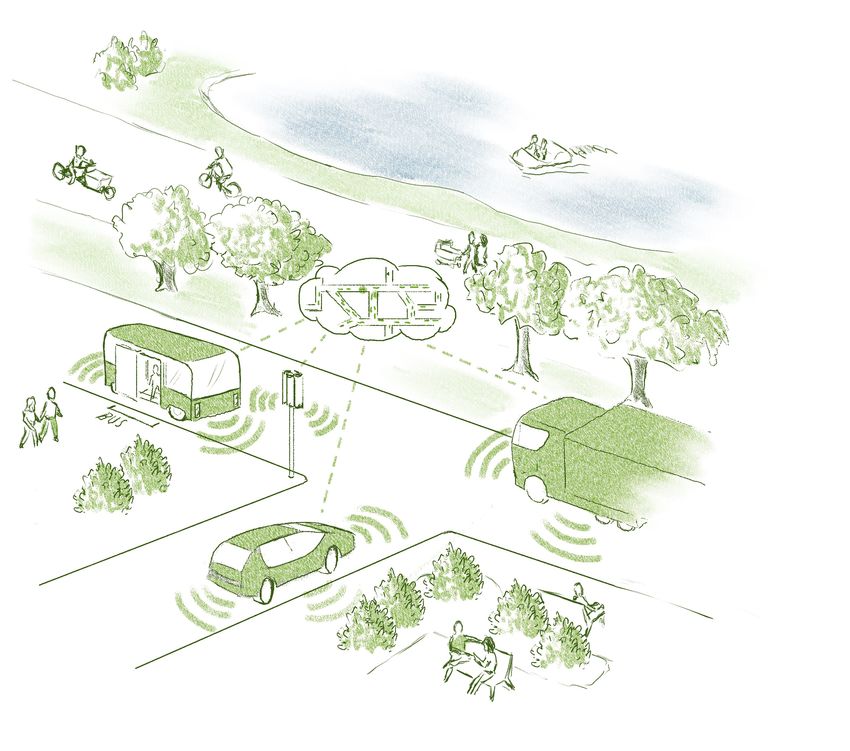
2. Autonomous driving technology, including products like advanced software,
sensors, and other electronics, e.g., LIDAR systems, including algorithms for
trucks as all-in-one solution.
In this focus area we see strong business cases which are, however, restrained by
long-term uncertainty. An optimized movement of vehicles could improve several
dimensions, though: lower emissions, safer traffic, as well as better affordability
and availability for people. Robotaxis, (pooled and nonpooled) could account for up to
20% of vehicles on the road in European cities.
123. Innovative transport concepts, including offers that make the last mile for
people (micromobility) or goods more efficient, or allowing for purpose-optimized
concepts like, e.g., new rolling e-chassis could. This focus area could also entail
vehicle concepts which take an enabler role for primary planet and people targets
of InnoEnergy by significantly improving the uptake and the business case across
technologies.
4. Energy provision infrastructure, including sustainable and efficient EV charging
stations and or hydrogen infrastructure.
A better infrastructure – which is thoughtfully integrated with other sectors, will
enable sustainable transport and mobility in Europe – it also impacts space and
availability with the rollout starting already today.
5. Mode-shifting new mobility services, including improved algorithm and route
calculation for shuttle services to improve the operations – or mode aggrega-
tor service provisions. For the end customer, value shall be created by seamless
access, real-time information, payment, and services.
Optimizing the use of transport modes can have strong implications for all 3P
targets – the respective business models are already gaining traction today. The
European mobility-as-a-service (MaaS) commission market is estimated to be worth
EUR 180 to 380 million by 2023.
In all these focus areas we see tremendous impact based on
our 3P framework and hence will describe each in more detail
in the following chapters.
Energizing mobility’s future 131 Zero-emission
drivetrains
14The electrification of the drivetrain gained significant momen- tum over the last 12 months. Two factors drive that rapid de- velopment. First, the EU has tightened emission regulations – all OEMs have to meet the strict 95 g CO2/km target with their whole as of 2021. As a consequence, they have announced to bring more than 300 purely electric models to the market by 2025. This regulatory push is accompanied by a customer pull – more and more people consider buying an electric car; or even riding electrified alternatives such as e-bikes, e-mopeds, or e-scooters. And we may start to see a mid-term effect on the residual value of ICEs. Energizing mobility’s future 15
New battery systems – impact across 3P principles

         Planet                                        People

Energy demand                                 Accessibility

The production process for batteries is       In the mid term, the lower cost of
energy- and resource-intensive (result-       BEVs through a professionalized
ing in 182 Mt CO2e emitted by 2030).          and well-functioning battery supply
However, EVs recover this disadvantage        chain could enable more customers to
after only 24,000 km (from a CO2e per-        purchase BEVs/PHEVs compared to
spective) due to their higher efficiency (~   internal combustion engine cars. This
60% of electrical energy vs. 20% of fuel      also provides customers access to
converted to energy for ICE).                 future zero-emission zones. Follow-
                                              through effects through, e.g., the
                                              reuse of batteries could provide 600
Emissions
                                              million people with access to electric-
The total global battery production           ity. In addition, battery recycling for
footprint is expected to increase from        reuse in vehicles is strongly emerging
24 Mt CO2e (2018) to 182 Mt CO2e              and developing traction.
(2030) – mainly due to higher number
of EVs. But in operation, EVs currently
                                              Health
emit 30 to 60% fewer emissions –
depending on energy mix, helping              EVs would have a significant positive
reduce CO2 emissions overall.                 contribution to air quality levels in
                                              inner cities. 97% of cities in low- or
                                              middle-income countries do not meet
                                              WHO air quality guidelines today. EVs
                                              emit 19 to 60% less CO2 during their
                                              lifetime and no other pollutants in oper-
                                              ation (e.g., NOx) – and could hence be
                                              an important lever to improve public
                                              health.

16
Profitability
Market demand Business model/GTM
The global battery demand is expected Currently players primarily focus on
to scale 19x by 2030 (up to ~ 2,600 GWh mining/refining, battery cell/compo-
in the base case), with demand for nent/pack production and battery
more than 320 GWh in Europe by 2030. sales. This opens up opportunities for,
Compared to that, supply in 2018 was e.g., leasing models or supporting ser-
only 17 GWh for BEVs alone. vices related to certification/battery
health or reuse/recycling. This is espe-
cially important as OEMs are mandated
Technology
to take back batteries.
Lithium-ion batteries are currently the
industry’s main focus for drivetrains
Future structure/competition
across modes. Significant research is
yet ongoing into, e.g., different cathode Scale becomes increasingly important
materials or solid-state batteries to for cell production with more than 250
address resource scarcity, toxicity, and GWh announced in Europe for battery
performance. Whatever the cell chem- supply – with an increasing number of
istry, battery management systems OEM/(new) Tier-1 partnerships (such as
and software are also increasingly between VW/Northvolt, BMW/CATL).
important drivers along the tech stack. Yet there are still many smaller players
with greater investment opportunity,
e.g., in R&D (collaboration with universi-
ties) and recycling/reuse.
Energizing mobility’s future 17Value chain and investment opportunities While a fully-fledged supply chain for batteries is still being developed, some interesting areas for investment can already be identified. From harvesting and refining raw mate- rials, manufacturing battery cells, modules and electronics through assembling and packing pack (including software and integration with machine) to using battery packs as well as recycling or reusing cells – multiple investment opportunities exist. The main focus of this thematic field is on the assembly and packing, as well as the use, inte- gration, and optimization in a vehicle. The other areas are primarily covered within the thematic field Energy Storage at InnoEnergy. Throughout the battery system value chain one focus should be on driving battery technology improvements (of both existing and new technologies) – aiming at longer battery lifetime and higher durability. Especially for smaller vehicles (e.g., e-scooters), improving the battery systems itself – e.g., by making them interchangeable – is an important step towards better sustainability. In use, there is also room for improvement for better battery management systems (e.g., to extend lifetime); further opportunities lie in providing upcycling or repair services. Finally, new leasing and financing options could support the rollout of batteries into different vehicles types. Improvement in all steps of the value chain are needed – as the electrification of light vehicles in the EU will require a massive scale-up along the ecosystem. The demand for raw materials will increase 17-fold until 2030. And the battery will play a significant role in the overall vehicle value chain. While in today’s ICEs the powertrain constitutes some 25% of the overall value, this number will increase to 60% in a BEV – with the battery being by far the largest factor (76% of value in BEV powertrain, almost 50% of value of the entire vehicle). Improvement in battery costs hence translate into sinking vehicle prices – and indeed lithium-ion battery costs are coming down faster than expected. Some players claim to reach cost parity with ICEs as early as 2021. While Europe has been strong in the ICE powertrain value chain, Asia dominates the battery value chain. Currently battery production is centered on South Korea, Japan, and China – with China accelerating. The top ten players – all Asian – take around 90% of the overall market share. By 2025, the overall battery manufacturing capacity is expected to reach 867 GWh, with strong growth in China and Europe. 18
Energizing mobility’s future 19
Hydrogen as a carrier – impact across 3P principles

         Planet                                     People

Energy demand                              Accessibility

Hydrogen production comes with a           The proliferation of fuel cell electric
significant energy footprint – however,    vehicles (FCEV) would give consumers
hydrogen is an attractive storage option   and commercial users a bigger choice;
for energy as it can be transported and    especially for consumers with use
stored for longer time periods and could   patterns that are currently not fully
therefore be used to store, e.g., unused   served by BEVs. One of today’s advan-
solar or wind power.                       tages of FCEVs is, for example, that
                                           FCEVs recharge today at a 15x higher
                                           speed than BEVs with fast charging.
Emissions

Hydrogen could be a significant lever to
                                           Health
reduce CO2 emissions given its poten-
tial applications in multiple transport    Health would be increased due to
modes. Moreover, hydrogen is a less        reduction of CO2 and other particulate
resource-intense technology (e.g., no      emissions when ICEs are replaced
use of rare materials) – but green or      with FCEVs. Moreover, there are no
blue hydrogen would be required to truly   negative externalities for, e.g., cobalt
reduce emissions.                          mining workers compared to BEV.

20
Profitability
Market demand Business model/GTM
The fueling/charging value pool for Achieving profitability requires significant
hydrogen could reach USD 20 billion scaling of the hydrogen ecosystem – as
net earnings by 2050, with the large the costs are still prohibitive (e.g., for
scale-up expected only after 2030. refueling infrastructure, production
However, for some vehicles cost parity plants). This could be achieved by lock-
with conventional propulsion technol- step solutions. In general, a wide range
ogy is possible today: for regional trains of services and opportunities is available
an FCEV is 55% cheaper vs. diesel, and along the value chain.
by 2040 the opex for FCEV trucks is
expected to be ~ 80% lower than today.
Future structure/competition
Multiple automotive OEMs (passenger
Technology
car producers and truck makers) as
The fuel cell technology is generally well as selected startups like Nikola
ready for, e.g., automotive applications are currently developing FCEVs. We
and already in use by selected OEMs. see cooperation between players, e.g.,
Some startups explore hydrogen as OEMs, to share components.
a fuel in ICE instead of fuel cells. The
key challenge remains to find cheaper
solutions for, e.g., transport and storage.
Energizing mobility’s future 21Value chain and investment opportunities The value chain for hydrogen as a carrier includes the development and production, the operations and financial services. As a first step, ETM could support the development of technology advancements in FCESVs or fuel cell buses as well as fuel cells or hydrogen for ICEs are relevant for moving the field forward. Digging deeper, providing specialized FCEV or hydrogen-ICE components (such as pressurized tanks) or developing adjacent hardware such as fuelcell-related technologies for interior heating or cooling can be valuable drivers in the field of hydrogen – just as are efficient operations and services and the right level of financial services for users. The use case for FCEV is compelling especially for larger vehicles. In this segment FCEVs are expected to become cost competitive to BEVs in 2023 and to ICEs in 2030, as the costs of the fuel cell system will decrease by 55% until then, and even by 70% for the distribution and refueling infrastructure. As an additional plus, FCEVs also have a much shorter refueling time than even fast-charging BEVs – and a bigger range. Compared with synthetic fuels, hydrogen is half as expensive per 100 km and offers 1.7x more range per kWh of electricity used than synthetic fuels. Beyond road vehicles, hydrogen is a viable alternative for trains. Two hydrogen-powered trains are in operation in Germany today, and 43 more are planned to be deployed by 2023. This is driven by a simple logic: while a diesel train might still be cheaper, the costs to electrify a diesel track are very high – so overall, a hydrogen train is some 55% cheaper than a diesel train. 22
Energizing mobility’s future 23
E-drive systems – impact across 3P principles

         Planet                                       People

Energy demand                                Accessibility

E-drive systems support the proliferation    More affordable vehicles and a greater
of purpose-built vehicles. These concepts    variety of form factors enabled by,
could lower energy consumption due to        e.g., e-drive skateboards make EVs
more specialized design and engineer-        more accessible – especially for lower-
ing (“rightsizing”) – with the use case at   income households.
the center. Hence, e-drive systems thus
reduce overall transport energy demand.
                                             Health

                                             E-drive systems could disrupt, e.g.,
Emissions
                                             urban delivery services by enabling
E-drive systems also have an impact          purpose-built EVs and thereby replace
on CO2 emissions, as more affordable         ICEs (with their emissions and pollu-
EVs will replace ICEs. Moreover, those       tion). Special-purpose vehicles enabled
systems address use cases like last-mile     by e-drive systems can also replace
delivery which have an impact on emis-       humans in, e.g., specialized or danger-
sions (CO2 and particulate) in densely       ous applications, reducing overall risk.
populated areas.

24
Profitability
Market demand Business model/GTM
Electric vehicles are expected to account Marketwise, there is a risk of com-
for ~ 25 to 35% of vehicle sales by 2030. moditization of e-drives which could
This will create further demand, with decrease profitability. One reason is
significant market potential for e-drive that the entry cost for suppliers and
systems – e.g., due to high number of manufacturers is low compared to ICE
potential customers (4.5 million Lyft platforms. On the other hand, there
and Uber drivers). The OEM uptake of are new potential customers for such
e-drive systems is set to vary with systems such as EV OEMs (especially
maturity. newer/smaller) and mobility service
providers (MSPs), e.g., for engineering
services or production.
Technology
Depending on target customer and body
Future structure/competition
architecture, the scope for e-drives
ranges from e-axles to full body-on- There is a significant opportunity to
frame skateboards. The technical supply new EV OEMs or MSPs, poten-
complexity of e-drives is significantly tially also logistics companies. Hence
lower than for ICE platforms. Today, Tier-1 suppliers develop a wide range of
already more than 10 suppliers offer e-drive systems, ranging from e-axles to
e-axles or drives. full e-skateboards, with some OEMs also
providing full e-chassis (e.g., VW).
Energizing mobility’s future 25Value chain and investment opportunities Within the e-drive production system, we again see various investment opportunities – ranging from specialized subcomponents through individual powertrain components to drive system integration as well as testing and vehicle integration. Players could position themselves as third party contractors, providing manufacturing capacity. Within individual powertrain components, ETM could support companies that develop hardware (such as brakes or the steering column). Moving one step further, players could develop full systems like, e.g., the e-skateboard or partial systems such as the ther- mal management, safety systems, steering, braking system, or the e-axle. In the test- ing and vehicle integration step, companies could be supported that provide integration, testing, and certifications services; that provide engineering services like thermal man- agement improvement or that deploy leasing concepts or maintenance and engineering service provisions. From e-skateboard to rolling e-chassis – flexible and modular e-drive systems offer the possibility to cover a wide range of use cases and could enable fast scaling. Integrated offers in the chassis could revolutionize OEM and supplier collaboration – with faster time to market, a shift in design responsibility and capex distribution, with new architecture solutions, a shift in capabilities and lower barriers to entry. This disruption of the supply chain could result in many different moves from the players: new players could enter the space as new Tier-1 suppliers, Tier-1 suppliers could develop into Tier-0.5 sup- pliers; and OEMs and Tier-1 suppliers could integrate backward in new areas such as the e-axle (for OEMs) or batteries and electronics (for Tier-1s). For many players this means that their coverage of the value chains will expand. The good news: overall, the powertrain is still set for growth – by about 5% until 2025. In this newly emerging value chain, some components – especially in the electric drive- train – will be crucial: given its share of overall vehicle value, the battery cell and the battery pack will constitute an important part of the overall revenue share. Earlier in the supply chain, the inverter, the power distribution unit, the DC/DC converter and the charger will be key. Finally, the overall system integration and the definition of features will be an important aspect of the new supply chain. All those areas can be understood as “control points” – crucial aspects of the chain which will give significant advantage to those players who manage them. 26
Energizing mobility’s future 27
2    Autonomous driving
     technology

28
Autonomous driving technologies have the potential to signifi- cantly change mobility as we know it – and thus will have a major impact on the future of mobility: they do not only change how people and goods move, but also show tremendous potential for greater efficiency in the overall mobility system – by improving traffic flows, improving idle times, avoiding unnecessary rides (e.g., searching for parking), etc. In turn, this would lower the energy demand and cut GHG emissions. While fully autonomous driving (level 5) is still far out, the upcoming years will bring viable applica- tions in level 2 and level 3 settings. Energizing mobility’s future 29
Autonomous driving technology – impact across
3P principles

         Planet                                       People

Energy demand                                Accessibility

AD reduces the overall energy demand         AD reduces the cost per mile which
due to primary effects like more efficient   supports the mobility transition away
driving strategies, less idle time and       from private cars. For users with
fewer stops. For trucks, fuel savings        annual driving distance below 20,000
and consequently emissions reductions        km, an AD-based car-sharing model is
could reach up to 10 to 15%. Moreover,       economically attractive. Autonomous
autonomous vehicles could reduce the         driving could also help provide individ-
need for parking spaces, e.g., the US by     ual mobility to, e.g., elderly and handi-
5.7 billion m2. There are also secondary     capped users.
effects like lower vehicle production
as users move from private vehicles to
                                             Health
AVs. Additionally, AD is a key enabler for
mode-shifting mobility (e.g., from private   AD could potentially reduce accidents
cars to roboshuttles).                       by more than 90% – as nine out of ten of
                                             accidents today are caused by human
                                             error. This leads to nearly 1 million hos-
Emissions
                                             pital days and USD 212 billion per year
Self-driving technology reduces vehicle      caused by automotive accidents in the
CO2 emissions through synchronous            US alone. On top, autonomous vehicles
driving, optimized routing, fewer            could allow average drivers to free up
traffic jams, which could reduce fuel        about ~ 50 minutes per day – which they
consumption by up to 25%. Moreover,          could use for sleeping, communicating or
most AVs will be EVs, helping further        reading.
reduce emissions. Majority of AVs
expected to be EVs, helping to further
reduce emissions.

30
Profitability
Market demand Business model/GTM
The total potential value for shared Sensors and central control units (CCU)
autonomous technology in urban areas will have the highest revenue pool – and
sums up to USD 1,600 billion annually software-centric elements the highest
by 2030 – as much as the spend on profitability. As a second effect, AD
defense, globally. By 2030, the sales reduces productivity losses (e.g., traffic
revenue of level 3 and 4 AD cars may jams), costs for healthcare systems and
reach USD 2.400 billion. Two-thirds of infrastructure, and CO2 emission.
consumers are willing to switch the
brand for better AD features.
Future structure/competition
Leading players form strong partner-
Technology
ships and ecosystems for the devel-
Based on multiple sensor technologies opment, testing, and deployment of
in use, the first level 3 vehicles – with autonomous driving (OEM + X). Clear
automated highway driving – will have leaders are emerging at the moment,
their start of production by 2021. Level e.g., Waymo achieving 2x more miles
2 entry features will be replaced by per disengagement (situations in
superior AD features, the level 3 high- which a human driver had to take over
way pilot will stay a niche product as from the computer again) than GM
it will be quickly replaced by the level 4 and 6x more than Zoox (2018).
highway pilot.
Energizing mobility’s future 31Value chain and investment opportunities The autonomous driving technology value chain shows interesting investment opportunities for InnoEnergy. Within the hardware space (sensors and central control units), ETM could invest in companies that improve the capabilities of sen- sors (e.g., higher accuracy, less false alarms) or that develop cheaper sensors as well as alternatives with the same capabilities. In the area of central control units, the hearts and brains of autonomous driving, ETM could provide support for the development of new systems on a chip. In in-car software (perception, decision- making, middleware), there are opportunities for players that test algorithms and provide (virtual) training environments. There is also a need to certify algorithms and confirm/ensure their way of working. In the back-end software (HD map and location-based services) further investment fields could help automate the map cre- ation and update processes, as well as the introduction of software standards across the industry. One more interesting field is the car data for which new monetization options could be created. Within engineering services (integration and validation, production) players could convert traditional vehicles into AVs – either in their own production facilities (e.g., for supporting scale-up) or by providing engineering services, using third-party plants. Companies could also offer “sensor leasing” to help offset the high capex costs. Looking at possible use cases for autonomous vehicle technology, robotaxis will be the most important one, but the most uncertain when it comes to deployment – partly due to the regulations. “Climbing up” the ladder from level 2 entry features through level 3 and level 4 highway pilot, level 4/5 robotaxis could replace private car sales at some point. The adoption of these new vehicles will start in suburban areas as they provide a relatively easy environment for autonomous driving – with few obstacles, wide lanes, and simple driving scenarios. First pilots are on the road already (e.g., Waymo in Phoenix/Arizona), and in 2021/22 we will see more of those. At a later stage, urban areas – with more pedestrian, double-parking, and other more compli- cated driving scenarios – will follow (between 2023 and 2027). Even more complex are superdense city centers like downtown Tokyo with frequent and complex obstacles and edge cases – adoption will likely not happen before 2025 to 29. And last, rural areas will be covered – due to the difficulty and expensive mapping needed, and unique challenges such as high differential speed. These regions will only be covered between 2027 and 2035. However, this spread of robotaxis will need to be managed: some 20% of vehicles on the road in European cities could, in theory, be robotaxis by 2030. Hence cities will be at the forefront of a guided adoption of these vehicles which could in turn reduce the 32
overall vehicle fleet. But the regulatory landscape will play a dominant role in the roll-
out and acceptance of this technology. The USA and China will likely lead, and Europe
will follow.

Besides passenger vehicles, trucks will be an important use case for autonomous driving
technology. An automated truck can yield some 10 to 15% fuel savings over a conven-
tional one – and most likely we will see autonomously navigating trucks on highways
(level 4 autonomy) much earlier than we will see large fleets or robotaxis in urban cen-
ters. Already today we see autonomous trucks being operated in geofenced areas such as
harbors, logistics centers, or in mining operations (e.g., Einride in Sweden).

Robotaxis – and earlier on, vehicles with advanced driver assistance systems (ADAS) –
strongly rely on sensors to map and understand the environment. Consequently we will
see strong growth on sensors – from USD 30 billion in 2020 to USD 63 billion in 2030.
Camera and radar are the largest sensor class in ADAS – later in the 2020s also LIDAR
will experience a strong market growth – as LIDAR’s capabilities are very valuable for
AVs. Restrained by the high systems cost which limit widespread adoption we expect
that the solid-state LIDAR will be the technology of choice in the future. Multiple startups
compete very successfully in that field – also due to significant funding.

In 2030, the LIDAR market will be biggest for private cars (with USD 3.9 billion), fol-
lowed by robotaxis (USD 3.2 billion), trucks (USD 0.7 billion) and other applications
such as in agriculture or mining (USD 1.8 billion). Whereas the private car markets
will be big due to the high volume, the robotaxi and truck markets will grow because
of the need of those vehicles to incorporate multiple sensors.

Going beyond the necessary hardware, also the software market for ADAS/head-up
display software will increase – from USD 15 billion in 2020 to over USD 40 billion by
2030 (CAGR of 11%). Software will be a critical and highly profitable part of the AV value
chain. We expect that tech players – due to their competence in this field – will join
typical Tier-1 players as suppliers. However, the increasing complexity in software is a
key challenge for the automotive industry; as the modern vehicle architecture has to
be adjusted in order to manage complexity and quality. Another challenge are cyber-
security and hacker attacks which could undermine the public’s acceptance of autono-
mous vehicles.

As discussed above, the market structure for autonomous vehicle technology will
be different from today’s classic automotive supply chain. Several players will work
together to develop both the hardware and software in this field – from OEMs, carelec-
tronics system suppliers, software, and tech giants to semiconductor companies as well
as computing and connectivity players.

Energizing mobility’s future                                                              33
3    Innovative vehicle
     concepts

34
For decades, the car has been experienced as “freedom machine” – one could start the engine and drive hundreds of kilometers, wherever one wanted. Most cars were built on a “one- size-fits-all” approach and have been used for the daily com- mute, for shopping on weekends, and for the yearly holiday trip. In future, we will see more varieties of vehicles beyond cars tailored in specific use cases – from the small commuter vehicle such as e-bikes or e-scooters to long-distance cars, from autonomous delivery pods to large trucks. Energizing mobility’s future 35
Mobility services for people – impact across 3P principles

         Planet                                      People

Energy demand                               Accessibility

The energy demand per km traveled           The fueling costs of e-scooters are
is significantly lower for e-bikes and      ~ 63 x less than for a conventional ICE,
e-mopeds than for passenger cars. The       and ~ 27 x less compared to an EV.
energy required to produce an e-bike’s      Micromobility can connect users to public
battery (22 - 30 kg CO2) already recov-     transport, providing more people with
ered after 100 km not driven in a car.      access to these services – as about
                                            40% of US micromobility rides go from/
                                            to public transport.
Emissions

CO2 emissions per passenger are about
                                            Health
~ 60 x less for an e-scooter than for a
single passenger ICE, and ~ 8 x less than   With its around 8 to 60 x lower CO2
for a pooled EV. In Munich, CO2 emis-       emissions compared to cars, micromo-
sions savings in 2030 could reach some ~    bility improves the air quality especially
80,000 tons through micromobility.          in urban areas. And: 49% of micromobility
                                            users would otherwise have chosen cars
                                            (including ride hailing). Moving to, e.g.,
                                            e-bikes also has health benefits.

36
Profitability Market demand Business model/GTM In 2030, the market is expected to include Multiple go-to market options are 27 million vehicles and be worth USD 400 available along the value chain, rang- to 500 billion. About 46% of all US vehicle ing from component manufacturing trips are less than 5 km, ~ 60% are less (currently worth ~ 15 to 25% of value), than 8 km – different micromobility operating fleets (at ~ 30 to 45%) to, form factors could address these use e.g., mobility services (capturing ~ cases. 30 to 40% of value). Technology Future structure/competition A range of form factors is already avail- Many new players have launched their able, additional form factors for new services due to low initial investment use cases are likely to emerge (e.g., and deployment costs. The number of inclement weather, shopping). There is scooters needed per city is limited, and an additional opportunity to increase the cost of hardware is fairly low, partly addressable share of passenger km driven by production in, e.g., China. traveled from currently, e.g., 50 billion The market will consolidate as scale is km in Germany (10% of total). essential to ensure high utilization. Energizing mobility’s future 37
Value chain and investment opportunities

The value chain for the last-mile mobility of people consists of the actual manufacturing
(R&D, components, integration), the asset provision (financing, asset ownership), the
fleet operations (charging, relocation, maintenance) and the mobility services chain
(business owner, licensing, payments, mobility platform).

In manufacturing, there is an opportunity to develop new form factors to address
additional use cases. Moreover, one pain point at the moment is the lifespan of the
vehicle: one could think of better design, maintenance, etc. to reduce the fleet turn-
over, both which improves sustainability and profitability.

In operations, new players could develop third-party or even autonomous relocation
systems for micromobility devices, improve the charging systems, use exchangeable
batteries, and offer remote maintenance to reduce costs and extend lifetime.

In mobility services, companies could better integrate their micromobility offer with, e.g.,
public transport or offer innovations such as flat rates or mobility budgets across opera-
tors.

The last mile of people transport – micromobility – can address a large share of trips
with ranges of up to 8 km. Possible means of transport are (electric) bikes, scooters, and
mopeds. 10% of all trips in Germany could be addressable, the global market size is some
USD 400 to 500 billion large. The vehicle fleet could be as big as 27 million vehicles by
2030. The field is interesting for many different players – ranging from auto OEM sup-
plier, startups, banks, transport operators to mobility service providers.

Using today’s technology, e-mopeds can account for around 60% of market and
vehicle share due to longer trip distances; e-bikes and e-scooters each account for
around 20%. In the future, new form factors (e-trikes, bikes with a roof, etc.) could be
picked up in micromobility as well as for personal use. This could help increase the
share of potentially addressable kilometers captured by micromobility.

Today around 50% of shared micromobility trips cannibalize non-car-based mobility. The
other half substitutes the use of a private car (25%), ride hailing (9%), car sharing (8%),
and taxi (7%).

Regulation is and will be central to bolster micromobility’s role in future (urban
mobility). Cities will be crucial to define the “rules of the game” in their centers –
potentially making micromobility more attractive compared to private car use
(e.g., by closing areas for cars, increase parking fees, financially supporting micro-
mobility sharing schemes).

38
Energizing mobility’s future 39
The last mile for goods – impact across 3P principles

        Planet                                     People

Energy demand                             Accessibility

When a large share of the 7.2 million     Without intervention, last-mile induced
delivery vehicles in the global top       commuting times would increase
100 cities by 2030 are EVs, this could    by on average 21%. And: lower delivery
reduce energy demand significantly        costs are possible, enabling more con-
for the last mile of goods (depending     sumers to use online deliveries.
on energy efficiency of EV and battery
production).
                                          Health

                                          Replacing delivery trucks and vans with
Emissions
                                          cargo e-bikes or EV last-mile solutions
Without intervention, CO2 emissions       could reduce inner-city pollution, espe-
are set to grow by 6 Mt to 25 Mt by       cially if deliveries are moved to night
2030, up from 16Mt in 2019. However,      times. However, delivery robots and
it is possible to reduce emissions by     droids deployed at scale would signifi-
30% with limited disruption only by       cantly increase congestion.
combining regulation and private-sector
initiatives.

40
Profitability
Market demand Business model/GTM
Overall, last-mile services generated The value chain options range from
revenues of ~ EUR 70 billion world- providing, e.g., autonomous goods
wide in 2015. The global market for vehicles (AGV) or courier bike compo-
autonomous delivery vehicles has the nents and systems to operating these
potential to reach a size of services (on behalf of logistics play-
EUR 2.5 billion by 2025. The number ers) or adjacent/supporting services
of delivery vehicles is expected to (charging, maintenance, financing,
grow by 36% by 2030 to 7.2 million in remote operations).
the top 100 cities.
Future structure/competition
Technology
Currently, we predominantly see
In the future, autonomous vehicles smaller players driving the innovation in
are expected to provide two-thirds of tech-driven niches; but larger logistics
B2C deliveries in developed countries. players such as Amazon and DHL start to
Drones and droids will change niches invest in dedicated form factors.
of last-mile delivery until 2025 – and
in the long run, AVs and robots will
revolutionize it. We will also see (e-)bike
couriers for instant deliveries.
Energizing mobility’s future 41Value chain and investment opportunities In last-mile logistics there are different business areas which cover a wide range of use cases – from deferred delivery (arrives some day) and time-definite delivery (arrival next/specific day and time), through same-day delivery (arrival on same day) and instant delivery (delivered right away – less than ~ 2 hours), to B2B store delivery and B2B full truckload/less-than truckload delivery. In addition to the use cases, the “type” of package delivery can vary from relative light-weight courier or parcel to food and drink (e.g., bar- rels of liquid) requiring different performance specifications of the vehicle. Across these business areas multiple services and innovative business models are think- able. Players can focus on developing rerouting software and/or software to fully integrate different last-mile goods transportation options into existing systems. Companies could also support and deploy EVs, especially where they have not reached TCO parity yet. Other options are to improve space utilization (moving less “empty space”), developing new form factors, e.g., for cargo e-bikes or to combine people and goods transport to increase fleet utilization. Another angle could be to support the pooling of load, e.g., based on connectivity and advanced analytics. Players could also develop their business in operating e-cargo bike logistics services, parcel boxes/shops, or trunk and office delivery services. The market for urban last-mile deliveries will grow by 78% through 2030. This is driven by customers (2.1 billion people will buy online by 2021 – e-commerce with 20% market share by 2023), products (e.g., 45% of furniture will be sold online by 2030) and delivery options (20 to 40% growth in same-day delivery, 10% growth yearly in instant delivery). Today, delivery is not a self-standing business, but only one step in the value chain of larger retail, fulfillment, and logistics businesses. This will change going forward, driven by technology – also to reduce the negative impact that would come along with the growing last-mile business. 42
Energizing mobility’s future 43
Mission-optimized vehicles – impact across 3P principles

        Planet                                     People

Energy demand                             Accessibility

A more efficient design architecture      Mission-optimized vehicles generally
of mission-optimized vehicles helps       reduce costs. This is due to their use-
reduce energy demand. For example,        case-focused design and specifications.
car-sharing vehicles focused on urban     In turn, these savings could be trans-
areas need less power than average        lated into lower costs and thus into
vehicles and can therefore use smaller    increased accessibility for customers.
motors.

                                          Health
Emissions
                                          Electric drivetrains reduce emissions
Mission-optimized vehicles generally      and therefore bear health benefits for
feature electric drivetrains and there-   citizens, especially as many mission-
fore reduce emissions compared to         optimized vehicles address urban use
ICE-powered alternatives.                 cases (e.g., delivery bikes, electric ver-
                                          tical takeoff and landing [EVTOL]).

44
Profitability Market demand Business model/GTM Car-sharing vehicles could account for Across mobility/transport modes, up to 28% of vehicle sales in 2030 in multiple business models regarding medium- and high-disruption scenar- component and vehicle production are ios. With more than 4.5 million Uber possible. Mission-optimized vehicles and Lyft drivers globally, sharing-op- could target, for example, the USD timized vehicles would already have a 190 billion “base vehicle” market for significant market today. autonomous vehicle operations. Technology Future structure/competition There are many opportunities to Within markets, startups today often address for mission-optimized vehicles, lead the development with support always including technological dimen- from incumbents – e.g., electric-plane sions. One example are electric planes systems are developed by startups for which the key technological chal- together with Rolls-Royce or Airbus. lenge to address is energy density (batteries having a ~ 50x lower energy density than kerosene). Energizing mobility’s future 45
Value chain and investment opportunities

Mission-optimized vehicles could play a significant role in different mobility use-
cases – with opportunities in many of those. For two-/three-wheelers and micro-
mobility, there are opportunities for manufacturers of cargo e-bikes/tikes for
urban deliveries, or by electric delivery fleets. For cars and shuttles, concepts for
shared shuttle services (especially for lower speed) or for shared shuttle opera-
tions could be promising. For longer distances, sleeper buses which replace planes
could be an alternative. In commercial vehicles, “street-scooter”-like delivery vehicles
could be an investment opportunity; in rail, intelligent freight cars for autonomous
repositioning – or even a hyperloop for people and goods are thinkable. In marine
environments, electric cargo tugs and tenders for containers would be an alternative –
and in the air, electric regional jets (for less than 50 passengers) or electrical vertical
takeoff and landing (eVTOL) vehicles could be an alternative in urban areas. In con-
struction/utility and off-road use, AV mining trucks and connected equipment are
potential investment areas.

The market demand exists across all dimensions of vehicles described above – in the
following we will concentrate on mission-optimized vehicles for car sharing.

Car sharing is a growth industry, accounting for up to 28% of new vehicles by 2030 –
at the expense of private-use vehicle sales. Players have different options in this field:
they could set up a dedicated shared-mobility platform, they could build a stand-
alone purpose-built vehicle; or they could build a shared mobility variant of existing
vehicles. All these options are already feasible today. The bottom line is that these
vehicles could be operated at about 15% lower cost than conventional ones. At the
same time, they could provide a superior experience for users and an improved value
proposition to win new drivers.

46
Energizing mobility’s future 47
4    Energy provision
     infrastructure

48
Putting EVs on the road is only one part of the solution to reduce GHG emission from road transport. In order to make transport sustainable, the energy provision infrastructure must “grow” with the uptake of EVs – based on renewable energy. Energizing mobility’s future 49
Electric charging infrastructure –
impact across 3P principles

        Planet                                     People

Energy demand                             Accessibility

The energy demand will increase to        A better charging infrastructure
65,000 GWh in 2030 to support the         increases accessibility and is hence
required fleet of EVs to reach the        critical for users who cannot charge
EU emission targets for 2030. An          vehicles at home – and therefore also
improved charging infrastructure          constitutes a strong social component. In
helps decrease the required standard      China, for example, public charging will
battery size, thereby reducing the need   deliver around 80% of total EV energy
for energy-intensive mining and bat-      by 2030, up from 60 to 70% in 2020.
tery production.                          Moreover, a large charging network
                                          is required to enable longer- distance
                                          travel, e.g., trips of more than 100 miles,
Emissions
                                          which represent 3 to 6% of total trips.
With that, a better charging infra-
structure also reduces indirect CO2
                                          Health
emissions through increased prolif-
eration of BEVs, as it helps reduce       This leads to an indirect reduction of
range anxiety – one of the most           pollution by enabling more EVs on the
important factors limiting customer       road, thus replacing ICEs.
acceptance of EVs today.

50
Profitability Market demand Business model/GTM There is a significant revenue poten- There is a multitude of potential tial from charging solutions given the customers in B2B and B2C markets increasing demand. The total number for both hardware and software of charging points required by 2030 solutions. The opportunities range could reach ~ 46 million globally, with from platform player and support- ~ 15 million in Europe. The necessary ing services (e.g., asset installation capex sums up to ~ USD 17 billion. or maintenance) to more asset- Public chargers (including, e.g., in heavy investments in infrastructure. retail locations) will play an important However, network density is a critical role, with home charging being most profitability driver across most busi- important in the US and Europe. ness models. Technology Future structure/competition Faster charging technologies (DC) Charging station suppliers are made will help address range anxiety, but up of a mix of established hardware charging speeds are limited by a providers and startups, with some fleet’s in-vehicle technology rather players cooperating with OEMs to gain than charging point technology. AC market access. Charging service provid- will remain the most used charging ers often come from the utility or the type (~ 55 to 80% depending on oil and gas sector, with startups again region). New technologies such as entering the space. wireless charging are likely to gain importance from 2020 onwards but remain less used compared to other methods. Energizing mobility’s future 51
Value chain and investment opportunities

There are numerous investment opportunities along the electric charging infra-
structure supply chain – from charging point suppliers (technical development,
production, sale) through charging point operators (installation and maintenance,
operations, data management, billing) to charging point providers (roaming clearing
center, energy and location services, information services).

ETM could support the development of two-way charging hardware to increase the
share of vehicle-to-grid (V2G) operations. There is also room for improvement of the
overall charging network structure by increasing the density of the strength of the grid.
Finally, design improvement could be implemented to boost attractiveness and usability
of charging points in both private and commercial use.

In charging point operations and service provisions, players could offer mobile top-
ups (such as NIO does in China), and ETM could also support B2B companies that
provide installation, monitoring, and maintenance services of chargers to increase
uptime and availability. There is also potential in engaging in energy trading by using
V2G technologies or energy storage systems. One of the main pain points for EV
users today could be addressed by creating a platform solution to integrate multiple
charging providers and payment options “under one roof.” In this respect, an accurate
mapping of available charging points including their status and the opportunity to
book charging slots would be highly welcomed by EV owners.

There is a consistent connection between charging infrastructure and EV market share.
Markets with higher EV share such as Norway, Sweden, the Netherland or China all have
a superior charging infrastructure. Based on the EU goal to reduce CO2 emissions from
transport by 37.5% by 2030 (compared to 2020), around three million charging stations
will be required to support the buildup of the EV fleet. However, the optimal setup will
depend on consumers’ charging patterns and technological progress (e.g., charging speed).
Players hence need to take an ecosystem view given the many moving targets, such
as EV adoption rate, consumer charging profile, and charging location preference. A
successful network will cover all relevant use cases, from home charging to work or
destination charging as well as on-the-go charging. Each of those charging solutions
requires a dedicated setup (e.g., charging speed, billing). There will be significantly different
charging behaviors across regions: whereas 44 to 64% of charging will happen at home
in the US, this number goes down to 28 to 40% in Europe, and even to 9 to 13% in China.
Consequently, Europe needs some 15 million chargers by 2030, with around USD 17
billion capex investment (without generation and grid upgrades).

52
You can also read