AUTONOMOUS OCEAN CLEAN-UP DEVICES WITH ENERGY HARVESTING - OpenEI
←
→
Page content transcription
If your browser does not render page correctly, please read the page content below
US. Department of Energy
 Marine Energy Collegiate Competition
 Powering the Blue Economy

AUTONOMOUS OCEAN CLEAN-UP DEVICES
 WITH ENERGY HARVESTING
 Business Plan and Preliminary Technical Report

 Team Lead: Jianuo Huang, Lara Kornblut
 Emma Desmond
 Ishan Pradhan
 Jack Goewey
 Jeff Grasberger
 John Lebron
 Jordan Moquillaza
 Jack Palmer
 Jack Tribble
 Jiajun Zhang
 Linda Nguyen
 Sam Janousek
 Xian Wu
 Zhaoheng Chen
 Zhao Yu
 Lead Advisor: Dr. Lei Zuo, Dr. Feng Qian

 Virginia Polytechnic Institute and State University
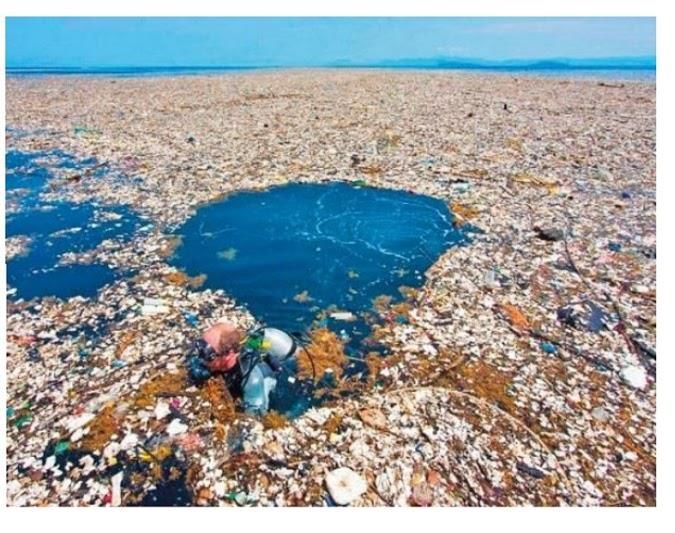
Executive Summary
There are over 5.25 trillion macro and micro pieces of plastic in the ocean. This pollution costs the global
economy trillions of dollars per year and endangers all marine life. Researchers estimate that the societal
cost of ocean plastic debris is around 2.5 trillion USD annually. This huge cost means there is a huge
potential market for ocean clean-up. Currently, most ocean cleanup efforts are done manually onshore, but
this method is very costly. The rising need to remove and recycle the offshore garbage has inspired our
team to produce the concept of an ocean-energy-powered autonomous garbage-collection boat, which we
hope will bring a change to the current market.

This autonomous self-powered plastic collection boat harvests energy from waves and currents using a
unique passive-pitch-angle-control hydraulic turbine to power the collection of offshore garbage. The
hydropower turbine produces 70 kilowatts of power, which is more than enough to drive the boat and power
the collection mechanism. This system collects ocean debris with more efficiency and less cost than
traditional methods.

Governments and environmental agencies around the world are directing billions of dollars to assist the
removal of plastics that can provide assistance and funding for our proposed device. Right now, there are
not many ocean cleanup companies taking advantage of this burgeoning market. With significant funding
from a variety of sources, our team can fully establish the device as a unique and important part of the
marine debris cleanup industry.

1. Background
Every year, around 8 million tons of plastic debris makes its
way into the ocean (National Ocean Service, 2020). At the
current rate, the weight of plastic in the ocean will surpass the
weight of fish by 2050 (Rachel, 2019). This gargantuan
amount of plastic in the ocean already has devastating effects
on both the environment and the economy. The global
economy loses up to 18 billion US dollars due to marine plastic
pollution (Aziz, 2020). The impact on the environment and
human health is a major concern of plastic pollution. The
contamination of coastal water causes around 250 million
clinical cases of human diseases each year. Plastics in the
ocean kill 100 million marine animals annually. When
 Figure 1. Pacific garbage patch
combatting this disaster by cleaning up the oceans, it is
imperative to utilize clean energy (such as ocean energy) because Climate Change has unlimited potential
to cause economic and environmental harm. Ocean energy stores in the form of wave, current, tides, and
heat to meet the total worldwide demand for many times over (Takahash, 1996). However, ocean energy
deployments are proceeding at slower pace than expected and ocean energy market is still to be established
(Magagna etc., 2015).
2. Concept Overview
While many existing ocean cleaning projects rely on gas powered boats and manned collection, these
methods are inefficient and costly. Our team is proposing an ocean-energy-powered autonomous garbage-
collection boat consisting of an ocean wave energy harvesting turbine and a garbage collecting boat.
Although similar concepts exist, the specific mechanisms employed are unique to this design.
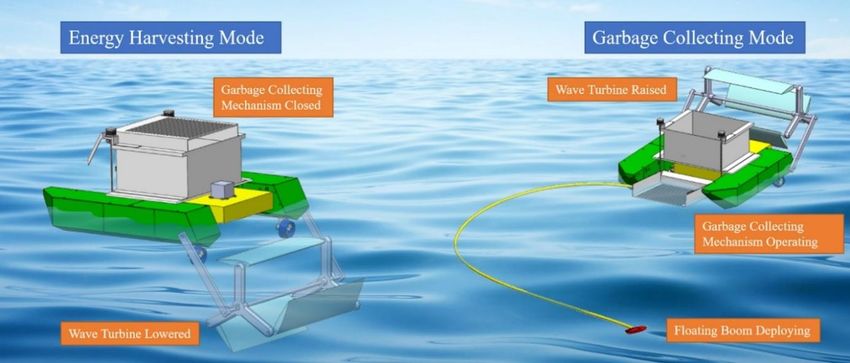
Figure 2. Ocean-energy-powered autonomous garbage-collection boats; Left: Idling and harvesting
 energy; Right: Collecting Garbage
The turbine mounted on the boat harvests energy from ocean waves when the boat is idling. Unlike
traditional hydroelectric turbines which are powered by the flow of water, the wave turbine can convert the
oscillating wave motion into a unidirectional rotation by its special hydrofoil blade design. This novel
turbine concept provides a practical on-board energy harvesting solution and is worth being further studied
in the future because of its potential as a non-traditional ocean energy harvesting device.
Meanwhile, the garbage collecting system is an autonomous, with an active floating boom which can direct
garbage into the collection mechanism. Each time the device is cleaning the ocean surface, an active boom
will be deployed around the target cleaning area. Then a motor winch on the main collecting boat will be
used to bring back the boom and any garbage in the circled area. This garbage collecting boat is designed
to be as energy efficient as possible. The most common ocean debris cleaning methods are boats with
garbage pickup mechanisms, and passive floating boom garbage traps. The team identified advantages from
each method and designed this combined system which can balance between energy and collection
efficiency.

 Table 1. Target Specification of a Full-Scale System
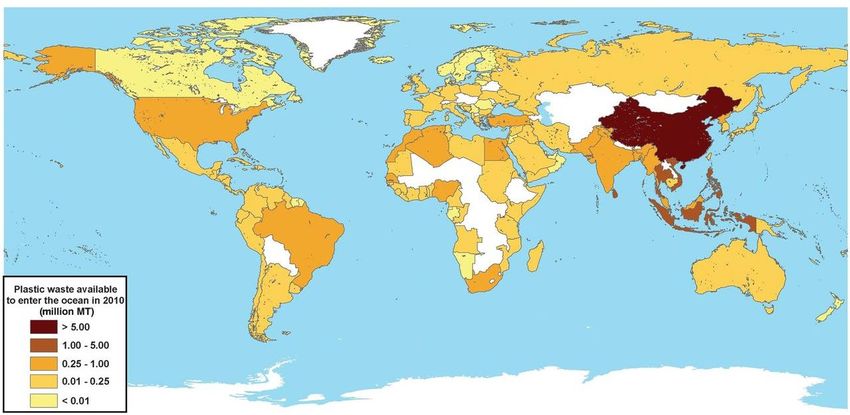
3. Market Opportunities
 3.1 Problems and Needs
Plastic pollution harms the global economy as well as the environment globally as shown in Figure 2.
According to a 2019 study, the societal cost of ocean plastic is $2.5 trillion a year (Beaumont, 2019). A
separate study estimates the natural capital cost of plastic debris from consumer goods to be $75 billion a
year (The Ocean Cleanup, 2020). Companies face a huge amount of risk due to the possibility of incurring
this cost. Legislative changes to force companies to pay for the damages they cause, which are being
considered by some governments, would further generate significant funds for cleaning up the oceans. An
additional $13 billion in damages is caused to marine ecosystems due to pollution from litter. Because
trillions of potential dollars in damages could be saved through ocean cleanup, there is potentially an
extremely large market value.

Figure 3. Global map with each country shaded according to the estimated mass of mismanaged
 plastic waste [millions of metric tons (MT)] generated in 2010 by populations living within 50
 km of the coast. (Jambeck etc., 2015)
Furthermore, plastic debris in the ocean negatively impacts industry. Boats and fishing nets of the fishing
industry are damaged or destroyed by encountering debris. The amount of fishable stock decreases as
ecosystems are destroyed by marine plastic. Ocean plastic pollution also negatively affects the tourism
industry. One study of tourist locations in Alabama, Delaware, Maryland, Ohio, and California estimates
that hundreds of millions of dollars are lost due to plastic debris affecting the beauty of the areas or
disrupting water sports. Furthermore, states and localities are forced to spend money to clean up beaches.
For example, in the United Kingdom, $24 million a year is spent to remove litter from beaches and most of
the money is spent on labor (Snowden, 2019). Our solution for ocean cleanup could mean large savings for
the fishing industry and increased profits for businesses in beach tourist areas.
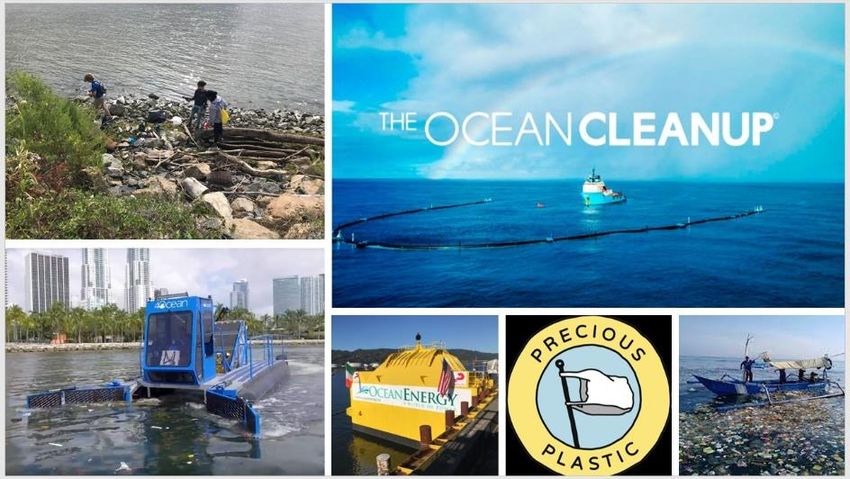
Besides the damage caused to the global economy, plastic pollution is also seriously affecting both human
health and the environment. The medical and health
cost of plastic pollution in the ocean is about $16
billion every year. Almost all marine animals ingest
plastic throughout their lives and North Pacific fish
specifically ingest 13,000 tons of plastic each year
and the majority of fish consumed by humans have
already ingested plastic. Not only are the lives of fish
at stake, but also the people that rely on the fish for
food are thereby ingesting harmful plastics. Coral
reefs, which house around a quarter of marine life,
have an 89% chance of dying when they come in
contact with plastic debris. Marine birds are also
impacted with more than 90% of all seabirds are
found to have ingested plastic. More importantly, the
amount of plastic waste in the ocean keeps increasing
radically as seen in fig.4. The potential of Figure 4. Estimated mass of mismanaged plastic
governments and companies recognizing and waste (millions of metric tons) input to the ocean
addressing the various damages caused by ocean by populations living within 50 km of a coast in
plastic pollution means that there is a huge 192 countries, plotted as a cumulative sum from
unrealized market for ocean cleanup. 2010 to 2025

While some companies are attempting ocean-cleanup, traditional methods involve either hiring laborers to
clean-up beaches, or using fuel powered vessels to collect garbage in the water. Both methods are not cost
effective and burning fuel to collect debris is an unsustainable solution. There are also new products being
developed which passively collect loose garbage found on the ocean surface. These unpowered vessels may
be environmentally sustainable, but they are inefficient when it comes to collecting trash.

Our device will succeed in this market for ocean clean-up by leveraging the advantages of a self-sustaining
autonomous system that harnesses energy from the ocean. This system has greater sustainability and a lower
cost of maintenance than traditional ocean cleanup efforts in addition to being more effective at collecting
trash. Ocean energy harvesting, whether thermal or mechanical, is completely renewable, non-invasive at
a small scale, and reliable. As such, the system operates safely and consistently to aid in ocean cleanup. A
successfully commercialized ocean powered product will be a valuable and marketable asset as we seek to
remove harmful and costly plastic pollution from our oceans. By accessing the vast amounts of mostly
untapped energy stored in the ocean through waves, this device is both a cost-efficient and sustainable
solution.

 3.2 Target Market and Market Projection
We will target the marine debris removal market. A wide variety of entities wish to mitigate plastic pollution
within our waterways, and the versatility of our product will allow us to target multiple parties. The key
entities within this market are local and federal governments which seek to remove pollution from marine
environments, environmental protection associations, and companies searching for recyclable materials. By
targeting such a diverse market of potential users and stakeholders, the product can be most profitable and
have far reaching impacts on the environment.

A few companies within the market are The Ocean Cleanup and 4Ocean (which are further described in
Section 4.3). Although there is not much direct profit from ocean cleanup, there are other approaches for
profitability of our product. For example, most of The Ocean Cleanup’s work has come from donations.
The donors include Deloitte, Macquarie, Boskalis, Maersk, a few other companies, and individual donors.
The partnering corporations seek to improve society and improve public relations. Maersk has cited both
the protection of marine ecosystems as well as their unique position to aid in the mapping of the oceans as
important reasons for partnering with The Ocean Cleanup. Regardless of funding, the knowledge base and
support that the large corporations could provide would be invaluable. Deloitte has spent almost 8,400 of
its own paid hours working with and assisting The Ocean Cleanup (Jorg, 2021). The Ocean Cleanup has
also generated around $2.2 million thus far through crowdfunding campaigns alone. We will follow The
Ocean Cleanup’s lead and target companies and charities for donations to receive funding.

As the plastic pollution in our oceans steadily increases, the already heavy cost on our economy is increasing
as well. According to Waste 360, each year there are 8 million more tons of plastic entering the oceans each
year. The cost on the global economy is about $30,000 per ton of plastic debris (Waste360, 2019) According
to this study, the cost of plastic within our oceans on society is estimated to be over $2 trillion per year.
With such a cost, there is a rapidly growing need for plastic pollution cleanup. Our device will target this
massive potential market. Already, the US government spends about $11.5 billion per year to collect plastic
pollution (Kim, 2019), a number that will only increase as more plastic enters the oceans. Most of the funds
related to trash cleanup are spent on missions requiring high fuel costs and expensive labor. Ultimately, our
device can successfully enter the large and diverse market by leveraging its ability to reduce both labor and
fuel costs.

 3.3 Competition
Ultimately, the current competition is not very extremely strong. From a marketing standpoint, clean-up
products, such as this prototype, are currently in the introduction stage of their product life cycles. Producers
of clean-up devices expend resources on awareness (advertising) and sales grow minimally. A strong
market simply does not exist yet in which a plethora of homogeneous, competing products are present.
However, the large Ocean Cleanup organization and several smaller, comparable clean-up companies could
pose as competition. Several smaller companies are also producing autonomous clean-up devices albeit
they are mostly differentiated products. A breakdown of the competition can be seen in the table below.

 Table 2. Main competition in the market.
 Company Device(s) Details (and Estimated Market Share)
 System 001 and 002 are large passive collection systems and
 System 001
 The Ocean Interceptor is a smaller active collection device. The Ocean Cleanup
 System 002
 Cleanup addresses a diverse market and therefore holds the largest market share
 Interceptor
 of our competitors (~50%)
 4Ocean uses entirely manual labor to accomplish their garbage cleanup
 Manual
 4Ocean goals. Despite expensive labor costs, they employ a lot of small-boat
 Labor
 captains in many areas (~20%)
 Small device that navigates through smaller bodies of water to collect
 Wevolver WasteShark trash. This device is relatively similar to ours but uses battery power
 (~5%).
 Fred is another small device that is used in the Pacific Ocean to collect
 Clear Blue
 Fred marine debris. This device is also similar to ours but harnesses solar
 Sea
 energy (~5%).
 Located in Baltimore, MD, Mr. Trash Wheel is more of a local project
 Mr. Trash Mr. Trash
 and does not appear to have much market share outside of the
 Wheel Wheel
 Maryland area (~5%).
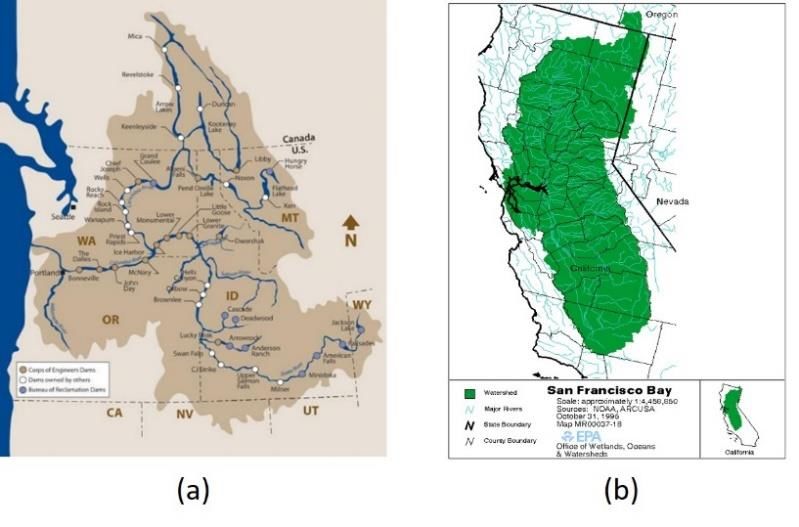
With a unique, current market, this team’s prototype may not face extensive competition; in fact, the
existing organizations and companies may prove to be allies in our introduction of this new device.
Although there are some similar smaller devices, the largest competitors, The Ocean Cleanup and 4Ocean
rely on different collection techniques and may not be significant obstructions to our introduction to this
market. Based on the market share, some of these companies can be valuable collaborators and partners
which is further addressed in Section 6. Ultimately, our device can address a relatively unique sect of the
market by being small and powered by marine energy, which will likely bode well when dealing with
competitors that may not support our infringement on their market share.
4. Target Areas
For the proposed device, it is essential for the targeted location to have both significant wave conditions
and substantial garbage accumulation. Based on these two simple requirements, there are many suitable
locations.
While one might think that the “great garbage patches” of the open Pacific and Atlantic oceans are an ideal
location to deploy such a device, it is not suitable for two reasons: first, that the density of garbage to collect
is often relatively low, and second that the “garbage patches” are composed primarily (94%) of
microplastics (plastic pieces with a diameter of less than 5 mm), which our device is not designed to be
able to collect. Our device is best suited to water bodies with higher concentrations of floating microplastics
(plastic pieces with a diameter of more than 5mm). (Laura, 2018)
With these criteria in mind, the team envisions the device being deployed to urban bays and rivers. Despite
often smaller wave conditions than the open ocean, the device would still be able to harvest its necessary
energy and successfully prevent garbage from entering oceans in the first place. The team has selected a
few prime locations: The Delaware River, Columbia River, and San Francisco Bay.
The Delaware Bay has a consistent wave height of between
0.5 and 1.5 meters (MarineWeather.net) Assuming an
average wave period of 7 seconds, the power density of the
waves in the Delaware Bay would be about 600 W/m. By just
achieving a 1% capture efficiency of the energy within
waves, our device could capture 6 W/m of power. With its
power requirements, that would be plenty to support frequent
garbage collection cycles.
In terms of garbage collection, our device would be
positioned downstream of major pollution sources (such as
cities and other densely populated areas) to intercept garbage
in the Delaware River before it can reach the ocean or spread Figure 5. Map of Delaware Bay
out into the Delaware bay. The river is estimated to
discharge over 13 million lbs. of total garbage within just a 4-year span. With proper implementation or
device could collect a significant amount of ocean-bound trash. It is very important to collect as much as
possible before it enters the Atlantic Ocean and adds to the already immense Atlantic Ocean Garbage Patch.
The ideal location would be after major pollution sources in the flow of the river, but before the river
becomes too wide as it empties into the bay. This is to ensure that it will intercept as much garbage as
possible after it enters the river as well as to collect the garbage before it disperses into the larger area of
the bay.
Two other locations that have been identified
as ideal for this device are the Columbia
River and San Francisco Bay. Both of these
watersheds also struggle with large amounts
of pollution due to their large populations,
endangering the local environments along
with the Pacific Ocean. The watersheds for
these two locations are displayed below and
clearly indicate the extensive areas from
which trash flows. By reducing trash output
from these areas, the entire US contribution
to the Pacific Ocean Garbage Patch can be
significantly decreased. Similar to the
Delaware Bay, these locations offer
 Figure 6. (a) Map of Columbia River; (b) Map of San
significant wave heights at their respective
 Francisco Bay
mouths, meaning there is plenty of potential
energy for our turbine system to harvest.
Since our device can operate anywhere there are significant wave conditions and garbage accumulation, it
is not limited by water depth, which makes it an alternative to large garbage collecting boats in narrower or
shallower areas or even deep water. This is ideal for places such as rivers in urban areas, marinas, and bays
which are more realistic for individuals and companies to want to clean, as they are able to see the garbage
accumulation on a daily basis.
5. Potential Collaborators & Relevant Stakeholders
 5.1 Potential Collaborators
We were able to contact several companies who would potentially be willing to collaborate with us. The
nature of these collaborations ranged from the manufacture of our product and technology sharing, to
working with us to dispose of the collected garbage. These companies can be seen in the table below:
Ocean Energy was interested in our turbine design. We were
able to set up a meeting with them although this was
postponed due to scheduling issues.
Another company interested in partnering with us is Elastec,
a company which focuses on oil spill equipment, floating
barriers, and incinerators. Their manned trash clean-up boat
is deployed in the Chicago River and its surrounding deltas.
They were interested in potentially creating an autonomous
clean up module for their existing “Drop-in-pods.”
Additionally, they intended to trial our turbine concept as a
method of powering their craft. Some interest was also shown
 Figure 7. Elastic testing craft
in contractually manufacturing our product once it has
finished its stages of development.
 5.2 Relevant Stakeholders
A wide variety of parties are stakeholders in ocean plastic clean-up. Because the ocean is so integral in
economics and culture, billions of people directly benefit from maintaining a healthy ocean ecosystem.
Some key stakeholders include fisherman and consumers of fish, oceanfront tourists and businesses, marine
biologists, conservationists and environmentalists, businesses which pollute the ocean, and garbage
collection/recycling companies. Ocean plastic pollution is greatly disrupting marine ecosystems, reducing

the number of fish available for fishermen. Many fish also accidentally ingest plastic in the ocean which
greatly reduces the quality of fish for consumption. Ocean plastic can also damage fishing vessels. Ocean
plastic pollution is unsightly and therefore harms tourism. Tourists are affected by the reduced beauty of
marine areas, and businesses that rely on tourism to these areas are negatively impacted by this effect.
Businesses which pollute the oceans cause billions of dollars in damage, but current legislation does not
require them to pay for these damages. The threat of new legislation that imposes penalties to account for
the billions of dollars of damage makes polluting businesses an important stakeholder. Garbage collection
or recycling companies could benefit from sources that come from the ocean.

 5.2.1 Virginia Tech
Virginia Tech is the school sponsoring this team, so they are invested in the success of this project. This
includes professors, labs, and other resources utilized in the process of this project. The university can help
promote this prototype and develop it fully. From there, Virginia Tech has the connections necessary to
launch the final product into the market.

More specifically, the team can utilize the experience and resources available within the Center for Energy
Harvesting Materials and Systems (CEHMS) and marine energy expert Dr. Lei Zuo to further develop the
design and complete wave tank tests on prototypes. These connections will aid the team in advancing design
and preparing for marketization.

Additionally, the Virginia Tech Chemistry and Green Energy departments have also shown interest. The
chemistry department is working on plastic research, while the green energy department is interested in
green energy production.

Furthermore, the team intends to participate in outreach with waste management facilities in Blacksburg,
including Montgomery County Solid Waste Authority (MRSWA) and Blacksburg Recycling. We will also
maintain working relationships with environmental organizations on campus, such as Protectors of the
Watershed, a Virginia Tech organization dedicated to picking up, sorting and establishing alternative
methods to deal with plastics.

 5.2.2 End Users
The target customer for this product is trash clean up companies and government agencies such as NOAA,
EPA, DOE, and the Fish and Wildlife services. Some subsidiary target companies would be ocean energy
focused companies such as Ocean Energy.
 Table 3. Potential Collaborators and Interest Type

The major waste management sources would come through collaborations with potential companies listed
above. These companies have pre-existing infrastructure in place to dispose of our primary waste, plastic.
For example, Recycle Build and Precious Plastics take trashed plastic and recycle them into products that
can be used again. 4 Ocean makes bracelets and other accessories sold for profit. If these options fail the
gathered waste can be incinerated as a last resort.
The device has two main categories of end users: those focused on cleaning up bodies of water, and those
focused on collecting recycled plastic for manufacturing purposes. Organizations that may be interested in
cleaning up bodies of water would likely include local governments and environmental agencies. One
example is Delaware’s Department of Natural Resources and Environmental Control (DNREL), which
manages the Delaware Bay and surrounding areas, a place that has been struggling to control its plastic
pollution. Not only does the Delaware Bay have a need for trash cleanup, but it also has wave conditions
that would be suitable for our device. By working with and marketing to local marine cleanup organizations
such as the DNREL, the team can create a network of local end users focused on cleaning bodies of water
throughout the US.

4Ocean has committed to collecting one pound of trash from the ocean, beaches, or rivers for every product
they sell. 4Ocean hires its own employees (such as ship captains) to collect trash as a full-time job. The
products they sell are made from recycled materials, some of which come from their collection. This
business could greatly benefit from our device. Being able to collect trash autonomously will cut down
labor costs, allowing the company to increase their profit margin or clean up more trash from the ocean.
The Ocean Cleanup is a non-profit organization that develops marine technologies that helps reduce ocean
plastic throughout the world. Their goal is to eliminate 90% of the world’s ocean plastic waste. They also
recycle plastic into marketable products, so that the profits can be used towards the continuation of the
cleanup. As an organization that also focuses on plastic collection, our autonomous device would be
beneficial.

We have also identified multiple organizations that utilize recycled materials for their manufacturing
processes. The use of recycled materials can allow a company to receive federal incentives as well as target
the sustainable consumer market, which is rapidly growing at a rate of 5.6 times faster than the average
consumer market. Specific companies that we can target include Precious Plastics and Recycle Build. These
companies seek to reuse old plastics to manufacture new products and may be able to benefit from the
plastic collected from our device.

 Figure 8. Potential end users and collaborators and their work

 5.2.3 Federal Agencies

Federal agencies control and regulate many environmental issues including the plastic waste in the oceans.
Organizations such as the NOAA, EPA, DOE, Fish and Wildlife Services, and the US Coast Guard will be
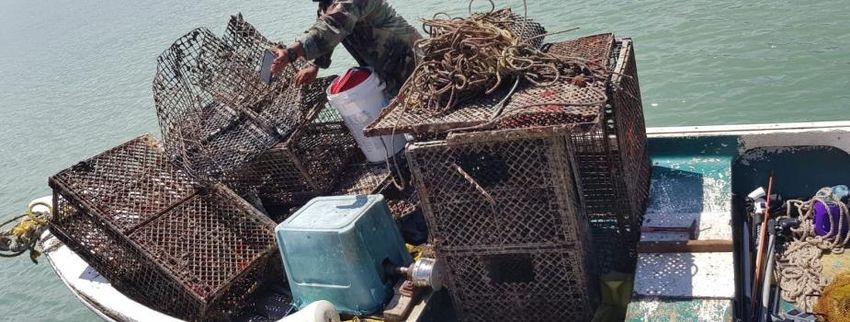
able to assist the launch of this device into action in order to help pull plastic out of the ocean from a
governmental level.

One possibility for assistance from a federal agency is NOAA’s Marine Debris Program (MDP). This
program seeks to address five main pillars with regard to marine debris: removal, prevention, research,
regional coordination, and emergency response. Marine debris is defined as any persistent solid material
that is manufactured or processed and directly or indirectly, intentionally, or unintentionally, disposed of
or abandoned into the marine environment. Our device would ideally fit the removal category as it would
directly remove debris in the form of plastic pollution from US bodies of water. Within the MDP’s strategic
plan for 2021-2025, one primary objective is to support at least 40 different marine debris removal projects.
One such project supported within this category is depicted in figure below in which a man removed old,

 Figure 9. Derelict Fishing Gear Removal in the Caribbean (The Ocean Foundation and Conservación
 ConCiencia, 2021)

harmful fishing gear near Puerto Rico. By aligning with this objective, our team can receive similar support
for the further research and marketing of our device, allowing us to quickly enter the market and begin
removing debris.

 5.2.4 Environment Protection and Trade Associations
There are several environmental protection associations which can be of assistance to our team as we seek
to establish ourselves within the ocean cleanup market. These include the Environmental Defense Fund,
the American Rivers group, and the Natural Resources Defense Council. These organizations provide
regulation and directives that will allow the team to understand and succeed within the ocean cleanup
industry.

Similarly, trade associations are organizations that regulate specific industries and often provide important
resources to stakeholders within those industries. Although there are no current trade associations within
the ocean cleanup market, the renewable energy market has many such organizations. The most applicable
associations are the National Hydropower Association, the Marine Renewable Industry Association
(MRIA), and the National Ocean Industries Association. Each of these organizations provide the team with
important standards to follow when developing and implementing the energy harvesting system.

 5.2.5 Department of Energy

A project such as this is difficult to accomplish without support through government funding. The costs of
designing and verifying the novel wave energy converter technology may not be fully outweighed by the
limited funds brought in from the end users. Specifically, the US Department of Energy is a prime source
of funding for similar projects. A $54.5 million initiative for Small Business Innovation Research by the
department has already seen some of its funds put towards the development and implementation of similar
wave energy converters (Anela, 2020). With a similar renewable device and its plastic pollution benefits,
our product would also be a candidate for some of this funding. Another initiative that may be able to supply
funding is the US Testing Expertise and Access to Marine Energy Research Program run by the Water
Power Technologies Office. The program is set up to provide the resources and support needed to test
marine energy devices, something that would be extremely useful when constructing a full-scale prototype.

6. Development Plan and Business Strategies
 6.1 Strengths, Weaknesses, Opportunities, and Threats (SWOT) Analysis

 Figure 10. SWOT analysis for ocean-energy power garbage collecting boat

To initially help the team assess our value proposition and create future business development plans, a
SWOT analysis was conducted which is displayed in the figure above. Our strengths include the technical
design of our turbine being capable of harvesting power constantly from waves. It is cost efficient and more
sustainable than traditional devices. Our team will be able to approach garbage pollution at a larger scale
because our device will widen up the scope of locations that it can be used in which gives us more
opportunities for distribution. Another opportunity identified is cooperating with our competitors and global
organizations to help other countries/governments obtain our product. Our weaknesses are being new to a
market that is not well-established yet in the United States with a new product design and development.
There is a barrier to entry that makes it difficult because there are not many incentives available, however,
the benefits of our device will provide potential incentives across all interests involved in ocean clean-up
efforts.
Using the SWOT analysis, the team successfully identified important aspects of our product and the state
of the current market. From this analysis, the development plan was organized within the next sections to
cater our product’s strengths toward the opportunities within the market and keep in mind the product’s
weaknesses and market threats.
 6.2 Development Plan
The upcoming marine energy market is a quickly shifting industry. Hence, both marketing and technology
must be tackled at the same time. Through creating mutually beneficial long-term relationships early we
intend to break through into the market in a short period of time. The table below represents our two-year
market introduction and technology development plan for achieving this.
Table 4: Two-Year development Plan

 Development Plan Schedule
 Months Technology Marketing
 Search for grant opportunities (e.g. NOAA
 Integrate and start development of turbine
 M1-M2 Marine Debris project) and collaborators
 and collection systems.
 (Boat manufacturing and garbage recycling)
 Improve turbine power output and develop Research market need, identify potential
 M3-M4
 power management system customer base, Conduct Surveys
 Find manufacturing facilities and solidify
 M5-M6 Start autonomous system development
 raw material costs
 Develop prototype and high-level testing Going through small business start-up
 M7-M8
 plan process
 Start small scale advertisements, Join
 M9-M10 Assemble prototype for testing.
 technology expos
 Social media set-up, and community
 M11-M12 Test Prototype in water tank
 engagement
 Connect with potential customers. Start
 M13-M14 Prototype demos to potential customers
 working on deals
 Make modifications based on test results
 M15-M16 Research for global market
 and initial customer feedback
 Identify additional funding sources, Request
 M17-M18 Redesign to fit manufacturing capabilities
 for grants if needed
 Assemble prototype based on collaborator Secure existing relationships, send prototype
 M19-M20
 feedback models for trials
 Complete prototype real-world testing. Revise device design for market gap and
 M21-M22
 Add customizability if possible. adapt for customer base.
 Start accepting pre-orders and increase
 M23-M24 Send trial products to customers.
 advertising.

The technology side of the development plan starts with further developing both the turbine and collection
system. The integration of the two systems is key to the success of the function of the device. Thus, the
turbine must produce enough power to power the collection system and autonomous operation systems.
Assuming enough funding is acquired, an initial prototype will be built, and a high-level development plan
will be implemented. This prototype will then be tested using a water tank and demonstrated to potential
customers. The results from this initial testing and feedback from potential customers will be used to further
improve the design of the device. The device will require further modifications to match manufacturing
standards. This manufactured product will then be tested in real world conditions and sent to customers as
a trial.
Simultaneous to the technical development, the team will employ a market strategy to ensure that the
operation is economically feasible. The steps for marketization are depicted in the two-year plan, but the
strategic outlook can be described as having five planned phases. The first phase will be to secure the
economic support and partnerships that our operation will need, as well as becoming more familiar with
the market. This will involve searching for grants, establishing connections with collaborating companies,
and identifying the needs of our (potential) customers. Once these connections and background knowledge
of the industry have been established, the second phase begins: launching a company and building a brand.
In this phase, the team will officially be formed into a business, and will start to promote the project through
advertising, building a social media presence, as well as displaying the technology at expos or similar events.
At this point the team will start making proposals to companies and generating revenue. The third phase
occurs once the business has been established. In this phase, the team will evaluate the company’s financial
situation and explore additional funding opportunities as well as conduct research for implementing the
product on a much wider scale. The goal of this phase is to prepare to grow the company once the product
is fully developed. The fourth phase occurs once the product is (for the most part) fully developed, and
will involve implementing prototypes for clients, making some adjustments as necessary, before
transitioning to the fifth and final phase: advertising and selling the product to a wide range of customers.
 6.3 Communication, Cost, and Revenue
While completing the market development plan, three key factors will be thoroughly evaluated:
communication channels, cost structure, and revenue streams. The communication channels will
allow the product to reach a wide audience of potential stakeholders, the cost structure will keep the team
organized when ramping up production, and the careful consideration of revenue streams will support the
team’s overall success within the market. Each of these three key factors are explored further within the
next few paragraphs and figures.
We will consider using several channels to reach our customer segments including awareness, delivery, and
communication. We will use social media platforms, host seminars and presentations, and launch
fundraising campaigns to raise awareness. Awareness will be mainly for promoting and marketing purposes
for not only our device, but to display our objectives and visions for our contribution to ocean clean-up
efforts and the blue economy. For delivery, we want to ensure that we use our financial resources effectively
so the methods will depend on the locations being distributed to. For instance, for an international location,
we may have to make special networking considerations that may not be necessary for local deliveries.
Ultimately, we can set up a network for structure and organization for all ends involved within each
purchase. For our communication channels, we will use a data center or headquarters to track our devices
and make improvements. Emails and calls will be used to contact potential customers, partners, and
sponsors. Other communication will overlap with our social media use. A diagram outlining this
communication plan can be found in (a) below. Although we have already identified some of the costs
through our financial analysis (Section 7), it is important to identify the structure as these will need to be
adjusted to fit with any changes throughout the development cycle. Our cost structure is delineated in part
(b) of the figure 11. We will need to review the different types of costs that will be found throughout the
stages of our business development and operations including production, logistics, and sales. Production
costs will originate from the costs of materials, operations, and supply chain decisions. If we decide to
subcontract or hand off our product to another organization, then the costs will vary. Logistic costs will
depend on distribution and transportation. Sales costs will come from our marketing and advertising
activities.
In terms of the revenue stream part (c), the three main features are service fees, contracting, and funding.
The service fees include any lending or rental practices that may be implemented to support users wanting
only temporary or short-term services. Another important component is the contracting, which will provide
an option for users that want more permanent solutions to their plastic pollution. Lastly, perhaps the most
important source of revenue will be funding. The funding will come from a variety of sources including
governments, environmental protection organizations, and donations from individuals and large
corporations. These sources will be driven by the overall global push to minimize plastic pollution which
is endangering the Earth as well as the global economy. Overall, each of these revenue streams is necessary
to consider for the success of the product.
Figure 11. (a) Communication Channels; (b) Cost Structure; (c) Revenue Stream

7. Financial and Benefit Analysis
 7.1 Earning analysis and prediction
We estimate the total raw material cost to be $3,200. There will be an additional cost of around $5,000 per
unit for autonomous operation capabilities. On average this device will do the work of a skilled boat crew
per day. Based on the average salaries of boat captains and crew. Assuming a $35,000 yearly salary for the
captain and $15,000 for each of the 3 crew members this would lead to a total cost of $80,000 yearly just
in crew costs. Factoring in fuel and maintenance costs the total operating cost of a clean-up boat crew can
be expected to be north of $100,000 yearly. Based on these estimates the selling cost of our device was set
to be $20,000 An expense of $75,000 in labor, development and employee costs is expected quarterly. For
the purpose of this break-even analysis the initial development cost will be ignored and assumed to be
covered by grants and other relevant investments. Based on this break-even analysis 7 units need to be sold
each quarter to break even.

 Table 5. Predicted Financial Analysis and Sales

 Figure 12. Breakeven analysis

 7.2 Summary intro to financial analysis
We expect that the business would not be profitable for the first 3-5 years. A great deal of capital would
need to be invested in developing the device and the manufacturing pipeline. We plan to offset the great
costs through grants and donations. We will work with companies that pollute the ocean and are looking to
improve their image. We will also seek out the existing government contracts for ocean cleanup. We expect
that we will not have a device available to be sold for at least two years meaning we will require investment
during that time. Based on the break-even analysis, we must sell at least 7 units to begin making profit.
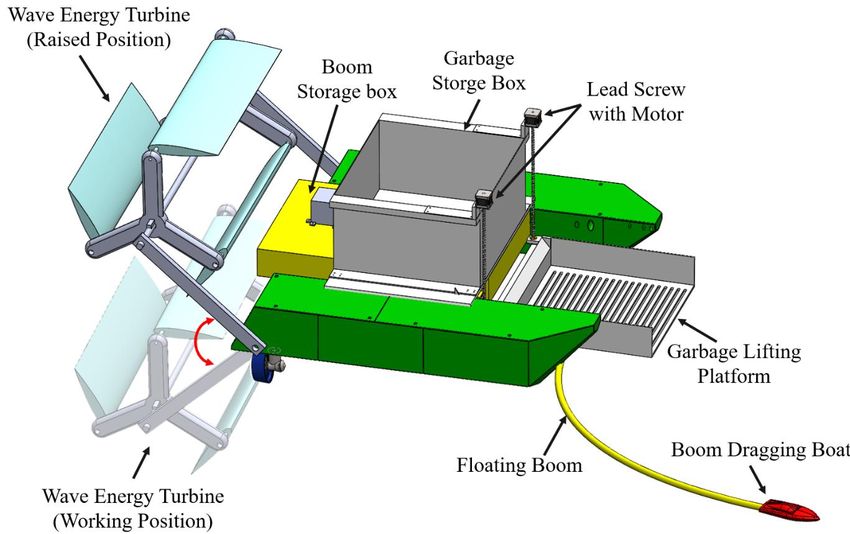
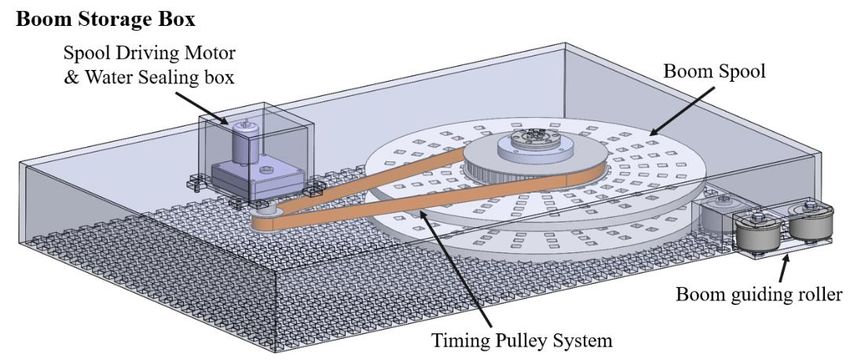
8. System Design and Development
The collection system consists of three major parts: the boat, the energy harvesting system and the trash
collection devices. Two pontoons carry the wave turbine, which charge batteries that are stored in the center
of each pontoon. The small collection boat is also charged by these batteries.

 Figure 13. Component overview of the ocean-Energy-Powered Autonomous Garbage boat
 8.1 Design of the Collection Boat
The system is driven and steered by two propellers that reside underneath either pontoon. Both the boom
storage box and the garbage storage box are meshed to allow water to drain. A meshed collection box idles
between the pontoons at the front of the boat to collect and lift garbage. The Lifting system includes:
electrical brushless DC motors, lead screws, block bearings, supporters and a rod column. It is a symmetric
design so that the supporters have the ability to move in the same velocity and direction. So that the collector
can move freely in the vertical directions.
The boom storage box (Figure 14) consists of a boom spool, motor and timing belt driving system, and
boom guiding rollers. The boom is a 30m long rubber tube that can coil up easily in the spool and floats on
the surface of the water. One side of the boom connects with the turning plate, while the other end is bound
on the small collection boat. The motor releases and retrieves the boom through the belt-pulley system. The
rollers are set at the entrance of the boom box and help the boom go out smoothly. The small collection
boat quickly navigates the boom to surround the trash.
In the Collection system, the spool dimension is identified based on the size of the boom. The selected
boom is 30 meters long with a diameter of 20mm, and the equation for calculating spool diameter is
shown below:
 2
 ∗ = ∗ (( )2 − ( ) )
 2 2
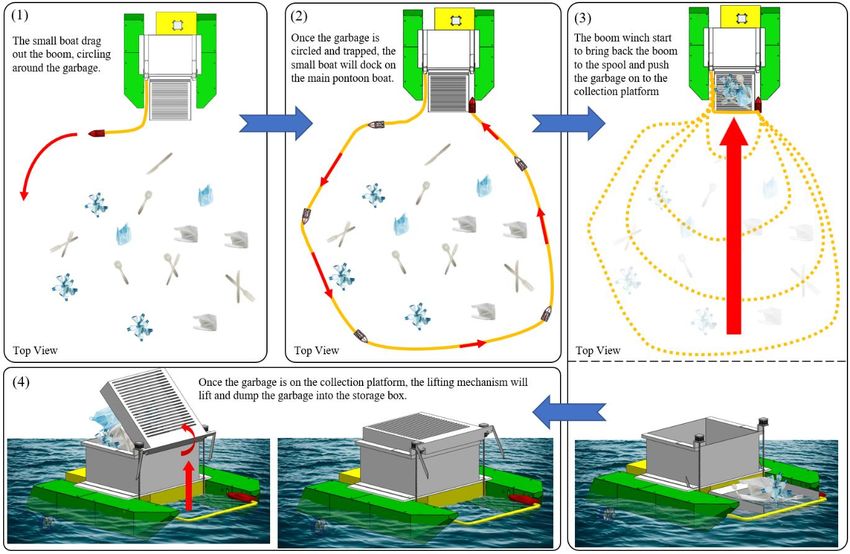
The w represents the diameter of the boom, and the l stands for the length of the boom. By taking the
spool inner diameter to be 10mm and the height of the spool to permit the boom to stack three times, the
equation result shows the outer diameter must be 500mm.

 Figure 14. Design and component of the boom storage box

As the boom retracts from the spool, the total maximum drag force on the boom is calculated with the
following equation:

 = ∗ ∗ ∗ ( )2
 2
The drag coefficient, CD, is chosen to be 1, and the maximum area creating drag, A, is 0.6m^2. The the
sea water density, is 1029 kg/m3, and the velocity is set to a maximum of 1 m/s. Thus, the maximum
resultant drag force can be expected at around 300 N. Since the radius of the spool is 25mm and the belt
system has a ratio of 1:10, the maximum torque needed from the motor will be around 7.5 N.m.

 8.2 Garbage Collection Principle
The device is to operate on a stable body of water. Once the device recognizes a large concentration of
garbage, the device will autonomously move towards the garbage. The mouth of the collection lifting
platform will face the garbage. Directly, behind the collection lifting platform is the floating boom storage
box. This is where the floating boom will be kept when not in use. Additionally, the garbage storage box
rests on top of the boom storage box. To collect garbage, a small boat will drag out the floating boom that
will encircle the garbage. Internally, the boom is driven out with a motor-driven spool. The boom itself is
guided out of the boom storage box with the help of a set of guiding rollers. Once the boom has fully
encircled the garbage, the small boat will dock itself to the pontoon boat. From here, the motor-driven spool
will slowly begin to retract, and the encircled area will decrease in size. As the area decreases, the garbage
will be pushed towards the collection lifting platform. After collecting the garbage into the lifting platform,
the motor will drive the lead screw and lift the platform vertically. When the platform reaches the top, a
stopper will stop the platform from rising and cause it to flip over, dropping trash into the garbage storage
box. When the platform needs to be lowered, the lead screw will draw the platform downward and flip it
back towards the front. This process can be repeated once the small boat has successfully undocked from
the pontoon boat. After several garbage collections, the garbage storage box can be removed of its contents
for external processing.
Figure 15. Depiction of trash collection process

 8.3 Ocean Wave Powered Turbine Design
Inspired by the Cycloidal Wave Energy Converter (CycWEC), here, we designed a wave and current turbine
with 3 hydrofoil shape blades as shown in figure 16, which is able to adjust the angle of attack of each blade
using the passive pitch angle control. Normally, the crossflow turbine can only harvest energy from either
wave (with an active pitch angle control) or
current. Here, in our design, adjusted by a
torsion spring, the turbine has the ability to
harvest energy from both wave and current
energy. While interacting with the
incoming flow, the hydrofoil can rotate by
the torsion spring to the optimum angle of
attack to achieve the best performance,
which is so called the ‘passive pitch angle
control’. Both the 3-blades turbine and the
passive pitch angle control method are
modeled and studied in the following
chapter. Further, the performance of the
hydrofoil is studied through numerical
simulation to obtain the optimum angle of
attack and estimate the maximum output Figure 16. Three-Blade Ocean Wave Turbine with NACA0015
power. Hydrofoil shape as Blade
9. System Dynamics Analysis and Optimization In this section, we present the mechanical modelling of the ocean energy harvester (the wave turbine) based on the Newton’s second law of rotation. By balancing the torque generated from the hydrofoils, the total take-off power is well estimated. Further, a passive pitch angle control on the hydrofoils is modelled and discussed. The optimum pitch angle is chosen according to the simulation results. 9.1 Dynamic Modelling of the System The mechanical model of the 3 blades wave turbine (as shown in Figure 17) is based on the Newton’s second law of rotation, as shown in eq.1, which balances the acceleration of the turbine and the inertia with the torque caused by the tangential forces generated on the hydrofoils: 3 I (t ) = FTi R − Tout − Textra (eq.1) i =1 here I is the inertia of the turbine (with the add inertia), (t ) is the angular acceleration, FTi is the tangential force generated on each hydrofoil i due to the lift effect of the incoming flow, R is the shaft radius of the turbine, Tout is the power output torque Figure 17. Force Analysis on the (which is also known as PTO torque), Textra is the torque from Turbine Under Ocean Wave other sources (such as mechanical damping, viscous effect, and wave radiation). Further, to better model the performance of the turbine, the output power J can be defined as the time integral of the product between the rotational angular velocity (t ) and power output torque Tout : T J = Tout (t ) (t )dt (eq.2) 0 It is easy to observe form eq.1 and eq.2 that to get a maximum power output we need to get the largest torque from the hydrofoil as possible. Thus, a detailed study and modelling is needed for the hydrofoil. A lift-type hydrofoil generates the lift force FL (vertical to the flow direction) and the drag force FD (follow the flow direction) while interacting with the incoming flow, as shown in Figure 18. When the hydrofoil is applying in a wave turbine, the rotation brings more complexity in the modelling. Firstly, the velocity is not simply the velocity induced by the wave ( VW ) anymore, but the sum of the velocity of the rotational velocity of the hydrofoil ( VR ) and the wave induced velocity, which is presented in eq.3. V = VR + VW (eq.3) On the other hand, the lift force and the drag force may be not exactly in the rotation direction, so a tangential force FT is generated by the projection of these two forces: FT = FL ( ) sin( − ) − FD ( ) cos( − ) (eq.4)
where is the angle of attack (the angle between the flow velocity and the chord line), is the pitch angle (between the rotation direction and the chord direction). Figure 18. Force and velocity illustration about the From eq.4, the tangential force FT is a function of the lift force FL , the drag force FD , the angle of attack hydrofoil , and the pitch angle . According to the point source method the lift force FL and the drag force FD can be calculated using the following equation: 1 (eq.5) FD = CDV 2 S 2 1 FL = C LV 2 S (eq.6) 2 Combing eq.1 and eq.4, we can tell that it is necessary to get the maximum tangential force at the give turbine shaft radius to get the largest power output. To achieve this goal, numerical simulation is done with fixed pitch angle to find the optimum parameter. Further, a passive pitch angle control is modelled and discussed in the next subsection. 9.2 System optimization To better calculate the lift force FL and the drag force FD , as well as the tangential force FT of the chosen hydrofoil shape NACA 0015, the numerical simulation is done in ANSYS Fluent. Before getting into detail of the simulation results, the NACA 0015 hydrofoil is chosen for this study because of wide operation range and high lift generated. The shape of the hydrofoil, is generated in MAT by the following equation (with the chord length equals to 1 meter): yt = 5t[0.2969 x − 0.1260 x − 0.3516 x 2 + 0.2843x 3 − 0.1015 x 4 ] (eq.7) Where: x is the position along the chord from 0 to 1.00 (0 to 100%), yt is the half thickness at a given value of x (centerline to surface), t is the maximum thickness as a fraction of the chord (so t gives the last two digits in the NACA 4-digit denomination divided by 100). Previous studies have been done to calculate the lift force FL and the drag force FD through both numerical simulation and experimental measurement (Şahin, 2015). However, less data can be obtained with 6 our operation Reynold’s number (in the order of 10 ) to analyze the optimum pitch angle. Thus, this study used numerical simulation to obtain the lift force FL and the drag force FD of the NACA 0015 hydrofoil with the flow speed at 1m/s. To avoid the complexity of the flow separation problems (turbulent model), we only investigated the behavior in a rather small range of attack of angles. Accordingly, the results suggest an optimum attack angle in this range. However, it is worth noticing that flow separation occurs at around 13 to 18 degree according to previous study. Thus, our result is valid before the stall happens.
In the ANSYS Fluent analysis, the mesh of the hydrofoil is controlled to be denser when it is near the
hydrofoil boundary to better obtain the results. The simulation results are shown in Figure 19 with the
velocity and pressure contours at different angle of attack. From the pressure contour plots, there exists an

 Figure 19. Pressure and velocity contours with the flow rate at 1m/s (1 is for alpha = 2; 2 is for alpha
 =7; 3 is for alpha =11; a for pressure contour; b for velocity contour)
obvious difference in the pressure field caused by the difference in the angle of attack, which the principle of our unique pitch angle method. From the simulation, the lift force FL and the drag force FD are calculated with the flow rate equals to 1m/s at the given range of angle of attack, which is presented in Figure 20. The trend of the lift force FL and the drag force FD agree well with the results from previous study. With the chosen range of attack angle, flow separation does not occur yet. The tangential force FT is calculated accordingly at different value of the pitch angle, as shown in Figure 20. Figure 20. (a) Calculated lift force and drag force. (b) Calculated tangential force at different pitch angle. From Figure 21, both angle of attack and the pitch angle have strong effects on the value of the tangential force. An optimum combination of the angle of attack and the pitch angle is suggested with alpha equals to 11 degrees and beta equals to 6 degrees. With these two angles chosen, the tangential force will be the maximum in the given condition. Further, the output power will reach the maximum. However, this is for a fixed optimum pitch angle, which means no direction change of the flow velocity is considered. With a flow velocity keep changing the direction, it is necessary to keep the pitch angle changing accordingly to get the best performance. It is more complex in real application than theoretical modeling in the velocity field. Here, we are going to model it in a simplified way to better illustrate. First, for the relative rotational speed, we consider the position of each hydrofoils concentrating at their centers (with i = 1, 2,3 ): xi (t ) = R cos( (t ) + 2 (i − 1) / 3) (eq.8) yi (t ) = y0 − R sin( (t ) + 2 (i − 1) / 3) (eq.9) Then, by taking the time derivatives of the position, we can obtain the rotational velocity in each direction: (VRi ) x = − R (t )sin( (t ) + 2 (i − 1) / 3) (eq.10) (VRi ) y = − R (t ) cos( (t ) + 2 (i − 1) / 3) (eq.11)
Thus, the relative rotational velocity used in eq.3 and Figure 18 is the verse vector of this rotational velocity. As for the wave induced velocity, here we are using the Airy wave theory, which is also known as the linear wave theory. It gives the velocity potential in the form of: Hg ky W ( x, y, t ) = e sin(kx − t ) (eq.12) 2 Where H is the wave height, is the wave frequency, k is the wave number, and g is the gravitational acceleration. By taking the partial derivatives, the wave induced velocity in each direction can be obtained as: eky gHk (VW ) x = cos(kx − t ) (eq.13) 2 e ky gHk (VW ) y = sin(kx − t ) (eq.14) 2 Combining eq.3, 10&11, 13&14, we can tell that the total flow velocity direction depends on many variables such as the shaft radius, rotational speed, and wave conditions. Thus, it requires a condition- sensitive pitch angle control method to deal with this kind of complex velocity field. Recalling from Figure 19, a significant pressure difference is observed with different angle of attack. Here, in our study, this pressure difference is used to adjust the pitch angle to achieve a better performance by adding one more rotational degree of freedom to each hydrofoil: ( I foil + I add ) (t ) = TP ( ) − k + Textra (eq.15) Where ( I foil + I add ) is the inertia of the hydrofoil with the added mass, TP is the torque induced by the pressure around the hydrofoil, k is the stiffness of the torsion spring, Textra is the torque from other sources (such as mechanical damping, viscous effect, and wave radiation). Here, from eq.15, we can see that the torque induced by the pressure serves as the excitation force in the linear vibration system, which leads the balance position of the hydrofoil to the designed pitch angle. Thus, the equilibrium condition is given as following: TP ( 0 ) − k 0 = 0 (eq.16) To better prove the dependence of TP with the angle of attack, here we plot the TP with the angle of attack as shown in Figure 21. Each angle of attack is corresponding to a specific pressure induced torque, which approves the dependence of TP with the angle of attack.
Figure 21. Torque induced by the pressure difference at different
 angle
By this concept, the pitch angle of the hydrofoil willofchange
 attack. according to the wave condition, shaft radius
and shaft rotational speed. For example, here we take the wave height Has 0.5 m, device immerged depth
y as 0.5 m, wave number k as 0.5, wave frequency as 0.1, shaft radius 0.2 m, and let the hydrofoil rotates
following the wave (same frequency). Then the total wave induced velocity from eq. 13&14 is 2.14 m/s,
and from eq. 3 (with the angle between VW and as 60 degree) the total flow velocity is 2.21 m/s. Then,
according to the simulation results shown in Figure 21, the maximum tangential force generated in each
hydrofoil is 188 N which makes a total of 564N with 3 blades. Looking back at eq. 1, if we ignore the extra
torque loss (due to the viscosity, wave radiation, and mechanical damping), the output torque the maximum
PTO torque is 112N*m. Finally, by eq.2, we can get the maximum output power as 70W.
Limited by the time of this competition and the condition through COVID, full scale simulation of the self-
rectifying pitch angle wave turbine is not finished, which can be done in the future study to better understand
this concept.
10. Risk Mitigation
The deployment of any device is never risk free. The major risks and their mitigation opportunities are
listed in the table below. These hazards can stem from a variety of reasons. Technical faults, environmental
effects, scheduling conflicts, and financial problems all add different types of risks. The probability and
impact of each risk is evaluated on a scale from high, medium to low. An overall risk score from 1 to 9,
with 9 being the highest, is assigned based on the assessment of factors. Based on the risk assessment, the
team can clearly identify where to focus resources to avoid major failures that may put the development of
the product in jeopardy. The following table shows the key risks and the risk mitigation plan for each.
You can also read