LARGE-SIZE SUB-KEV SENSITIVE GERMANIUM DETECTORS FOR THE CONUS EXPERIMENT - MPG.PURE
←
→
Page content transcription
If your browser does not render page correctly, please read the page content below
Large-size sub-keV sensitive germanium detectors
                                                                               for the CONUS experiment
                                                  H. Bonet1 , A. Bonhomme1 , C. Buck1 , K. Fülber2 , J. Hakenmüller1 , G. Heusser1 , T. Hugle1 ,
                                                  J.B. Legras3 , M. Lindner1 , W. Maneschg1 , V. Marian3 , T. Rink1 , T. Schröder4 , H. Strecker1 ,
                                                                                           R. Wink2
arXiv:2010.11241v2 [physics.ins-det] 8 Apr 2021

                                                                   1
                                                                     Max-Planck-Institut für Kernphysik, Saupfercheckweg 1, 69117 Heidelberg, Germany
                                                                2
                                                                  Preussen Elektra GmbH, Kernkraftwerk Brokdorf, Osterende, 25576 Brokdorf, Germany
                                                                  3
                                                                    Mirion Technologies (Canberra), 1 chemin de la Roseraie, 67380 Lingolsheim, France
                                                          4
                                                            on behalf of Preussen Elektra GmbH, Kernkraftwerk Brokdorf, Osterende, 25576 Brokdorf, Germany

                                                                                                       e-mail address:
                                                                                                  conus.eb@mpi-hd.mpg.de

                                                                                                          Abstract

                                                          Intense fluxes of reactor antineutrinos offer a unique possibility to probe the fully coherent character of
                                                      elastic neutrino scattering off atomic nuclei. In this regard, detectors face the challenge to register tiny recoil
                                                      energies of a few keV at the maximum. The Conus experiment was installed in 17.1 m distance from the reactor
                                                      core of the nuclear power plant in Brokdorf, Germany, and was designed to detect this neutrino interaction
                                                      channel by using four 1 kg-sized point contact germanium detectors with sub-keV energy thresholds. This
                                                      report describes the unique specifications addressed to the design, the research and development, and the
                                                      final production of these detectors. It demonstrates their excellent electronic performance obtained during
                                                      commissioning under laboratory conditions as well as during the first two years of operation at the reactor site
                                                      which started on April 1, 2018. It highlights the long-term stability of different detector parameters and the
                                                      achieved background levels of the germanium detectors inside the Conus shield setup.
                                                      Keywords: high purity germanium detector, p-type point contact, electrical cryogenic cooling, very low energy
                                                      threshold, very low background, long term stability, coherent elastic neutrino nucleus scattering

                                                  1   Introduction                                                low detector energy threshold is therefore mandatory.
                                                                                                                  Next to it, intense neutrino fluxes are still requested to
                                                  Neutrinos are highly elusive particles.       For low           benefit from a higher statistics. The most promising
                                                  momentum transfer, however, neutrinos and their                 sources are pion decay at rest (πDAR) sources and
                                                  antiparticles can elastically scatter off atomic nu-            nuclear reactors. The first type produces neutrinos
                                                  clei such that the outgoing nuclear wave func-                  (ν) and antineutrinos (ν̄) of several tens of MeV and
                                                  tions add up coherently. This enhances the prob-                of different flavors, while the second type releases ex-
                                                  ability to detect neutrinos by three to four or-                clusively electron-ν̄s with energies below 10 MeV. In
                                                  ders of magnitude compared to standard neu-                     this second case the recoil energies are in the keVnr
                                                  trino interaction channels such as elastic neutrino-            region and more difficult to detect, but the expected
                                                  electron scattering or the inverse beta decay. Even             neutrino flux at realistic distances to a reactor core is
                                                  though coherent elastic neutrino nucleus scattering             typically higher. Furthermore, the coherency condi-
                                                  (CEνNS) was predicted in 1974 [1], it has eluded de-            tion λ ' R – with λ being the de Broglie wavelength
                                                  tection for four decades mainly due to one technolog-           of the neutrino, and R the target’s nuclear radius – is
                                                  ical obstacle: the smallness of the nuclear recoil en-          better fulfilled.
                                                  ergy Enr (unit: eVnr ) released by the struck nucleus.             The first detection of CEνNS signals was achieved
                                                  Further, in certain detector types the collectible ion-         by the Coherent experiment using CsI[Na]- and Ar-
                                                  ization energy Eee (unit: eVee ) for signal processing          based detectors [3, 4] at the Spallation Neutron Source
                                                  can be quenched due to dissipation processes, which             (SNS), which is a πDAR source. A first CEνNS detec-
                                                  are typically described by the Lindhard theory [2]. A

                                                                                                              1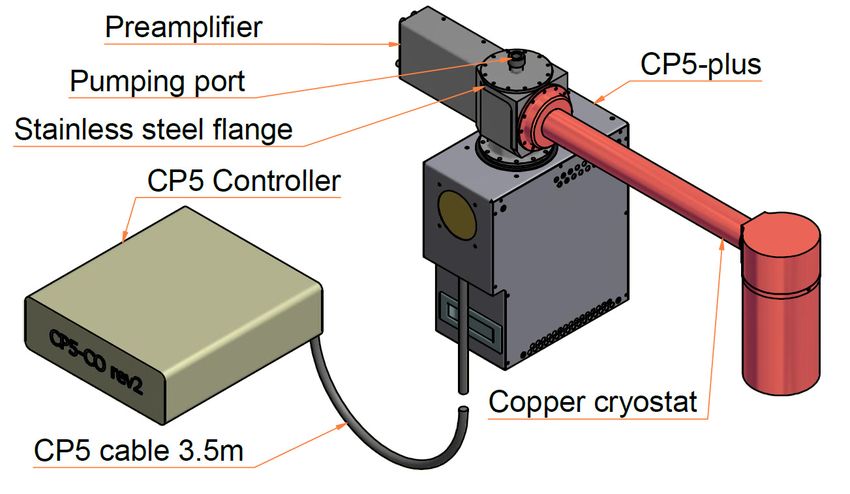
2

tion with reactor ν̄s is still pending. The Conus ex-     Eth , and the quenching factor (QF). The latter is
periment aims at detecting CEνNS using reactor ν̄s at     expressed via the quenching parameter k of the
the Kernkraftwerk Brokdorf (‘KBR’) [5], in Brokdorf,      modified Lindhard theory with an adiabatic correc-
Germany, which is a commercial nuclear power plant        tion [20, 21]. For a realistic (optimistic) Eth =300
operated by the Preussen Elektra GmbH [6]. The            (270) eVee and a realistic k value of 0.20, one expects
Conus setup is located at a distance of 17.1 m from       50 (100) counts kg−1 a−1 reaching up to 500-600 eVee .
the reactor core [7]. With a maximum reactor thermal      With a realistic background of 10 counts kg−1 d−1 in
power Pth of 3.9 GW the expected ν̄-flux at the exper-    the ROI resulting from points 4.-6. and from a shield
imental site can be calculated according to Ref. [8],     similar to that in Ref. [10], a signal-to-background
resulting in an integral flux of 2.3×10¹³ s−1 cm−2 .      ratio of 1:70 (1:35) is achievable. By fulfilling these
    Prior to its installation at KBR in January 2018,     conditions CEνNS can become observable at the
the envisaged detector technology had to be pre-          specified reactor site.
pared fulfilling several specific prerequisites. These        We pursued the construction of four PPC HPGe
include limitations due to reactor safety (robustness     detectors, which were named Conus-1 to Conus-4
of setup, reduction of flammable materials, prohibi-      and are denoted with C1 to C4 in the following
tion of multi-purpose usage of cryogenic liquids), sta-   sections. Additionally a fifth PPC HPGe detector,
ble and autonomous operation during data collection       C5, was built for research and development and for
(no possibility of remote control, access only via mul-   auxiliary measurements towards a better comprehen-
tiple personal interlocks) and background suppression     sion of the C1-C4 detector responses. C5 also has a
strategies (detector intrinsic background, Pth corre-     crystal mass of 1 kg and does not differ significantly
lated background, cosmic radiation at shallow depth,      in performance relative to the others, but it has
locally contaminated dust and airborne radon).            been exposed longer to cosmic radiation overground.
    Despite the challenge of coping with quenched nu-     The following sections will focus only on C1 to C4,
clear recoils, we opted for the high purity germa-        which underwent the same test procedures and were
nium (HPGe) ionization detector technology, which         deployed simultaneously at KBR.
has been well known at Max-Planck-Institut für Kern-         This report is structured in the following way:
physik, in Heidelberg, Germany, (‘MPIK’) for many         Chapter 2 illustrates the adopted overall detector
decades [9, 10]. Further we decided to optimize [11]      design, i.e. in cryostat, cryocooler and HPGe diode
the p-type point contact (PPC) detector design, ori-      construction. It also includes the active volume,
ginally proposed by [12, 13, 14] and already deployed     dead layer and transition layer characterization.
for keVee and sub-keVee physics applications by the       Chapter 3 gives an insight into the efforts to obtain
CoGeNT [15], Cdex [16], Texono [17], Majorana             intrinsically low background detectors for Conus.
[18] and νGeN [19] Collaborations. Together with the      Chapter 4 describes the electronics layout and the
company Mirion Technologies (Canberra), in Lingol-        data collection system. Chapter 5 focuses on the
sheim, France, (‘Mirion-Lingolsheim’) we were able to     electronic response of the new detectors. This in-
combine a unique set of detector specifications for the   cludes depletion voltage, energy scale calibration and
first time:                                               linearity, energy resolution, trigger efficiency, as well
                                                          as noise studies. Chapter 6 refers to the long-term
    1. large crystal mass: 1 kg,                          stability of the detectors evaluated especially during
                                                          the experimental Run-1 (April 1 – October 29,
    2. excellent pulser resolution: < 85 eVee ,
                                                          2018), Run-2 (May 16 – September 23, 2019) and
    3. low energy threshold:  40 cm,                        be presented, however a detailed discussion of the
                                                          background is postponed to a separate publication.
    5. very low background components,
                                                              To summarize, the excellent performance of the
    6. short cosmic activation time: < 100 d,             Conus detectors demonstrates the suitability of this
                                                          detector design for CEνNS signal detection at reactor
    7. electrical cryocooler with noise-cancellation.     site.

   To grasp the importance of points 1.-3., the
expected CEνNS signal rate at the Conus location is       2   Detector design
shown in Figure 1 as function of two parameters: the
lower bound of the region of interest (ROI) limited       In order to meet the low noise and low background pre-
at lower energies by the detector energy threshold        requisites as well as the safety rules at the reactor site,
3
0.4 103
0
k (mod. Lindhard theory)
102
CEν NS [counts kg−1 a−1]
100
QF range
0
30
0.3 101
100
30 100
10
0.2
1 10−1
10−2
0.1 10−3
200 300 400 500
threshold energy Eth [eVee]
Figure 1: Expected CEνNS signal rate in Conus detectors at 17.1 m distance from the reactor core with maximum
thermal power Pth of 3.9 GW: the signal rate is depicted as function of i) the lower bound of the region of interest
and thus the energy threshold, and ii) the experimentally not well known quenching factor (QF). Within the modified
Lindhard theory, QF is described by the k parameter. The black horizontal lines confine the range of measured QF
values reported in literature.
the Conus Collaboration and Mirion-Lingolsheim co- capacitance below 1 pF at full electrical depletion and
operated strongly on the detector design and fabrica- helps to reduce the noise level. Finally, the active
tion. The resulting detector design is shown in Fig- volume (AV) confined by the PL and the PCCL has
ure 2. It can be divided into three main parts: the a full charge collection efficiency ε.
HPGe diode, the cryostat and the electrical cryocooler Mirion-Lingolsheim contractually agreed on
unit. Their specifications are discussed in the follow- a PCCL thickness of [0.5, 1.0] mm, i.e. an AV
ing subsections. of [92, 96]%, and estimated a PL thickness of
[100, 200] nm. After detector delivery, the Conus
2.1 HPGe diodes Collaboration focused on the determination of the
DL, TL and AV values motivated by the following
For HPGe diode production, five cylindrical p-type reasons: first, the AV is needed for the CEνNS count
HPGe crystals were ordered. All have a height rate determination; second, the TL is responsible for
(h) and a diameter (Ø) of 62 mm×62 mm, each the formation of so-called ‘slow pulses’. These occur
corresponding to a total mass of 996 g. In terms of when energy depositions from external particles (e.g.
noise suppression, the crystals and the net impurity electrons/positrons or low energy photons emitted in
concentrations were carefully selected in order to muon-induced electromagnetic cascades) with small
reduce the bulk leakage currents down to the sub-pA absorption lengths are stopped within the TL. The
level. released charges diffuse slowly and lossy from the TL
The HPGe diodes have a lithium-diffused n+ layer into the AV. Such signals have large rise times and
wrapped around the lateral surface area and the top significantly contribute to the low energy background
end area. As shown in Figure 3, this layer is partially spectrum; third, the relatively wide PL is important
dead (dead layer (DL)) and semi-active (transition for the background model of e.g. surface α-decays.
layer (TL)). Both layers together are called partial These investigations were performed by using the
charge collection layer (PCCL). The bottom end area measured background and radioactive source calibra-
is fully passivated (passivation layer (PL)) except for tion data, and by comparing them with Monte Carlo
a concentric spot of a few millimeters in diameter, (MC) simulations of the same detector setups. The
where the boron-implanted p+ contact is located. Geant4-based simulation package Mage [22] – often
The smallness of this electrode reduces the detector4
Figure 2: Overall Conus detector design. The HPGe diode is included in the cylindrical copper end cap.
Table 1: Active masses (AM), active volumes (AV) and 2.2 Cryocooler
thicknesses of the partial charge collection, dead and tran-
sition layers (PCCL, DL, TL) of C1 to C4. To cool the HPGe diodes, we replaced standard
liquid nitrogen cooling in favor of electrically powered
pulse tube coolers. We selected the Cryo-Pulse 5
det. AM AV PCCL DL TL Plus model denoted with CP5+, which is offered
[g] [%] [mm] [mm] [mm] as a second generation state-of-the-art product by
C1 936±10 94±1 0.77±0.03 0.57 0.20 Mirion Technologies [28]. It is a Stirling pulse tube
C2 947±10 95±1 0.69±0.03 0.52 0.17 refrigerator [29], which was developed originally
C3 936±10 94±1 0.64±0.03 0.48 0.16 by Mirion-Lingolsheim and which turned out to
C4 907±10 91±1 1.32±0.04 1.08 0.24 widely fulfill reactor site limitations and several key
specifications of a CEνNS sensitive detector.
First, this cryocooler type is fully maintenance-
free. It consists of a cold head assembly, to which the
detector is directly attached, and uses a CFC-free,
non-flammable gas in a hermetically closed contain-
ment, such that a gas refilling is not needed. The
applied and validated at MPIK in other occasions compressor contains no lubricant, which could pollute
[7, 10, 23, 24, 25] – was used here. the refrigerator. Moreover, it has a demonstrated
The PCCL thicknesses were measured with surface very reliable mean-time-to-failure of 1.2×10⁵ h, which
sensitive 241 Am sources. The corresponding method is corresponds to a lifetime of more than 12 a of opera-
based on a comparison of measured to simulated tion [28]. This is long enough for the planned Conus
ratios of count rates in prominent γ-ray lines at 59.6, experimental phase from 2018 to 2022.
99.0, and 103.0 keV. For a comprehensive description Second, it has an external power controller with
of the applied method see Refs. [25, 26, 27]. By data logger functionality and an integrated high
modeling the TL with a proper sigmoidal-shaped voltage (HV) inhibit circuit.
analytical function in the MC, the observed low en- Third, the improved heat sinking allows opera-
ergy tail of 59.6 keV is better matched; see Figure 4. tion at room temperatures up to 40 °C. The latter
The AV values were deduced from the known crystal two points are important especially during reactor
volumes and the determined PCCL thicknesses. The outages, in which room temperatures close to the
overall results are summarized in Table 1. reactor core can exceed 30 °C (cf. Section 6.1) and
power/ventilation failures might occur.5
normalized to meas. line count rate
Li-diffused dead layer (n+ contact)
ε=0 measurement
CONUS-1
4 MC without transition layer
10
MC with transition layer
Transition layer
Transition
06
(cf. Section 3.2). Further, during HPGe diode produc-
tion Mirion-Lingolsheim paid special attention not to
accidentally introduce a contamination on the diode
surfaces.
Second, starting from samples put at the dis-
Figure 5: Electropolished copper cryostat parts used for
the construction of the first Conus detector C1.
the long-term data collection period (cf. Section 6.3).
The cryostats were made of electrolytic copper (Cu),
wherein a few parts such as the end caps were refur-
bished from former low background HPGe detectors
(cf. Sect. 3.1). These end caps have an inner di-
ameter of 105 mm, which is more than sufficient to Figure 6: Illustration of the main components inside a
accommodate a 1 kg massive HPGe diode and which Conus cryostat end cap: 1. temperature sensor, 2. cold
has two further advantages: the large empty space al- finger, 3. O-ring, 4. signal cable, 5. HV cable, 6. substrate
lows for better cooling of the diode in all directions, with cold front end electronics (SMD resistor, JFET with
and within a potential future upgrade, a HPGe diode soldered contacts), 7. insulator, 8. contact pin, 9. HPGe
of 1.5 kg, i.e. with dimensions 71 mm×71 mm (h × Ø) diode, 10. PCTFE holder. All other components are made
could still be accommodated. of electrolytic copper.
The Cu cryostat parts were produced at the me-
chanical workshop of MPIK. Some manufactured Cu
pieces are shown in Figure 5. Finally, all Cu pieces posal by Mirion-Lingolsheim, the Conus Collabora-
were electropolished at the company Poligrat, in tion carefully measured the radio-impurity concentra-
Munich, Germany [30], before being assembled, out- tions of all cryostat internal parts lying next to the
gassed and commissioned at Mirion-Lingolsheim. HPGe diodes. An illustration of these parts is given
in Figure 6, while a list of the underlying materials to-
3 Reduction of intrinsic detector background gether with their typical amount integrated in a sin-
gle detector are summarized in Table 3. The radio-
3.1 Search for low background materials
impurity investigation was performed by means of
In terms of low background, the Conus experi- high sensitivity HPGe γ-ray spectroscopy, which has
ment aims at a total background rate of ≤ 10 counts the advantage of being non-disruptive and enabling
kg−1 d−1 in the interval [0.3, 1.0] keVee including the to collect information about progenies of the primor-
ROI for CEνNS searches (cf. Section 1). This spec- dial U and Th decay chains as well. The latter point
ification required not only a complex external shield is important, since it proves the secular equilibrium
design (cf. Section 4.1.2 in Ref. [7]), but also a careful among the sub-chains. This anticipates potential ratio
selection of all materials entering the detector produc- changes that might occur within an experiment last-
tion. This is discussed in the next paragraphs. ing several years such as Conus. Depending on the
First, the HPGe crystals were freshly grown available mass and criticality, the samples were mea-
(cf. Section 2.1) and stored underground whenever not sured with the HPGe screening stations Corrado
needed for HPGe diode processing. This helped to [23] or Giove [10] at the MPIK underground labo-
minimize the cosmogenic production of radioisotopes ratory (15 m of water equivalent, m w.e.), as well as7
Table 3: Radio-impurity concentrations of the main material components used for the Conus detector construction.
Further, the typical quantities of materials deployed inside the end cap of a single detector unit are presented in the last
column.
226 228 228 40
sample amount unit Ra Th Ra K amount/detector
SMD resistor 500 pc. µBq/pc. 17±38
Table 4: Activities A (unit: decays kg−1 d−1 ) of relevant cosmogenic radioisotopes in natural Ge included in the Conus
HPGe diodes for the points in time T1=April 1, 2018 (beginning of Run-1) and T2=May 16, 2019 (beginning of Run-
2). The predictions are based on known activation and ‘cooling down’ periods during detector manufacturing, on the
reported half-lives and sea-level production rates P (unit: atoms kg−1 d−1 ) that were averaged from Refs. [35, 36] and
Refs. [39]-[48]. The partly large standard deviations ∆P demonstrate the lack of precise measurements.
isotope 68 Ge 65 Zn 3H 60 Co 58 Co 57 Co 55 Fe 51 Cr 54 Mn
half-life / d 270.0 244.3 4489.5 1934.5 70.9 271.8 985.5 27.7 312.0
P 59.1 50.1 78.1 3.9 9.3 7.6 5.8 4.2 2.6
∆P 43.9 21.9 57.4 1.5 4.5 3.9 2.6 – 1.7
C1: T1 8.61 7.38 1.54 0.17 0.58 1.11 0.43 0.04 0.37
T2 3.01 2.31 1.45 0.14 0.01 0.39 0.32 0.00 0.15
C2: T1 6.32 5.44 1.13 0.12 0.61 0.81 0.31 0.09 0.27
T2 2.21 1.70 1.06 0.10 0.01 0.29 0.24 0.00 0.11
C3: T1 5.25 4.60 0.77 0.08 0.59 0.67 0.22 0.04 0.22
T2 1.83 1.44 0.72 0.07 0.01 0.24 0.17 0.00 0.09
C4: T1 6.56 5.71 1.05 0.11 0.67 0.84 0.30 0.04 0.28
T2 2.29 1.78 0.98 0.10 0.01 0.30 0.22 0.00 0.11
Table 5: Activities A (unit: decays kg−1 d−1 ) of relevant cosmogenic radioisotopes in Cu used for the Conus Ge detector
cryostats for the points in time T1 and T2. The prediction is based on known activation and ‘cooling down’ periods
during detector manufacturing, on the reported half-lives and sea-level production rates P (unit: atoms kg−1 d−1 ) that
were averaged from Ref. [44] and Refs. [49]-[53]. Several standard deviations ∆P are once again large.
isotope 60 Co 58 Co 57 Co 46 Sc 48 V 54 Mn 59 Fe 56 Co
half-life / d 1925.2 70.8 271.8 83.8 16.0 312.1 44.5 77.2
P 45.5 75.6 54.8 2.3 3.7 16.5 7.2 12.4
∆P 26.4 35.5 19.2 0.7 0.7 7.3 5.4 5.1
C1: T1 1.66 3.86 6.42 0.15 0.01 1.89 0.16 0.72
T2 1.43 0.07 2.26 0.00 0.00 0.76 0.00 0.02
C2: T1 1.06 4.58 4.77 0.16 0.02 1.35 0.28 0.80
T2 0.92 0.08 1.68 0.01 0.00 0.54 0.00 0.02
C3: T1 1.48 5.60 6.69 0.21 0.01 1.93 0.24 1.02
T2 1.28 0.10 2.35 0.01 0.00 0.78 0.00 0.03
C4: T1 1.71 6.49 7.84 0.24 0.01 2.25 0.26 1.19
T2 1.47 0.12 2.76 0.01 0.00 0.91 0.00 0.03
average production rates from literature are reported diodes (cf. Section 6.4). It was found that they
in Table 4. The exposure times of the HPGe diodes be- minimally contribute to the overall background, such
longing to C1 to C4 were reconstructed in more detail that a time-dependent component can be omitted for
and used to calculate the activities at the beginning CEνNS analysis.
of Run-1 and Run-2. The 68 Ge and 65 Zn associated
X-ray line intensities are expected to decrease espe- 4 Detector electronics and data acquisition
cially within the initial months of the experiment, but system
according to background simulations their contribu-
tion to the sub-keVee region is very small (cf. Sec- 4.1 Description of electronics circuit
tion 6.4). Even though not seen by visual inspection Figure 7 depicts the overall signal detection and ampli-
of the spectrum, 3 H is predicted to be the third most fication electronics chain implemented in the Conus
relevant cosmogenic radioisotope. However, due to its detectors.
β-spectrum with endpoint energy of 18.6 keV and its The p-type HPGe diodes are electrically depleted
long half-life of 12.3 a, it adds a small contribution by applying a positive reverse bias voltage of several
to the total background and it is practically constant 1000 V on the surrounding n+ contact (cf. Section 5.1
during Conus runs. and Figure 3). Ionization events create electron-hole
In Cu, the cosmogenic production of 57 Co, 58 Co, pairs which drift in opposite directions due to the ap-
54
Mn and 60 Co is mainly relevant. To quantify their plied potential and the electric field generated by the
impact on the sub-keVee region, the decays were thor- space charge of the depleted HPGe diode. Holes drift
oughly simulated in the Cu parts close to the HPGe to the p+ electrode leading to signal formation.9
Ge diode High voltage input
INH OUT
Schmitt
trigger
OUT E
EURIFET
Drain
Substrate
OUT T
Source
Feed back
Figure 7: Simplified representation of the signal detection and amplification electronics chain of the Conus detectors
prior digitalization of the raw pulse traces. The cold front-end part of the electronics is outlined by the red dashed box.
After the p+ contact, the charge signals enter a and/or in presence of large leakage currents/noise lev-
charge sensitive preamplifier (CSP). Its first amplifi- els, frequent resets can induce a problematic amount
cation stage requires special attention, since it mainly of dead time. To overcome this, Mirion-Lingolsheim
contributes to the overall noise figure. So, starting first managed to achieve very low leakage currents of
from the preamplifier model PSC 954-P developed by ≈0.25 pA in all Conus detectors. These can be de-
Mirion-Lingolsheim, a large effort was put into the duced from the slope of the increasing baselines via
corresponding cold preamplifier design to find the best I = dQ/dt = Cf b · dV /dt, with dV ≈8 V, dt≈8 s, and
compromise between the noise budget, the input ca- Cf b =0.25 pF being the internal feedback capacitance
pacitance and a high gain. At the same time, new (cf. C4 example in Figure 8). Second, the installation
mounting and contacting methods were developed to of a massive shield around the HPGe detectors at the
minimize the stray capacitance seen at the input of Conus experimental site was beneficial not only to
the preamplifier. The entire cold preamplifier design create the required low background environment, but
uses selected low loss dielectrics and ultra-low radioac- also to reduce the pulsed-reset frequency. With reset
tive background materials in order to meet simultane- time windows of [80, 160] µs selected for the operation
ously the ultra-low noise and low background design of C1-C4 at KBR, the average reset periods turned
specifications. To fulfill the latter point, we opted for out to be large, i.e. around [0.5, 1] s, with maxima
a custom-built JFET instead of e.g. an application- up to [7, 8] s (cf. Figure 8). So, the dead times in-
specific integrated circuit (ASIC). As shown more duced by resets in the Conus detectors are in general
recently [54], ASICs are indeed very attractive for small (∼0.01%) compared to the contributions from
achieving ultra-low noise levels. They are, however, the trigger rate processing time needed by the data ac-
less reliable in the manufacturing process and more quisition system (DAQ) ([0.1, 4.2]%; cf. Section 5.4)
radioactive due to components such as bypass capaci- and from the veto gates generated by the muon (µ)
tors needed for ASIC voltage supply. anticoincidence system ([3.5, 5.8]%).
The used DC-coupled CSP includes a pulsed-reset Finally, the CSP generates two equal output sig-
instead of a resistive feedback on the signal contact. nals (energy, time) and a rectangular inhibit signal
This helps to further reduce the noise contribution ris- (TRP), when the Schmitt trigger logic has been acti-
ing from a potential feedback resistor, however it needs vated. The latter is used by the DAQ (cf. Section 4.2)
to reset the increasing baselines after saturation of the to veto all physics and random trigger events gener-
dynamic range. This is managed by a Schmitt trig- ated during the resets of the preamplifier.
ger logic. However, under strong detector irradiation10
with Python- and Root-based [61] scripts.
The Lynx DAQ is equipped with an oscilloscope
functionality, but does not allow for digitalization of
raw CSP traces. This would help to reduce certain
types of backgrounds at low energies such as ‘slow
pulses’ (cf. Section 2.1) – as already demonstrated by
other experiments [62, 63, 64]. Thus, for the near fu-
2V ture Conus pursues the installation of a second DAQ
2s system, which will have the capability to store also
the waveform information.
Figure 8: Exemplary baseline from the pulsed-reset
5 Detector electronic response
preamplifier of the C4 detector inside the Conus shield
at KBR. The dynamic range goes up to ≈8 V, while the 5.1 Electrical depletion of the HPGe diodes
time interval between two resets can be large, i.e. up to
≈8 s. In order to achieve low leakage currents and thus low
noise HPGe diodes, Mirion-Lingolsheim selected p-
type HPGe crystals of high quality with proper net im-
purity concentrations Na−d := |Na -Nd |, with Na and
4.2 Data acquisition system Nd being the acceptor and donor concentrations. The
latter ones guaranteed also the application of lower re-
For raw data processing we opted for the 32K chan- verse bias voltages, which are able to electrically fully
nel integrated multichannel analyzer Lynx [55]. For deplete the HPGe diodes. A multiple approach was
Conus, this DAQ system has several advantages applied to deduce these so-called ‘depletion voltages’
which are summarized here. (DV) for C1-C4.
In terms of space constraints at a reactor site, the The manufacturer tracked the C-V and I-V curves
Lynx is highly compact offering in one single device in reverse polarity while rising the voltage. A constant
high and low voltage power supply and a large set of capacitance finally confirms the reach of full depletion.
connectors for different types of inputs: energy, TRP The Conus Collaboration remeasured the DVs via
inhibit, HV inhibit and veto signals from the µ-anti- an irradiation of the detectors with a 57 Co γ-ray
coincidence system (‘µ-veto’). The 10/100 Base-TX source and increased the positive voltage in [10, 100] V
Ethernet connection can be used for fast communica- steps. During such a HV scan, the changes in noise on
tion with the Conus main PC via TCP/IP. the signal baselines as well as in peak position (PP),
In terms of digitizing and processing signals from peak integral (PI) and energy resolution (∆E) of the
raw data [56, 57], the Lynx is well suitable for 122.1 keV γ-ray line were monitored. A sudden re-
low energy applications, in which small energies and duction in noise on the signal baseline signalized the
high trigger rates are encountered. It can deal with attainment of the DV. At full electrical depletion, the
both types of CSPs, specifically with the pulsed- PP, PI and ∆E parameters reached constant values
reset type (cf. Section 4.1) used in Conus. Internal within statistics.
gains/attenuators can be adopted/activated, in order
to allow e.g. an energy range up to 500 keVee or a Table 6: Depletion voltages of the C1-C4 detectors as de-
fine-grained binning of ≤ 1 eVee in the CEνNS ROI. termined by the Conus Collaboration via two independent
Among a large variety of standard functionalities such procedures: a) visual inspection of the signal baseline on
as automatic pole/zero cancellation and baseline re- the oscilloscope, b) peak position shift of the 122.1 keV
storers, it contains a trapezoidal shaping filter (TSF) γ-ray line.
for energy reconstruction [58, 59]. This offers the pos-
detector DV DV OV
sibility to widely adjust the rise time and flat top time
(baseline)[V] (peak position) [V] [V]
of the TSF up to 51 µs and 3.2 µs, respectively. Next C1 2730±1 2710±25 3000
to this slow shaping time filter, there is a fast shaping C2 2070±1 2560±25 2700
time filter with a short fixed shaping time (∼200 ns), C3 2785±1 2810±25 3000
C4 3190±5 3200±25 3400
which allows to identify efficiently pile-up events.
For DAQ control, HV setting and filter manipula-
tion in Conus, we set up a robust interface using the
Python-based [60] software development kit Lynx Moreover, the operational voltages (OV) recom-
SDK [55]. This finally allows to save time-stamped mended by Mirion-Lingolsheim are reported. Figure 9
energy list modes, which are further analyzed offline depicts the PP curves of C1-C4. The constant plateau11
quently does not suffer from diode border effects.
124
peak position / keVee
peak position / keVee
Specifically, Conus makes use of the X-ray lines cor-
122 120 responding to the binding energies of the K shells at
120
9.0, 9.7 and 10.4 keV and of the L shells at 1.1, 1.2
100
118 and 1.3 keV from 65 Zn, 68 Ga and 68 Ge+71 Ge decays,
116
80
respectively. A typical energy spectrum – as measured
114 with C2 at the Conus experimental site during Run-
112 60 1, -2 and -3 – is depicted in Figure 10. With the
110 measured K shell intensities, the weaker L shell inten-
CONUS-1 40 sities can be constrained via well known K/L ratios.
108
CONUS-2 For completeness, the binding energies and K/L ra-
106 CONUS-3 20 tios used in Conus spectral analyzes are reported in
104 CONUS-4 Table 7.
102 0
1800 2000 2200 2400 2600 2800 3000 3200 3400 The Ge-related radioisotopes are produced con-
voltage / V tinuously overground via the hadronic component of
cosmic radiation (cf. Section 3.2). However, during
Figure 9: Peak position of 122.1 keV γ-ray line of Co 57 underground storage at a depth below 10 m w.e., cos-
in dependence of the voltage applied at the HPGe diodes mogenic activation via hadrons is already suppressed
of C1-C4. The red y-scale refers to C2 only. The vertical by three orders of magnitude compared to sea level
lines mark the depletion voltage determined via the signal [9, 67]. On the other hand, the still intense cosmic µ-
baseline method. flux at shallow depths can produce ∼1 MeV neutrons
[7, 24] inside compact Pb shields such as the one used
in the full depletion regime of the single detectors be- for Conus. These neutrons are able to create 71 Ge
comes clearly visible. Next to it, C2 exhibits a broader atoms inside the HPGe diodes. In the specific case of
and deeper discontinuity shortly before reaching DV. the Conus site at KBR, the overburden corresponds
This so-called ‘bubble depletion’ [65] or ‘pinch-off’ ef- to 24 m w.e. and the steady-state production of new
71
fect [66] depends on the detector design and the net Ge atoms leads to a constant 10.4 keV X-ray line in-
impurity concentrations: in the specific case of a PPC tensity of ∼15 counts kg−1 d−1 in all detectors. With
HPGe detector, the relevant Na−d values are quoted these lines and such count rates, it is possible to cal-
around the spot-like p+ contact and for the opposite ibrate Conus energy spectra based on typical expo-
side. For C2 the difference of the two Na−d values sures of >30 kg·d with a precision of [10, 20] eVee in
turned out to be very small. the ROI. To further improve this, Conus has started
For the operation of C1-C4 at KBR, we always ap- a periodic usage of 252 Cf neutron sources (half-life:
ply voltages which lie well above the determined DVs. 2.65 a). The emitted fast neutrons have energies below
The ones recommended by the manufacturer are at 10 MeV, which are enough to produce short-lived 71 Ge
least ∼200 V above the DVs and are also reported in radionuclides, but not long-lived ones such as 68 Ge,
65
Table 6. Zn or 60 Co (cf. Section 3.2). Pretests were done at
MPIK with different HPGe detectors [10, 11] in 2015.
5.2 Energy scale: calibration and linearity In January 2020, a 0.3 MBq 252 Cf source with a neu-
tron fluence of (3.3±0.1)×104 s−1 was deployed next
A key requirement for the reduction of the total sys- to the Conus shield at KBR for two weeks, leading to
tematic uncertainty in sub-keVee physics research is a three- to six-fold increase of the 10.4 keV X-ray line
given by a precise energy scale calibration of narrow intensities in the C1-C4 detectors. No deterioration
ROIs. Above energies of a few tens of keVee , we apply of the energy resolution due to the neutron irradia-
the standard method based on an external irradiation tion was observed. Future 252 Cf source irradiations
of the HPGe detectors with e.g. 241 Am, 133 Ba, 57 Co in Conus are planned, which will allow for a ≤5 eVee
and 228 Th γ-ray sources. precision on the energy scale calibration in the ROI
At lower energies, however, electromagnetic ra- – limited mainly by the uncertainties of the literature
diation cannot efficiently penetrate the Cu cryo- values.
stat and the PCCL. Thus, we pursue intrinsic cal- Finally, the DAQ- and detector-dependent energy
ibrations using X-rays emitted in radioactive de- scale calibration relies on the assumption that it has
cays inside the HPGe diodes. These have fur- a highly linear behavior. The validity of this work-
ther the advantage that the events are gener- ing hypothesis for all detectors was confirmed in ded-
ated homogeneously throughout the AV and the icated pulse generator (‘pulser’) scans and with ra-
reconstructed ionization energy spectrum subse-12
count rate / (cts / 20 eVee)
1.097 keV
(65-Zn) CONUS-2: RUN-1,-2,-3 10.367 keV
(68-Ge,71-Ge)
1.194 keV
103 9.659 keV
(68-Ga)
(68-Ga)
1.298 keV
8.979 keV
(68-Ge,71-Ge)
(65-Zn)
102
L shell
10
K shell
1
2 4 6 8 10 12
energy / keVee
Figure 10: The ionization energy spectrum of C2, as measured at KBR during the data collection periods Run-1 to
Run-3. Due to the very low intrinsic and external background only three K shell and corresponding L shell X-ray lines
become visible. These are used for energy scale calibration and energy resolution determination.
Table 7: Literature values of cosmogenic induced X-ray energies and half-lives of Ge-related radioisotopes that are used
for the calibration of the Conus detectors. K and L shell values are taken from Ref. [68] and the estimated uncertainties
from Ref. [69], while the K/L ratios are from Ref. [70].
nuclide half-life K shell [keV] L shell [keV] K/L ratio
68
Ge 270.95(26) d 10.3671±0.0005 1.2977±0.0011 0.1331±0.0030
71
Ge 11.43(3) d 10.3671±0.0005 1.2977±0.0011 0.1191±0.0030
68
Ga 67.83(20) min 9.6586±0.0006 1.1936±0.0009 0.1109±0.0013
65
Zn 244.01(5) d 8.9789±0.0004 1.0966±0.0004 0.1136±0.0014
dioactive sources. This is demonstrated exemplarily vironmental noise ∆Eee , while x-/γ-ray lines contain
in Figure 11 for detector C1. in addition the statistical fluctuation of the charge re-
lease ∆Esf inside the HPGe diode, and the charge
5.3 Energy resolution carrier collection efficiency ∆Ecc at the read-out elec-
To be sensitive to nuclear recoils producing only a few trode. The energy resolutions were measured within
100 eVee in a 1 kg massive HPGe detector, extremely the Factory Acceptance Test (FAT) at Lingolsheim,
low noise levels are required. Based on Mirion- the Site Acceptance Test (SAT) at the underground
Lingolsheim’s experience, many counter actions in laboratory of MPIK, and at the experimental site of
diode/cryostat/cryocooler/electronics (cf. Chapter 2 KBR. In all three cases, the environmental noise con-
and 4) construction and assembly were applied in or- ditions and energy reconstruction algorithms were first
der to meet the Conus experimental specifications. optimized. Herein, we applied a TSF with rise times of
One way to directly characterize the obtained noise [15, 16.8] µs and flat top times of [0.8, 1.0] µs. In terms
level is the energy resolution ∆E of prominent spec- of analogue shaping amplifiers, these values translate
tral lines, in the following expressed in terms of full into Gaussian shaping times of ∼12 µs, which are typ-
width at half maximum (FWHM). Measurements of ical for PPC HPGe detectors of this size. The energy
injected pulser signals reflect the electronics and en- resolution results are reported in Table 8. The val-13
is still recognized and digitized as event or is dis-
25000 carded. We selected SD values, which trigger on
energy / channels
CONUS-1 events with energies above 80-100 eVee and which
20000 are a good compromise between the accepted trig-
ger rate (driven by noise and physics event rates)
15000 and the induced dead times. The trigger rates
are around 100-1000 Hz and the dead times around
10000 [0.1, 4.2]%. Table 9 summarizes the chosen SD val-
ues as well as the detector-individual trigger rates and
dead times obtained during Run-1, -2 and -3.
5000
Below an energy of ∼350 eVee , noise-induced events
start to compete with physical events. At even lower
energies around 200 eVee the trigger efficiency for
diff. peak pos. / eVee
6 200 400 600 800 1000120014001600
4 physical events starts to drop down. The correspond-
pulser amplitude / a.u. ing energy window is called in the following the ‘noise
2
0 edge’. The ‘noise edge’ and the region above, in which
-2 noise-induced and physical events still coexist, are cru-
-4 cial for the definition of ROIs in CEνNS searches (see
-6 e.g. Ref. [71]). This emphasizes the importance to
-8 explore the detector response of the C1-C4 detectors
200 400 600 800 1000 1200 1400 1600 down to this energy region. A careful examination
pulser amplitude / a.u. was done during Run-2 of the experiment by means
of injected pulses with decreasing amplitudes gener-
Figure 11: C1 pulser scan performed during Run-1 us- ated with a Tektronics AFG3252 pulser. The trig-
ing the Lynx DAQ. Top canvas: Linearity of the low ger efficiency curves are depicted in Figure 12. The
energy interval [400, 23000] channel, corresponding to energy scale is derived from the energy calibration
[0.3, 11] keVee . Bottom canvas: Distance of peak posi- described in Section 5.2 and the experimental mea-
tions from linear fit in units of eVee . The shown error
surements were fitted with a Gaussian cumulative dis-
bars include the linear fit uncertainties.
tribution function. Characteristic energies Etrg , at
which reaches the 50%, 90% and 99% level, are re-
ported in Table 10 for all four detectors. For Run-3
ues are well below the design specification limit of the values are similar. As one can see, > 99% per-
∆EP < 85 eVee , even under non-laboratory condi- sists down to [165, 210] eVee , which coincides with 2.2-
tions at the KBR site (cf. Section 6.1). 3.1 times the pulser resolutions ∆EP (cf. Section 5.3).
During Run-1 a pulser scan with an EG&G Ortec
Table 8: Peak resolutions of the four Conus detectors in 448 pulser was performed. Due to periodicity insta-
terms of FWHM. The first three columns are pulser mea- bilities of this device it was not possible to determine
surements at Mirion-Lingolsheim, MPIK and KBR. The
the efficiency curve well below 200 eVee , but above this
last two columns correspond to 241 Am and 57 Co source
calibrations at MPIK.
energy > 95% was confirmed.
∆EP [eVee ] at ∆E[eVee ] at
det. Mirion MPIK KBR 59.6 keV 122.1 keV
C1 74 74±1 69±1 327.5±0.3 463.2±0.4 Table 9: Slow discriminator values SD, accepted trigger
C2 75 75±1 77±1 336.0±0.4 491.8±0.3
rates Rtrg and Rtrg -induced dead times td in Run-1, -2
C3 56 59±1 64±1 335.5±0.3 476.6±0.5
C4 74 74±1 68±1 332.6±0.7 481.2±0.4 and -3 of the Conus experiment, reported separately for
each detector.
Run-1 Run-2 & -3
det. SD td Rtrg SD td Rtrg
5.4 Trigger threshold and trigger efficiency [%] [%] [Hz] [%] [%] [Hz]
C1 2.4 1.3 300 [2, 2.1] [3.7, 4.2] 1500
Starting from the optimized energy filter settings, C2 3.2 1.8 125 [2, 2.6] [1.0, 4.0] ≥325
we tuned the trigger threshold mainly via the Lynx C3 2.4 0.3 150 [1.8, 2.6] [1.5, 2.0] ≥625
implemented slow discriminator (SD). This defines C4 2.6 0.5 275 [2.2, 2.8] [0.1, 2.1] ≥125
whether a small step on the baseline – independent
if it is caused by noise or a particle interaction –14
microphonic noise. The detector- and run-dependent
contribution to all events above the cut threshold is
1.0 between [1, 30]%. Microphonic events are produced by
mechanical vibrations originating from the cryocooler
or from the reactor environment. They can be contin-
0.8
efficiency
uous or last only a few seconds. Sequences involving
up to a few 100 events within less than 1 s were some-
times encountered during reactor OFF times, in a few
0.6 CONUS-1
occasions also during reactor ON periods, e.g at the
CONUS-2
time when the main cooling pumps of the reactor are
CONUS-3
0.4 turned on. In the ionization energy spectrum micro-
CONUS-4
phonic events are dispersed above the ‘noise edge’ and
50 100 150 200 250 300 could pollute the ROI (cf. Ref. [71]). However, since
energy / eVee the first and second category are well separated, it is
possible to apply a TDD cut to reject this kind of mi-
Figure 12: Trigger efficiency curves of C1-C4, as measured crophonic events with an efficiency of nearly 100%.
during Run-2 of the experiment. Below an efficiency of Third, fast sequences of two or more single events
50 %, the curves are less reliable and thus the shown un- were observed with ∆t < 25 µs. The detector- and
certainty bands might be underestimated. run-dependent contribution to all events is around
[1, 10]%. However, the intensity of these fast events
can be influenced by the fast discriminator (cf. Sec-
Table 10: Energy values Etrg of Conus detectors, at tion 4.2), indicating that the Lynx built-in pile-up re-
which the trigger efficiency reaches characteristic values. jector fails in this particular situation. It turned out
The ratios of Etrg (=99%) over ∆EP are reported as well. that the energy of the last events of such sequences
is reconstructed correctly, while not that of the other
events. Thus, these events are not trustful and com-
Etrg [eVee ] for: Etrg /∆EP
det. =50% =90% =99% (for =99%) monly rejected in Conus data analyses.
C1 121 145 165 2.4
C2 138 156 172 2.2
C3 108 141 169 2.6
C4 162 188 210 3.1
1044
time difference to next event / s
103
CONUS-1 physics events
2
102
5.5 Rejection of noise and spurious events
10
The low energy range just above the ‘noise edge’ can 01
be further optimized by offline data analyses. In the 10 -1
case of Conus, the study of the time difference ∆t -2
10-2 microphonic events
between single events turned out to be a useful tool 10 -3
to investigate and discriminate noise as well as spuri- -4
10-4
ous events. To visualize these populations, the time
10-5 spurious events
difference distribution (TDD) was plotted against en- -6
10-6
ergy for events above a detector-dependent cut thresh-
10-7
old, which exemplary for the C1 detector (Run-1) lies 2 4 6 8 10 12 14
slightly above 170 eVee . As one can see in Figure 13 energy / keVee
for this detector, three categories were identified:
Figure 13: Time difference distribution as function of
First, events with ∆t > 0.03 s are Poisson-
energy, as measured with C1 during Run-1. Two dotted
distributed, as expected from randomly distributed
lines at ∆t=0.03 s (10−1.5 s) and ∆t=25 µs (10−4.6 s) sepa-
physics events. Characteristic Ge X-ray lines (cf. Ta- rate three populations of events. The first one is related to
ble 7) show up at the corresponding energies. In gen- physical events. The intermediate one is mainly attributed
eral, the detector- and run-dependent percentage of to microphonic events. The fastest one is mostly connected
these events to the total number is in the range of [60, to spurious pile-up events, which were not correctly recon-
∼100]%. structed by the DAQ.
Second, events with 25 µs < ∆t < 0.03 s and a
frequency maximum around 1 kHz are mostly due to15
6 Long-term detector stability tions improved, background/noise sources mitigated
6.1 CONUS measurement conditions or quantified via independent measurements. MC
simulations helped to understand the impact of the
Nuclear power plants are ideal for CEνNS research, remaining contributions on the Conus energy spec-
since the reactor cores provide a highly intense, but tra. The associated long-term studies described in
also variable ν̄-flux, and they can be approximated Sections 6.2, 6.3 and 6.4 led to a selection of mea-
as a point-like source for typical distances of the ex- surement periods, in which the electronic response,
perimental setups. During reactor ON periods the ν̄- the noise and background levels of the Conus detec-
flux/spectrum varies due to changes in the isotopic tors are stable enough to guarantee a robust CEνNS
composition with the increasing burn-up of the nu- research.
clear fuel. Additionally, nuclear power plants in Ger-
many are highly engaged in load follow operations. Table 11: Measurement conditions and typical environ-
For KBR, the possible range is from 100% down to mental parameters at the MPIK underground laboratory
approximately 60% nominal power. Reactor OFF pe- [10, 72] and at the Conus experimental site at KBR [7].
riods at KBR cover regular outages, occurring typi-
parameter underground room A408
cally once a year and lasting up to four weeks, and
lab. at MPIK at KBR
shut-down periods due to maintenance work on short overburden [m w.e.] 15 24
notice. Since the Conus setup installation in January µ-flux reduction ∼[2, 3] ∼[3, 4.5] a
2018, there were two outages (March 31-May 7, 2018; Rn conc. [Bq m−3 ] 60 175±35 b
June 8-July 9, 2019) and two shorter shut-down peri- Rn mitigation N2 flush CAB flush c
neutrons [cm−2 d−1 GW−1 ] natural 191±8
ods (April 13-24, 2019; November 17-23, 2019). 16 N γs [cm−2 d−1 GW−1 ] negligible O: 106 d
However, in order to compare the energy spectra floor contamination natural 60 Co, 137 Cs
collected during variable ν̄-flux periods, detectors and room temperature [°C] 23±1 26±3; 20±2 e
access 24/7 10/5
experimental sites have to guarantee stable measure-
remote control available none
ment conditions, i.e. constant background and noise
levels. In close proximity to reactor cores (cf. Sec- a
Relative µ-flux reduction at KBR cmp. to MPIK: 1.62×.
tion 3.1 in Ref. [7]), these requirements are a priori b
c
Average value from Run-1 and Run-2 is reported.
Compressed air bottles (CAB) stored for >3 weeks before usage.
not easily fulfilled. Table 11 summarizes typical mea- d
Local flux depends on the solid angle and on the position relative
surement conditions for the Conus detectors encoun- to the Conus shield.
e
tered during commissioning at the MPIK underground Average Run-1 and Run-2 values are reported separately.
In Run-2 the room temperature was lowered via an air condi-
laboratory and during operation at the experimen- tioner system installed inside the tent surrounding the Conus shield.
tal site, i.e. room A408 in the KBR reactor building.
Especially challenging at the reactor site might be a
Pth correlated radiation background (e.g. from escap-
ing fission neutrons or γ-radiation from 16 N decays in 6.2 Peak position and energy resolution stability
the primary cooling cycles [7]) or noise (e.g. from the The PP and ∆E stabilities of the Conus detectors
steam generators), which could mimic CEνNS signals. were determined in three different ways during the ex-
Moreover, unprecedented situations might occur. In perimental runs at KBR. These comprise pulser and
228
the case of Conus, there were a few of them dur- Th source measurements as well as a continuous
ing outage periods. These include short, but strong monitoring of the prominent X-ray line at 10.4 keV.
increases in room temperature (up to 31 °C) and en- The first two measurement types were repeated on an
hanced radon (Rn) concentrations in air. On July 5-6, almost daily basis during reactor outages and every
2019, a regular leakage test of the reactor safety vessel two to four weeks during reactor ON periods. Each
was performed. For this purpose, the air pressure in- of these measurements lasted typically 10 min (100 Hz
side the entire containment was set to 1.5 bar absolute pulse frequency) and 2 h (15 kBq 228 Th source placed
pressure. To avoid damage to the Conus detectors, at 20 cm distance from the PPC HPGe diodes), respec-
their cryostats had to be ventilated and filled with ar- tively, in order to achieve a fit uncertainty on the PP
gon of 99.9999% purity before the test, and evacuated and ∆E values, which are in the range of [4, 6] eVee .
afterwards. Due to the modest intensity of the 10.4 keV X-ray line,
Within the limitations at the reactor site, we ad- time-bins of one month were selected to allow again
dressed all points in Table 11. I.e. an elaborated for a PP fit uncertainty of ∼5 eVee .
shield (cf. Section 4.1.2 in Ref. [7]) was constructed, Table 12 summarizes the standard deviations σ of
optimized and commissioned at MPIK prior to its the PP and ∆E mean values of the three type of peaks
installation at KBR. Relevant parameters at KBR for the Run-1 and Run-2 time periods. These are
site were carefully monitored, environmental condi- in general very small and did not deteriorate com-16
pared to tests previously performed under labora- erators during reactor ON periods. With the help of
tory conditions at MPIK. Especially, the σP P val- a seismograph installed in room A408, the noise in a
ues of [2, 9] eVee from the 10.4 keV X-ray line and of large frequency band was registered. A first conclu-
[1, 8] eVee from the pulser peaks demonstrate that the sion was that the seismic activity reflects the reactor
energy scale of the four Conus detectors at low ener- operations, but these are not fully aligned with the
gies remained very stable over time periods of several reactor Pth . A full discussion about this topic will
months. follow in a separate publication. Surprisingly, a Pth
correlated noise component was found in C3 and to
6.3 Detector noise stability some extent in C2 during short periods in Run-1 and
between Run-1 and Run-2. It is mainly induced by a
Since the ‘noise edge’ (cf. Section 5.4) is close to the
CEνNS ROI (cf. Section 1 and Ref. [71]), we precisely
×10
3
monitored the stability of the noise rate Rn below the
local air temperature / deg C noise rate in [130,280]eVee / cts/d
cryocooler power / W
270
ROI and investigated potential correlations between CONUS-3 145
noise variations and external parameters. 260
140
First, an intense and well matching correlation of 250
135
Rn with the cryocooler power consumption Pc and 240
130
thus with its work load was observed. Two effects can 230
125
cause a change in Pc . It can occur if the vacuum in- 220
120
side a cryostat slowly deteriorates in time. A small 210 115
decrease of the PPC HPGe diode temperature Td by 200 110
a few degrees (cf. Section 2.2) can help, but a cryo- 190 105
stat pumping is recommended. Among the Conus
08.06.19 12.06.19 16.06.19 20.06.19 24.06.19 28.06.19
detectors, C2 turned out to suffer from such a vac- 28
uum instability and was pumped onsite in February
26
2019. Further, Pc is strongly correlated to the lo-
cal air temperature Tl around the fan-in ventilators 24
of the cryocoolers. The reaction of the cryocoolers on
Tl variations is instantaneous. The Pc curve of the 22
C3 cryocooler is depicted in Figure 14 for the outage 20
period in 2019 together with the correlated Tl and Rn
measurements. In the initial phase of the outage from 18
June 8 until 14, 2019, the tent surrounding the Conus 08.06.19 12.06.19 16.06.19 20.06.19 24.06.19 28.06.19
setup has not yet been fully closed. So, the Rn values
in [130, 280] eVee increased with the rising and fluc- Figure 14: C3 detector during the outage of Run-2:
tuating overall room temperature Tr . As observed for The local air temperature, the cryocooler power consump-
C3, a 1 °C increase in Tl enhances Pc and Rn by 3 tion and the resulting noise integral in [130, 280] eVee are
and 4%, respectively. Between June 14-18, 2019, the shown. They are strongly correlated. The two dotted blue
Conus tent was fully closed and connected to an air lines reflect the installation and optimization of the so-
conditioner system. Since then, this ‘cold house’ has called ‘cold-house’, which surrounds the Conus setup in
allowed to lower and stabilize Tl around [18, 20] °C. room A408 of KBR.
Next to this measure, we applied a noise-temperature
correlation (NTC) cut offline in all previously collected
Conus data, which considers only time periods with cross talk with the Conus µ-veto. The corresponding
small Rn fluctuations below [5, 10]% within a given scintillator plates are integrated in the outer layers of
time period. This led to a larger loss of exposure, the Conus shield (cf. Figure 9 in [7]), which are less
but also to datasets with very stable noise rates above protected against the Pth correlated 16 N γ-radiation
200 eVee . This benchmark is used as one criterion to onsite. Fortunately, it was shown that this noise pop-
define the lower limit of CEνNS ROIs in Conus anal- ulates only the ‘noise edge’ and that its contribution
yses (cf. Ref. [71]). to the CEνNS ROIs is negligible.
Beside the cryocooler induced noise, we inquired
6.4 Background stability
the potential existence of a noise component corre-
lated to the reactor Pth . Natural candidates could The spectral background registered by the Conus de-
be mechanical vibrations induced e.g. by the reactor tectors was investigated in detail with a full MC-based
pumps of the primary cooling cycle or the steam gen- background decomposition [73] and with the help of17
detector 10.4 keV 238.6 keV pulser at (320 eV; 430 eV)
σP P σF W HM σP P σF W HM σP P σF W HM
C1 2.3; 5.4 10.5; 14.7 16.6; 30.3 9.2; 5.0 4.0; 0.6 1.6; 3.2
C2 4.9; 9.0 15.2; 21.1 15.9; 13.6 16.0; 10.6 6.0; 2.0 3.0; 3.1
C3 3.7; 2.9 15.7; 29.7 21.3; 36.5 12.6; 8.2 6.9; 7.8 1.4; 2.6
C4 2.3; 5.5 10.8; 12.5 13.7; 19.3 11.3; 10.8 4.7; 0.7 1.6; 4.7
Table 12: Standard deviations (unit: eVee ) of PP and ∆E of the 10.4 keV X-ray and 238.6 keV γ-ray line as well as of the
pulser peak at (320 eV; 430 eV) during the described measurement periods (Run-1; Run-2) of the Conus experiment.
auxiliary on-/offsite measurements. A full background [8, 21] counts kg−1 d−1 in E2 . With a half-life of 22.3 a,
discussion goes beyond the scope of this report and this 210 Pb-induced background can be considered as
is postponed to a future publication. This section fo- constant during a typical Conus run.
cuses on the average rates of different background con- A fourth class is related to decays of airborne Rn.
tributions and their stability. Table 13 summarizes the Even though the inner-most detector chamber of the
background rates measured in two energy windows of Conus shield is continuously flushed with Rn-free air,
the C1-C3 detectors at the beginning of Run-1: the Rn can sporadically appear (in terms of the 351.9 keV
region E1 =[0.4, 1.0] keVee includes part of the CEνNS γ-ray line) due to e.g. a non-sufficient flushing. With
ROIs, and E2 =[2, 7] keVee the background between the help of MC simulations the impact of 222 Rn and
the L and K shell X-ray lines (cf. Figure 10). its progenies on the low energy spectrum was simu-
The first background class is related to prompt lated. The maximum calculated rates are 0.9 counts
and delayed µ-induced signals generated inside the kg−1 d−1 in E1 and 4.7 counts kg−1 d−1 in E2 .
shield. Compared to all other contributions, prompt A fifth background class consists of fission neu-
µ-induced signals represent the most intense back- trons and 16 N γ-rays, since they are fully Pth corre-
ground component, i.e. (160±10) and (430±15) lated. As already demonstrated in Ref. [7], their im-
counts kg−1 d−1 in E1 and E2 , respectively. If the pact on the very low energy window is very small, i.e.
µ-veto is applied, these rates are reduced by ∼97% (0.010±0.005) counts kg−1 d−1 in E1 at full reactor
down to 5 and 13 counts kg−1 d−1 . Furthermore, µ- Pth .
induced neutron interactions in Ge can lead to de- Collectively, the mentioned background contribu-
layed isomeric states, whose de-excitation time can tions lead to detector-dependent background rates
exceed the applied gate length of 410 µs of the µ-veto. that vary between 6 and 13 counts kg−1 d−1 in the sub-
However, their contribution to the background rate is keVee region E1 . Overall background variations are
modest, i.e. (0.08±0.01) counts kg−1 d−1 in E1 and either negligible or can be basically corrected within
(0.10±0.01) counts kg−1 d−1 in E2 . The existence of the validated MC framework.
a seasonal µ-modulation due to temperature and den-
sity changes in the atmosphere has not yet been con- 7 Conclusions
firmed for the shallow depth Conus experimental site, The present work provides a comprehensive descrip-
but is expected to be ≤2% [74, 75, 76]. tion of the four large-size sub-keV sensitive HPGe de-
A second class is given by the decays of the cosmo- tectors used in the Conus experiment.
genic radioisotopes (cf. Section 3.2). Their contribu- As demonstrated, it was possible to fulfill all pre-
tion to E1 and E2 vary between the detectors around requisites needed for observing CEνNS at a reactor
[0.2, 0.4] counts kg−1 d−1 and [0.6, 1.7] counts kg−1 d−1 site, assuming realistic quenching factors of nuclear re-
at the beginning of Run-1. The integral contribution coils in Ge. The Conus detectors were equipped with
is mainly caused by 71 Ge, 68 Ge and 3 H decays. De- low vibration electrical cryocoolers, while large HPGe
pending on the detector activation histories and in- detector masses of 1 kg were combined with ultra low
situ cosmic production of 71 Ge, the cosmogenic con- noise and very low intrinsic background levels. The
tribution is expected to drop down to 60-70% within achieved pulser resolutions in terms of FWHM lie in
the first year of data collection and to stabilize around the range of [60, 80] eVee . These excellent values allow
30-40% within a few years. for noise thresholds of the order of 300 eVee and full
The Conus shield as well as the Conus detectors trigger efficiencies down to approximately 200 eVee .
contain traces of the 210 Pb radioisotope, whose decays The background levels registered from the Conus de-
lead to a third relevant background contribution. A tectors inside the Conus shield are around 10 counts
MC-based calculation allowed to extract a detector- kg−1 d−1 in the energy window [0.4, 1.0] keVee , which
dependent rate of [2, 7] counts kg−1 d−1 in E1 and includes a large fraction of the ROI used for CEνNSYou can also read