Energy Transition in PJM: Resource Retirements, Replacements & Risks
←
→
Page content transcription
If your browser does not render page correctly, please read the page content below

Energy Transition in PJM:
Resource Retirements, Replacements & Risks
Feb. 24, 2023

 For Public Use
Energy Transition in PJM: Resource Retirements, Replacements & Risks

This page is intentionally left blank.

PJM © 2023 www.pjm.com | For Public Use i|Pa g e

Energy Transition in PJM: Resource Retirements, Replacements & Risks

Contents
Executive Summary .....................................................................................................................................................1

Background ..................................................................................................................................................................4

Methodology.................................................................................................................................................................4

 Supply Exits .............................................................................................................................................................5
 Announced Retirements........................................................................................................................................6
 Potential Policy Retirements .................................................................................................................................7
 Potential Economic Retirements ...........................................................................................................................9
 Energy & Ancillary Services Revenue and Production Cost .............................................................................9
 Capacity Revenues and Fixed Avoidable Costs .............................................................................................10
 Results and Estimated Impact ........................................................................................................................10
 Supply Entry...........................................................................................................................................................10
 Natural Gas Headwinds ......................................................................................................................................10
 Renewable Transition .........................................................................................................................................11
 Commercial Probability and Expanding Beyond the Queue................................................................................11
 Impact of Capacity Accreditation on Existing Renewables and Storage .........................................................13
 Demand Expectations ...........................................................................................................................................14
What Does This Mean for Resource Adequacy in PJM? ........................................................................................15

PJM © 2023 www.pjm.com | For Public Use ii | P a g e

Energy Transition in PJM: Resource Retirements, Replacements & Risks Executive Summary Driven by industry trends and their associated challenges, PJM developed the following strategic pillars to ensure an efficient and reliable energy transition: facilitating decarbonization policies reliably and cost-effectively; planning/operating the grid of the future; and fostering innovation. PJM is committed to these strategic pillars, and has undertaken multiple initiatives in coordination with our stakeholders and state and federal governments to further this strategy, including interconnection queue reform, deployment of the State Agreement Approach to facilitate 7,500 MW offshore wind in New Jersey, and coordination with state and federal governments on maintaining system reliability while developing and implementing their specific energy policies. In light of these trends and in support of these strategic objectives, PJM is continuing a multiphase effort to study the potential impacts of the energy transition. The first two phases of the study focused on energy and ancillary services and resource adequacy in 2035 and beyond. This third phase focuses on resource adequacy in the near term through 2030.1 Maintaining an adequate level of generation resources, with the right operational and physical characteristics2, is essential for PJM’s ability to serve electrical demand through the energy transition. Our research highlights four trends below that we believe, in combination, present increasing reliability risks during the transition, due to a potential timing mismatch between resource retirements, load growth and the pace of new generation entry under a possible “low new entry” scenario: The growth rate of electricity demand is likely to continue to increase from electrification coupled with the proliferation of high-demand data centers in the region. Thermal generators are retiring at a rapid pace due to government and private sector policies as well as economics. Retirements are at risk of outpacing the construction of new resources, due to a combination of industry forces, including siting and supply chain, whose long-term impacts are not fully known. PJM’s interconnection queue is composed primarily of intermittent and limited-duration resources. Given the operating characteristics of these resources, we need multiple megawatts of these resources to replace 1 MW of thermal generation. 1See Energy Transition in PJM: Frameworks for Analysis | Addendum (2021), and Energy Transition in PJM: Emerging Characteristics of a Decarbonizing Grid | Addendum (2022). 2See previous work on Reliability Products and Services, including PJM's Evolving Resource Mix and System Reliability (2017), Reliability in PJM: Today and Tomorrow (2021), Energy Transition in PJM: Frameworks for Analysis | Addendum (2021), and work completed through the RASTF and PJM Operating Committee (2022). PJM © 2023 www.pjm.com | For Public Use 1|Pa g e

Energy Transition in PJM: Resource Retirements, Replacements & Risks

The analysis also considers a “high new entry” scenario, where this timing mismatch is avoided. While this is certainly
a potential outcome, given the significant policy support for new renewable resources, our analysis of these long-term
trends reinforces the importance of PJM’s ongoing stakeholder initiatives, including capacity market modifications,
interconnection process reform and clean capacity procurement, and the urgency for continued, combined actions to
de-risk the future of resource adequacy while striving to facilitate the energy policies in the PJM footprint.

The first two phases of the energy transition study assumed that
PJM had adequate resources to meet load.

In this this third phase of this living study, we explore a range of
plausible scenarios up to the year 2030, focusing on the resource
mix “balance sheet” as defined by generation retirements,
demand growth and entry of new generation.

The analysis shows that 40 GW of existing generation are at risk
of retirement by 2030. This figure is composed of: 6 GW of 2022
deactivations, 6 GW of announced retirements, 25 GW of
potential policy-driven retirements and 3 GW of potential
economic retirements. Combined, this represents 21% of PJM’s
current installed capacity3.

In addition to the retirements, PJM’s long-term load forecast
shows demand growth of 1.4% per year for the PJM footprint over
the next 10 years. Due to the expansion of highly concentrated The projections in this study indicate that it
clusters of data centers, combined with overall electrification, is possible that the current pace of new
certain individual zones exhibit more significant demand growth – entry would be insufficient to keep up with
 expected retirements and demand growth
as high as 7% annually.4
 by 2030.
On the other side of the balance sheet, PJM’s New Services
Queue consists primarily of renewables (94%) and gas (6%). Despite the sizable nameplate capacity of renewables
in the interconnection queue (290 GW), the historical rate of completion for renewable projects has been
approximately 5%. The projections in this study indicate that the current pace of new entry would be insufficient to
keep up with expected retirements and demand growth by 2030. The completion rate (from queue to steel in the
ground) would have to increase significantly to maintain required reserve margins.

In the study, we also consider generation entry beyond the queue using projections from S&P Global. Those
projections indicate that, despite eroding reserve margins, resource adequacy would be maintained if the influx of
renewables materializes at a rapid rate and gas remains the transition fuel, adding 9 GW of capacity. The analysis
performed at the Clean Attribute Procurement Senior Task Force (CAPSTF) also suggests that further gas expansion
is economic and competitive.5

3 Unless otherwise noted, thermal capacity values are expressed in ICAP, without adjustment for EFORd.
4 PJM Load Forecast Report, January 2023.
5 CAPSTF Analysis, Initial Results; Emmanuele Bobbio, Sr. Lead Economist – Advanced Analytics, PJM, Dec. 16, 2022.

PJM © 2023 www.pjm.com | For Public Use 2|Pa g e
Energy Transition in PJM: Resource Retirements, Replacements & Risks

 Balance Sheet Summary (2022–2030)

 Retirements New Entry New Entry New Entry Load
 Wind/Solar6 Standalone Thermal Growth
 40 GW
 60% Coal Low = Storage Low = 2023
 48 GW-nameplate / Low = 4 GW Forecast =
 30% Natural Gas
 8 GW-capacity 11 GW
 10% Other 3 GW High =
 High =
 High = 9 GW Electrification
 94 GW-nameplate /
 4 GW Forecast =
 17 GW-capacity
 13 GW

 Unless otherwise noted, thermal capacity values are expressed in ICAP, without adjustment for EFORd.

For the first time in recent history, PJM could face decreasing reserve margins should these trends continue. The
amount of generation retirements appears to be more certain than the timely arrival of replacement generation
resources and demand response, given that the quantity of retirements is codified in various policy objectives, while
the impacts to the pace of new entry of the Inflation Reduction Act, post-pandemic supply chain issues, and other
externalities are still not fully understood.

The findings of this study highlight the importance of PJM’s ongoing stakeholder initiatives (Resource Adequacy
Senior Task Force, Clean Attribute Procurement Senior Task Force, Interconnection Process Subcommittee),
continued efforts between PJM and state and federal agencies to manage reliability impacts of policies and
regulations, and the urgency for coordinated actions to shape the future of resource adequacy. The potential for an
asymmetrical pace in the energy transition, in which resource retirements and load growth exceed the pace of new
entry, underscores the need to enhance the accreditation, qualification and performance requirements of capacity
resources.

The composition and performance characteristics of the resource mix will ultimately determine PJM’s ability to
maintain reliability. It is critical that all PJM markets effectively correct imbalances brought on by retirements or load
growth by incentivizing investment in new or expanded resources.

6 Includes hybrid projects with battery storage

PJM © 2023 www.pjm.com | For Public Use 3|Pa g e

Energy Transition in PJM: Resource Retirements, Replacements & Risks

Background
Resource adequacy is the ability of the electric system to supply the aggregate energy requirements of electricity to
consumers at all times, taking into account scheduled and reasonably expected unscheduled outages of generation
and transmission facilities. To achieve the goal of resource adequacy, PJM maintains an Installed Reserve Margin in
excess of the forecast peak load that achieves a loss-of-load expectation (LOLE) of one day in 10 years. This LOLE
standard is consistent with that prescribed in the ReliabilityFirst Corporation standard for planning resource
adequacy.7

Long-term reliability and resource adequacy are addressed through the combined operation of PJM’s electricity
markets, and in particular the capacity market, called the Reliability Pricing Model (RPM). Each PJM member that
provides electricity to consumers must acquire enough power supply to meet demand, not only for today and
tomorrow, but for the future. Members secure these capacity resources for future energy needs through a series of
base and incremental capacity auctions, as well as Fixed Resource Requirement plans.

The capacity market ensures long-term grid reliability by procuring the appropriate amount of power supply resources
needed to meet predicted energy demand up to three years in the future. These capacity resources have an
obligation to perform during system emergencies, and are subject to penalties if they underperform. By matching
generation with future demand, the capacity market creates long-term price signals to attract needed investments to
ensure adequate power supplies. This exchange provides consumers with an assurance of reliable power in the
future, while capacity resources receive a dependable flow of income to help maintain their existing capability, attract
investment in new resources, and encourage companies to develop new technologies and sources of electric power.

Methodology
The size, composition and performance characteristics of the resource mix will determine PJM’s ability to maintain
reliability. This study explores a range of scenarios in the context of resource adequacy, focusing on the resource mix
“balance sheet” as defined by demand growth, generation retirements and new entry of generation. Using the
methodology described in this section, PJM evaluates the future of resource adequacy by estimating the amount of
capacity required to cover load expectations versus expected capacity for the years 2023 through 2030.

The study’s initial supply levels are 192.3 GW of installed capacity from generation resources and 7.8 GW of installed
capacity from demand response capacity resources. The generation mix is approximately 178.9 GW of thermal
resources and 13.3 GW of renewables and storage.8

7 RFC Standard BAL-502-RF-03: Planning Resource Adequacy Analysis, Assessment and Documentation
8This value includes the capacity value of run-of-river hydro, pumped storage hydro, solar, onshore wind, offshore wind and
battery energy storage.
PJM © 2023 www.pjm.com | For Public Use 4|Pa g e
Energy Transition in PJM: Resource Retirements, Replacements & Risks

Supply Exits
PJM is undergoing a major transition in the resources needed to maintain bulk power grid reliability.

Historically, thermal resources have provided the majority of the reliability services in PJM. Today, a confluence of
conditions, including state and federal policy requirements, industry and corporate goals requiring clean energy,
reduced costs and/or subsidies for clean resources, stringent environmental standards, age-related maintenance
costs, and diminished energy revenues are hastening the decline in thermal resources.

This study estimates anticipated retirements through 2030 by adding announced retirements with retirements
likely as a result of various state and federal policies, and then with those at risk for retirement due to deteriorating
unit economics. Potential policy-driven retirements, in this context, reflect resources that are subject to current
and proposed federal and state environmental policies, in which it is conservatively assumed that the costs of
mitigation and compliance could economically disadvantage these resources to the point of retirement. Figure 1
highlights the 40 GW of projected generation retirements by 2030, which is composed of: 12 GW of announced
retirements9, 25 GW of potential policy-driven retirements10 and 3 GW of potential economic retirements.
Combined, this represents 21% of PJM’s current installed capacity.11 This section describes each category of
potential retirements in more detail.

Figure 1. Total Forecast Retirement by Year (2022–2030)

9 Includes 6 GW of 2022 retirements.
10 Note that 7 GW of the 25 GW of supply with policy risk was also identified to have more immediate economic risk. The year
that these 7 GW of potential policy retirements shown in Figure 2 is based on timing identified in the economic analysis. In
Figure 4, these 7 GW are shown in terms of the regulatory compliance timeline alone. The timeline of these potential quantities
of resource retirements does not factor in any reliability “off-ramps” that may be included in established policies.
11In this study, PJM assumes that a resource that exits would not return to service in a future delivery year, even if operational
conditions improve. Historically, a small percentage of retiring units would instead enter a “mothball” or standby state, in which
the unit is put into a state where it may not operate for one or more years; however, in order to obtain an operating permit
renewal, the mothballed unit would have to comply with the most recent environmental standards, likely requiring costly
upgrades, making investing in newer, cleaner technologies more inviting.

PJM © 2023 www.pjm.com | For Public Use 5|Pa g e
Energy Transition in PJM: Resource Retirements, Replacements & Risks

Announced Retirements
One of PJM’s responsibilities is to ensure the continued reliability of the high-voltage electric transmission system when
a generation owner requests deactivation. Through its Generation Deactivation process,12 PJM identifies transmission
solutions that allow owners to retire generating plants as requested without threatening reliable power supplies to
customers. PJM may order transmission upgrades or additions built by transmission owners to accommodate the
generation loss. PJM has no authority to order plants to continue operating. However, in some instances, to maintain
reliability, PJM may formally request that a plant owner continue operating, subject to rates authorized by the Federal
Energy Regulatory Commission (FERC), while transmission upgrades are completed.

Plant owners considering retirement must notify PJM at least two quarters before the proposed deactivation date. PJM
and the transmission owners complete a reliability analysis in the subsequent quarter after notification to PJM. Generator
retirements and any required system upgrades to keep the grid running smoothly are included in the PJM Regional
Transmission Expansion Planning process and are reviewed with PJM members and stakeholders at the PJM
Transmission Expansion Advisory Committee.

Between 2012 and 2022, 47.2 GW of generation retired in PJM, as detailed by fuel type in Figure 2. In 2022,
approximately 6 GW of generation deactivated and an additional 5.8 GW announced (“future”) deactivations over the
2023–2026 time frame. The deactivations are slightly above the 10-year average of 4.3 GW, but well under the historical
annual peak of 9.5 GW in 2015. Coal-fired resources account for approximately 89% of retired capacity in 2022.

Figure 2. Past and Announced Future Retirements

12 See process details in PJM Manual 14-D, Section 9, and tracking of deactivation requests at
https://www.pjm.com/planning/services-requests/gen-deactivations.

PJM © 2023 www.pjm.com | For Public Use 6|Pa g e
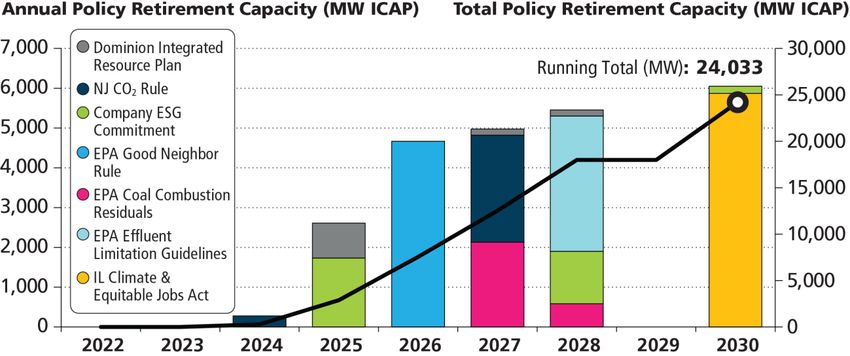
Energy Transition in PJM: Resource Retirements, Replacements & Risks

Potential Policy Retirements
An analysis of federal and state policies and regulations with direct impacts on generation in the PJM region yielded
the largest group of potential future retirements in this study.13 As highlighted in Figure 3, the combined requirements
of these regulations and their coincident compliance periods have the potential to result in a significant amount of
generation retirements within a condensed time frame. These impacts will be reevaluated as these policies and
regulations evolve. PJM will continue to work with both federal and state agencies on the development and
implementation of environmental regulations and policies in order to address any reliability concerns.

Below are the policies and regulations included in the study:

 EPA Coal Combustion Residuals (CCR): The U.S. Environmental Protection Agency (EPA)
 promulgated national minimum criteria for existing and new coal combustion residuals (CCR) landfills
 and existing and new CCR surface impoundments. This led to a number of facilities, approximately
 2,700 MW in capacity, indicating their intent to comply with the rule by ceasing coal-firing operations,
 which is reflected in this study.

 EPA Effluent Limitation Guidelines (ELG): The EPA updated these guidelines in 2020, which triggered
 the announcement by Keystone and Conemaugh facilities (about 3,400 MW) to retire their coal units by
 the end of 2028.14 Importantly, but not included in this study, the EPA is planning to propose a rule to
 strengthen and possibly broaden the guidelines applicable to waste (in particular water) discharges from
 steam electric generating units. The EPA is expecting this to impact coal units by potentially requiring
 investments when plants renew their discharge permits, and extending the time that plants can operate if
 they agree to a retirement date.

 EPA Good Neighbor Rule (GNR): This proposal requires units in certain states to meet stringent limits on
 emissions of nitrogen oxides (NOx), which, for certain units, will require investment in selective catalytic
 reduction to reduce NOx. For purposes of this study, it is assumed that unit owners will not make that
 investment and will retire approximately 4,400 MW of units instead. Please note that the EPA plans on
 finalizing the GNR in March, which may necessitate reevaluation of this assumption.

 Illinois Climate & Equitable Jobs Act (CEJA): CEJA mandates the scheduled phase-out of coal and
 natural gas generation by specified target dates: January 2030, 2035, 2040 and 2045. To understand
 CEJA criteria impacts and establish the timing of affected generation units’ expected deactivation, PJM
 analyzed each generating unit’s publically available emissions data, published heat rate, and proximity to
 Illinois environmental justice communities and Restore, Reinvest, Renew (R3) zones. For this study,
 PJM focuses on the approximately 5,800 MW expected to retire in 2030.

13Policies impacting forward energy prices, such as the Regional Greenhouse Gas Initiative and Renewable Energy Credits, are
implicitly included in economic analysis but are not explicitly included in analysis of policy-related retirements.
14 See State Impact PA, Nov. 22, 2021. These facilities have not filed formal Deactivation Notices with PJM.

PJM © 2023 www.pjm.com | For Public Use 7|Pa g e
Energy Transition in PJM: Resource Retirements, Replacements & Risks New Jersey Department of Environmental Protection CO2 Rule: New Jersey’s CO2 rule seeks to reduce carbon dioxide (CO2) emissions of fossil fuel-fired electric generating units (EGUs) through the application of emissions limits for existing and new facilities greater than 25 MW. Units must meet a CO2 output-based limit by tiered start dates. The dates and CO2 limits are: June 1, 2024 – 1,700 lb/MWh June 1, 2027 – 1,300 lb/MWh June 1, 2035 – 1,000 lb/MWh PJM used emissions data found in EPA Clean Air Markets Program Data to evaluate unit compliance. Where a unit’s average annual emissions rate was greater than the CO2 limit on the compliance date, the unit was assumed to be retiring. In this study PJM, estimated retirements at approximately 400 MW in 2024 and approximately 2,700 MW in 2027. Dominion Integrated Resource Plan (IRP) commits to net zero carbon in its Virginia and North Carolina territory by 2050. PJM studied Dominion’s Alternative Plan B retirement schedule, approximately 1,533 MW, for this analysis. Alternative Plan B proposes “significant development of solar, wind and energy storage resource envisioned by the VCEA,” (Virginia Clean Economy Act of 2020), while maintaining natural gas generation for reliability, which is reflected in our analysis. Company ESG (Environmental, Social, Governance) commitments are included where there is a commitment to retire resources per legal consent decree or other public statement. This includes the elimination of coal use and the retirement of the Brandon Shores, 1,273 MW, and Wagner, 305 MW, facilities in Maryland and the retirement of Rockport, 1,318 MW, in Indiana. Figure 3. Potential Policy Retirements PJM © 2023 www.pjm.com | For Public Use 8|Pa g e
Energy Transition in PJM: Resource Retirements, Replacements & Risks

Potential Economic Retirements
The third category of retirements in this study, beyond those formally announced and made likely by policy
implementation, were identified through an analysis of revenue adequacy, the ability to economically cover going-
forward costs from the wholesale markets. A net profit value was calculated for each existing generation resource
using an estimate of future revenues and historical costs.

 = ( & − )
 + ( ) − ( )

The results reveal that a portion of the thermal fleet is at risk of becoming unprofitable in the coming years.

The capacity market’s Variable Resource Requirement (VRR) represents the set of prices for which load is willing to
procure additional supply beyond the minimum reliability requirement. There are three points in the sloped demand
curve, the first of which is anchored at a price 1.5 times the Net Cost of New Entry (Net CONE). Should the auction
clear at this price level, the auction result signals that demand is willing to pay for the construction of new supply,
minus the expected energy revenues the resource should expect to earn in the energy markets. As such, it is
important to align the revenue expectations for the marginal resources with forward revenues, especially under PJM’s
continually changing landscape of business rules.

Energy & Ancillary Services Revenue and Production Cost
This study used a scaling approach to estimate forward unit-specific energy and ancillary services (E&AS) revenues
from historical energy and ancillary service revenues by applying the following:

 & 15
 & = & ∗ ∗
 &

For a given reference resource type, unit dispatch was simulated using both historical and forward energy hub-
adjusted energy prices. For the equivalent production cost model, the relative ratio of revenues and heat rates
indicate the net effects of both rising fuel costs and energy price revenue. A unit on the margin in the energy markets,
typically a natural gas unit, would set a locational price near its short-run marginal costs. Infra-marginal units,
potentially coal units, would receive higher revenues as price-taking resources, and thus may see increased
profitability. This is reflected in the analysis, in which a reference coal unit’s forward revenues increased an average
of 139% over previous revenue estimates.

15The forward energy and ancillary services revenue calculation used in this study is the method that was developed for use in
the Forward Net Energy & Ancillary Services Offset calculation originally developed in 2020, and filed as part of the most recent
Quadrennial Review.
PJM © 2023 www.pjm.com | For Public Use 9|Pa g e
Energy Transition in PJM: Resource Retirements, Replacements & Risks

Capacity Revenues and Fixed Avoidable Costs
Unit-specific capacity revenues were calculated from prices and cleared quantities in the 2023/2024 Base Residual
Auction (BRA). The study used the published 2023/2024 BRA Default Gross Avoidable Cost Rate (ACR) values as
representative total fixed costs ($/MW-day) required to keep the generating plant available to produce energy. In
other words, these are projected costs that could be avoided by the retirement of the plant. Avoidable costs represent
operational factors like operations and maintenance labor, fuel storage costs, taxes and fees, carrying charges, and
other costs not directly related to the production of energy. When available, unit-specific ACR values from the
2023/2024 BRA supply offer mitigation process were used, otherwise the class average Gross ACR was used.

Results and Estimated Impact
This study assumes that a simulated economic loss would result in a retirement of the resource at the next available
delivery year in which the unit is not committed for capacity. As such, a unit with a revenue loss that did not clear in
the 2023/2024 BRA would exit in 2023, while a unit with a revenue loss that cleared in the 2023/2024 BRA would exit
in 2024. While units that do not clear a single BRA may remain energy-only resources, this conservative assumption
was used to provide awareness.

The economic analysis identified approximately 10 GW of supply in immediate economic risk, of which 7 GW of
supply is also affected by policy risk, and 3 GW of supply is economic risk only. In aggregate, 6 GW are steam
resources, and 4 GW represent combustion turbines and internal combustion resources. Several of the units
identified were older steam boilers that had once converted from coal-fired to natural gas fuel; these resources are
less efficient than a modern heat-recovery steam generator in a combined cycle unit. Fifty-three percent of the
resources identified for economic risk did not have a PJM capacity obligation in Delivery Year 2023/2024, either
through the FRR process or market clearing.

Supply Entry
The composition of the PJM Interconnection Queue has evolved significantly in recent years, primarily increasing in
the amount of renewables, storage, and hybrid resources and decreasing in the amount of natural gas-fired
resources entering the queue. The PJM New Services Queue stands at approximately 290 ICAP GW of generation
interconnection requests, of which almost 94% (271 ICAP GW) is composed of renewable and storage-hybrid
resources.

Natural Gas Headwinds
In the last decade, resources in the PJM region have benefitted from the proximity to the Marcellus Shale, an area
that extends along the Appalachian Mountains from southern West Virginia to central New York. Beginning around
2010, gas extraction from hydraulic fracturing transformed this region into the largest source of recoverable natural
gas in the United States. This local fuel supply decreased the prices for spot market natural gas in much of the PJM
region, and prices in the PJM region often trade at negative basis to the Henry Hub spot price.

PJM © 2023 www.pjm.com | For Public Use 10 | P a g e
Energy Transition in PJM: Resource Retirements, Replacements & Risks

The entry of natural gas resources in the PJM region peaked in 2018, with 11.1 GW of generation commercializing
that single year. From 2019 to 2022, a total of 8.1 GW of natural gas generation began service, or about a third of the
23 GW observed from 2015–2018. Queue proposals have also declined; over the last three years, only 4.1 GW of
new natural gas projects entered the queue, while 15.1 GW of existing queue projects withdrew.16

Recent movement in the natural gas spot markets across the U.S. and Europe add another degree of uncertainty to
future operations. In 2022, European natural gas supply faced many challenges resulting from the war in Ukraine and
subsequent sanctions against Russia. Liquefied natural gas (LNG) imports into the EU and the U.K. in the first half of
2022 increased 66% over the 2021 annual average,17 primarily from U.S. exporters with operational flexibility. This
international natural gas demand is a new competitor for domestic spot-market consumers, resulting in significantly
higher fuel costs for PJM’s natural gas fleet.

This study assumes that, of the approximately 17.6 GW of natural gas generation in the queue, only those that are
proposed uprates of existing generation, or currently under construction, will complete.18 This results in 3.8 GW of
entry from under-construction natural gas resources to be completed for the 2023/2024 Delivery Year. While 12 GW
of natural gas have reached a signed Interconnection Service Agreement (ISA) stage, it is unclear what percentage
of this capacity may move forward. If significantly more natural gas capacity achieved commercial operation, it could
help avoid reliability issues.

Renewable Transition
PJM’s projected resource mix continues to evolve toward lower-carbon intermittent resources. Entry into the queue
from renewable and storage resources has been growing at an annualized rate of 72% per year since 2018, or 199
GW of capacity entry versus 2.8 GW commercializing and 42.1 GW withdrawn. This influx of renewable projects has
led to a joint effort between PJM and its stakeholders to enact queue reforms intended to clear the backlog of
projects, improve procedures around permitting and site control, simplify analysis by clustering projects, and
accelerate projects that don’t require network upgrades. FERC approved the proposed package in November 2022,
with expected implementation in 2023.

Commercial Probability and Expanding Beyond the Queue
PJM staff developed several forecasts of the rate by which projects successfully exit the queue (the “commercial
probability” of reaching an In-Service state). Since 1997, the PJM New Services Queue has tracked proposed
generation interconnection projects from their submittal and study stages to completion of an ISA and Wholesale
Market Participation Agreement (WMPA) and construction. At any point in the process, a resource may withdraw
from the queue, effectively ending its commercial viability.

16 This capacity represents natural gas projects that were submitted prior to 2020 and withdrawn in the 2020–2022 time frame.
17 Europe imported record amounts of liquefied natural gas in 2022, U.S. Energy Information Administration, June 14, 2022.
18 Under construction includes the New Service Queue Partially in Service – Under Construction and Under Construction statuses.

PJM © 2023 www.pjm.com | For Public Use 11 | P a g e
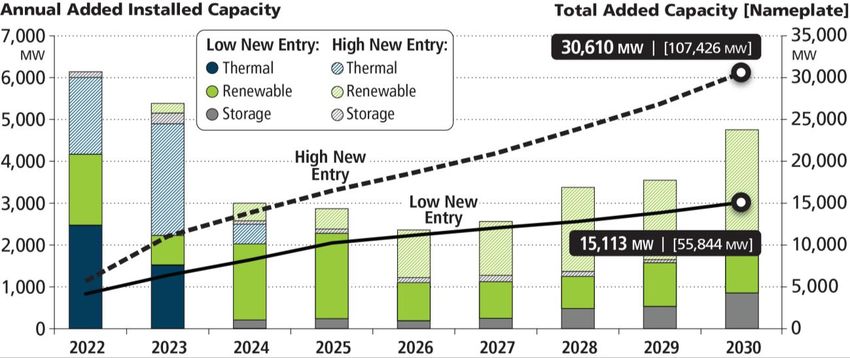
Energy Transition in PJM: Resource Retirements, Replacements & Risks

The study utilized a logistical regression classification algorithm to predict the probability of a project reaching an
In-Service entry (or Withdrawn exit) based on several properties of the project. A logistical regression searches for
patterns within training datasets, resulting in a model that can forecast a probability of a result. After applying the
logistical regression model for 10 years of historical project completion (Y-queue to present) without project stage,
approximately 15.3 GW-nameplate/8.7 GW-capacity were deemed commercially probable out of 178 GW of
projects examined.

The model results for thermal resources were reasonably in line with expectations. However, the model produced
extremely low entry from onshore wind, offshore wind, solar, solar-hybrid and storage resources. The uncertainty of
completion rates of newer resource types, like offshore wind, likely plays a role in these model outcomes. After
adjusting the new renewable capacity by Effective Load Carrying Capability (ELCC) derations, this commercial
probability analysis estimates net 13.2 GW-nameplate / 6.7 GW-capacity to the system by 2030, as shown in Figure 4.

Given that this process may not capture recent policy changes and fiscal incentives toward renewable and storage
development, and that the existing queue has fewer resources entered after 2026, PJM staff utilized two S&P Global
Power Market Outlook analyses’ generation expansion models. As estimates of future entry beyond the queue, these
models are used to provide additional insight for the two scenarios: “Low New Entry” utilizes the “Planning Model,”19
and “High New Entry” utilizes the “Fast Transition” model.20 Based on these models, PJM added additional capacity
to its commercial probability data in each scenario.

These forecasts of generation expansion are economic resource planning solutions, which take state RPS requirements
and capacity margins into account to ensure new renewable builds. Over the study period, the Low New Entry scenario
adds 42.6 GW-nameplate/8.4 GW-capacity to supply expectations, resulting in total entry of 55.8 GW-
nameplate/15.1 GW-capacity. The High New Entry scenario adds 107 GW-nameplate/30.6 GW-capacity after ELCC
derations. Net natural gas entry was approximately 5 GW, and renewables was 48.5 GW-nameplate/10.4 GW-capacity,
as shown in Figure 4.

19S&P Global, North American Power Market Outlook, June 2022, planning model. This planning case incorporated effects from
the 2021 Infrastructure Investment and Jobs Act, but not the 2022 Inflation Reduction Act.
20S&P Global, North American Power Market Outlook, Sept. 2022, Fast Transition model. This planning case assumes carbon
net neutrality by 2050 through the IRA and additional policies, such as state clean energy policies, and as such assumes
adjustments for increased electrification of heating, tax credits for renewable generation and higher levels of fossil retirements.
PJM © 2023 www.pjm.com | For Public Use 12 | P a g e
Energy Transition in PJM: Resource Retirements, Replacements & Risks

Figure 4. Forecast Added Capacity

Impact of Capacity Accreditation on Existing Renewables and Storage
In July 2021, FERC accepted PJM’s ELCC methodology for calculating unforced capacity values for intermittent
and energy storage capacity resource classes. The ELCC analysis21 examines load and resource performance
uncertainty, and calculates an hourly loss-of-load probability (LOLP) to meet a one-in-10 year loss of load
expectation (LOLE) adequacy criteria. The ELCC method examines the alignment of a given resource type’s capacity
to high risk hours, as well as the change in risk hours proportional to the changes in portfolio size. The adjustments to
accredited capacity went into effect in the 2023/2024 BRA executed in June 2022.

This study examined the current renewable generation fleet for the impact of future changes in capacity accreditation.
Today, there are approximately 3.5 GW of onshore wind and solar capacity resources participating in the RPM
capacity market as intermittent resources. From 2022 to 2030, this accredited capacity is expected to decline by
1.2 GW to 2.3 GW due to portfolio effects resulting in the increase of entry from other intermittent renewable
resources.22 This adjustment is consistent with the renewable expectations presented in the December 2021
Effective Load Carrying Capability (ELCC) Report.

21 Manual 20, Section 5: PJM Effective Load Carrying Capability Analysis
22Approximate nameplate needed to replace 1 MW of thermal generation: Solar – 5.2 MW; Onshore Wind – 14.0 MW;
Offshore Wind – 3.9 MW. These are average values.

PJM © 2023 www.pjm.com | For Public Use 13 | P a g e
Energy Transition in PJM: Resource Retirements, Replacements & Risks

Figure 5. Effective Load Carrying Capability (ELCC) Rating by Resource Type

Demand Expectations
Load forecasting is an important part of maintaining the reliability of the bulk electric system. Forecasting helps PJM
make decisions about how to plan and operate the bulk electric system in a reliable manner, and how to effectively
administer competitive power markets. PJM’s Resource Adequacy Planning Department publishes an annual Load
Forecast Report, which outlines “long-term load forecasts of peak-loads, net energy, load management, distributed
solar generation, plug-in electric vehicles and battery storage.”

Along with the energy transition, PJM is witnessing a large growth in data center activity. Importantly, the PJM
footprint is home to Data Center Alley in Loudoun County, Virginia, the largest concentration of data centers in the
world.23 PJM uses the Load Analysis Subcommittee (LAS) to perform technical analysis to coordinate information
related to the forecast of electrical peak demand. In 2022, the LAS began a review of data center load growth and
identified growth rates over 300% in some instances.24 The 2023 PJM Load Forecast Report incorporates
adjustments to specific zones for data center load growth, as shown in Figure 5.

23 See Loudoun County Department of Economic Development, 2023.
24 Load Analysis Subcommittee: Load Forecast Adjustment Requests, Andrew Gledhill, Resource Adequacy Planning, Oct. 27, 2022

PJM © 2023 www.pjm.com | For Public Use 14 | P a g e
Energy Transition in PJM: Resource Retirements, Replacements & Risks

Additionally, PJM is expecting an increase in electrification resulting from state and federal policies and regulations.
The study therefore incorporates an electrification scenario in the load forecast to provide insight on capacity need
should accelerated electrification drive demand increases.25 This accelerated demand increase is consistent with the
methodology used in the Emerging Characteristics of a Decarbonizing Grid paper.26 That paper found electrification to
have an asymmetrical impact on demand growth, with demand growth in the winter, mainly due to heating, more than
doubling that in the summer. This would move the bulk of the resource adequacy risk from the summer to the winter.

Figure 6 highlights how updated electrification assumptions and accounting for new data center loads have impacted
the summer peak between the 2022 and 2023 forecasts.27

Figure 6. Impacts of Electrification and Data Center Load on Forecasts

What Does This Mean for Resource Adequacy in PJM?
PJM projects resource adequacy needs through the Reserve Requirement Study (RRS). The purpose of the RRS is
to determine the required capacity or Forecast Pool Requirement for future years or delivery years based on load and
supply uncertainty. The RRS also satisfies the North America Electric Reliability Corporation/ReliabilityFirst
Adequacy Standard BAL-502-RFC-03, Planning Resource Adequacy Analysis, Assessment and Documentation,
which requires that the Planning Coordinator performs and documents a resource adequacy analysis that applies a
LOLE of one occurrence in 10 years. The RRS establishes the Installed Reserve Margin values for future delivery
years. For this study PJM used the most recent 2022 RRS, as well as the 2021 RRS for comparison.

25Electrification assumptions are 17 million EVs, 11 million heat pumps, 20 million water heaters, 19 million cooktops in PJM by
2037, built on top of the 2022 Load Forecast.
26 Energy Transition in PJM: Emerging Characteristics of a Decarbonizing Grid, May 17, 2022.
27 2023 Load Forecast Supplement, PJM Resource Adequacy Planning Department, January 2023.

PJM © 2023 www.pjm.com | For Public Use 15 | P a g e
Energy Transition in PJM: Resource Retirements, Replacements & Risks

Combining the resource exit, entry and increases in demand, summarized in Figure 7, the study identified some
areas of concern. Approximately 40 GW PJM’s fossil fuel fleet resources may be pressured to retire as load grows
into the 2026/2027 Delivery Year. At current low rates of renewable entry, the projected reserve margin would be
15%, as shown in Table 1. The projected total capacity from generating resources would not meet projected peak
loads, thus requiring the deployment of demand response. By the 2028/2029 Delivery Year and beyond, at Low New
Entry scenario levels, projected reserve margins would be 8%, as projected demand response may be insufficient to
cover peak demand expectations, unless new entry progresses at a levels exhibited in the High New Entry scenario.
This will require the ability to maintain needed existing resources, as well as quickly incentivize and integrate new
entry

 Reserve Margin Projections Under Study Scenarios
 Reserve Margin 2023 2024 2025 2026 2027 2028 2029 2030
 Low New Entry
 2023 Load Forecast 23% 19% 17% 15% 11% 8% 8% 5%
 Electrification 22% 18% 16% 13% 10% 7% 6% 3%
 High New Entry
 2023 Load Forecast 26% 23% 21% 19% 17% 16% 17% 15%
 Electrification 25% 22% 20% 18% 15% 14% 14% 12%

As witnessed during the rapid transition from coal resources to natural gas resources last decade, PJM markets
provide incentives for capacity resources. The challenge will be integrating the level of additional resources
envisioned to meet this demand, and therefore addressing issues such as resource capacity accreditation is critical in
the near term. The low entry rates shown in our Low New Entry scenario are illustrative of recent completion history
applied to the current queue. RTO capacity prices in recent auctions have been low for several delivery years, and
capacity margins have historically reached around 28% of peak loads. As capacity reserve levels tighten, the markets
will clear higher on the VRR curves, sending price signals to build new generation for reliability needs.

The 2024/2025 BRA, which executed in December 2022, highlighted another area of uncertainty. Queue capacity
with approved ISAs/WMPAs is currently very high, approximately 35 GW-nameplate, but resources are not
progressing into construction. There has only been about 10 GW-nameplate moving to in service in the past three
years. There may still be risks to new entry, such as semiconductor supply chain disruptions or pipeline supply
restrictions, which are preventing construction despite resources successfully navigating the queue process.

PJM © 2023 www.pjm.com | For Public Use 16 | P a g e
Energy Transition in PJM: Resource Retirements, Replacements & Risks

Figure 7. The Balance Sheet

For the first time in recent history, PJM could face decreasing reserve margins, as shown in Table 1, should these
trends – high load growth, increasing rates of generator retirements, and slower entry of new resources – continue.
The amount of generation retirements appears to be more certain than the timely arrival of replacement generation
resources, given that the quantity of retirements is codified in various policy objectives, while the impacts to the pace
of new entry of the Inflation Reduction Act, post-pandemic supply chain issues, and other externalities are still not
fully understood.

The findings of this study highlight the importance of PJM’s ongoing stakeholder initiatives (Resource Adequacy
Senior Task Force, CAPSTF, Interconnection Process Subcommittee), continued efforts between PJM and state and
federal agencies to manage reliability impacts of policies and regulations, and the urgency for coordinated actions to
shape the future of resource adequacy.

The potential for an asymmetrical pace within the energy transition, where resource retirements and load growth
exceed the pace of new entry, underscores the need for better accreditation, qualification and performance
requirements for capacity resources.

The composition and performance characteristics of the resource mix will ultimately determine PJM’s ability to
maintain the reliability of the bulk electric system. Managing the energy transition through collaborative efforts
of PJM stakeholders, state and federal agencies, and consumers will ensure PJM has the tools and resources
to maintain reliability.

PJM © 2023 www.pjm.com | For Public Use 17 | P a g e
You can also read


