THE EMPLOYMENT IMPACTS OF A LOW-CARBON FUEL STANDARD FOR MINNESOTA - Heidi Garrett-Peltier
←
→
Page content transcription
If your browser does not render page correctly, please read the page content below
THE EMPLOYMENT IMPACTS OF A
LOW-CARBON FUEL STANDARD
FOR MINNESOTA

Heidi Garrett-Peltier

Political Economy Research Institute

University of Massachusetts, Amherst

September 2012

THE EMPLOYMENT
                                                                          IMPACTS OF A
                                                                          LOW-CARBON FUEL
                                                                          STANDARD FOR
                                                                          MINNESOTA
                                                                          HEIDI GARRETT-PELTIER
                                                                          Political Economy Research Institute
                                                                          University of Massachusetts, Amherst

                                                                          September 2012

EXECUTIVE SUMMARY
In this study we estimate the employment impacts of                       transporting, and processing transportation fuels.
a low-carbon fuel standard (LCFS) in the state of                         When we extend the analysis to 2035, we find that a
Minnesota. We develop three scenarios by which the                        LCFS could create over 32,500 job-years in manu-
demand for transportation fuels in the state could                        facturing, installing, and building renewable energy
change by 2021, and further to 2035. Under each                           infrastructure and capacity, and an additional
scenario, we estimate the number of jobs that could                       12,000 jobs could be created in the ongoing produc-
be created in construction and manufacturing (CM)                         tion of this level of alternative transportation energy.
as the transportation fuel infrastructure expands, as                     Finally, in addition to the substantial net employment
well as the number of jobs that could be created in                       benefits, employment in the state’s oil refining sector
harvesting, transportation, and production (HTP) as                       decreases slightly under a LCFS, but losses are more
the supply of alternative fuels expands. We find that                     than offset by the significant employment gains in
a LCFS would significantly increase the demand for                        ethanol.
alternative fuels such as corn-based ethanol, cellulo-
sic ethanol, and bio-diesel, as well as increasing the                    INTRODUCTION
demand for electric vehicle charging stations and
                                                                          The state of Minnesota has established policies to
alternative fuel blending pumps. Over the next
                                                                          reduce its greenhouse gas emissions by increasing
ten years, enactment of a LCFS could result in
                                                                          its energy efficiency and use of renewable energy
the creation of over 7,500 jobs building alternative
                                                                          sources. Enacted in 2007, the Next Generation En-
energy capacity and infrastructure.1 In addition,
                                                                          ergy Act established a goal to reduce per capita use
over 1,200 jobs could be created in harvesting,
                                                                          of fossil fuels 15 percent by 2015, require that 25
                                                                          percent of all energy used in the state come from
1 Throughout this report, what we refer to as a ‘job’ is one full-time
position for one year, also known as a ‘job-year.’ The concept of ‘job-   renewable resources by 2025, and increase energy
year’ is explained in more detail below.
efficiency savings goals.2 Further, the Act sets a goal
of reducing greenhouse gases (GHG) to 30 percent Carbon intensity measures the use of carbon in
below 2005 levels by 2025 across all sectors. Ac- relation to a given economic or energy output.
cording to the Minnesota Pollution Control Agency, For example, carbon intensity can refer to the
statewide GHG emissions totaled 154.1 million tons
amount of carbon used per dollar of GDP, per
CO2-equivalent (CO2e) in 2005.3 The state must
therefore reduce GHG emissions by 46.2 million tons vehicle mile traveled, or per gallon of fuel. In the
CO2e annually, to emit no more than 107.9 million transportation sector, it is useful to measure
tons CO2e per year by 2025. carbon intensity per vehicle mile traveled or
In this study, we focus on strategies to reduce per megajoule of energy used. Reducing carbon
greenhouse gas emissions by reducing the carbon
intensity implies that we can achieve the same
intensity [see text box at right] of transportation fuels
in the state. The transportation sector accounts for outcome, such as driving a certain number of
over one-quarter of all greenhouse gas emissions,4 miles, while using less carbon.
thus it is vital to reduce transportation emissions in
order to meet statewide goals. There are a number
in response to increased consumption of transporta-
of strategies that the state could pursue to meet
tion fuels. Employment increases the least in the
these reductions, including the use of more renewa-
baseline scenario, in which fuel shares remain the
ble transportation fuels and electric vehicles. A LCFS
same as today, and employment increases the most
would bring about reductions in carbon emissions
in the LCFS scenario, in which production of renewa-
intensity while allowing flexibility in determining how
ble fuels increases dramatically in response to a low-
best to meet these reductions.
carbon fuel standard.
This study focuses on the employment impacts of a
LCFS in the state of Minnesota. We evaluate three BACKGROUND: LOW-CARBON FUEL
possible scenarios in which the transportation fuel
STANDARDS AND RENEWABLE
mix differs:
we assume no change to the distribution of FUEL STANDARDS
transportation fuel consumption; One method to reduce the carbon intensity of trans-
we assume that the fuel mix will change in portation fuels is to implement a LCFS. These stan-
response to a national Renewable Fuel Standard dards have been implemented in other states such
(RFS2); as California and Oregon, and in other parts of the
we outline a more aggressive change in the fuel world such as British Columbia and the European
mix in response to instituting a statewide LCFS. Union. The goal of a LCFS is to reduce the carbon
intensity of transportation fuels by a certain amount
For each of these three scenarios, we estimate the
before a certain date. California’s LCFS was created
employment that would result from building the ca-
by Executive Order of the California Governor in
pacity to produce these alternative fuel mixes as well
2007 and was established as a regulation in January
as the ongoing employment that would be created
2010. This LCFS calls for a 10 percent reduction in
from producing these transportation fuels in-state.
the carbon intensity of California’s transportation
We find that in all scenarios, employment increases
fuels by 2020. The California LCFS applies to any
transportation fuel that is sold, supplied, or offered
2 Laws of Minnesota for 2007, CHAPTER 136–S.F.No. 145,
https://www.revisor.mn.gov/data/revisor/slaws/2007/0/136.pdf.
for sale in California. The types of transportation
3 www.pca.state.mn.us/index.php/topics/climate-change/climate-
fuels to which the LCFS applies include gasoline,
change -in-minnesota/greenhouse-gas-emissions-in-minnesota.html. diesel, compressed or liquefied natural gas, biogas,
4 www.eia.doe.gov/oiaf/1605/ggrpt/index.html#economy. electricity, hydrogen, fuel blends containing more
THE EMPLOYMENT IMPACTS OF A LOW-CARBON FUEL STANDARD FOR MINNESOTA / PAGE 2
than 10 percent ethanol, biodiesel (blended or billion gallons of renewable fuels, or 8.25 percent of
B100), denatured fuel ethanol (E100), and any other a refiner’s or importer’s gasoline and diesel volume.
liquid or non-liquid fuel.
By reducing the carbon intensity of its transporta-
Existing low-carbon fuel standards set an example tion fuels and increasing its production of renewable
for states such as Minnesota to follow in order to fuels, Minnesota can not only remain a leader in the
meet reductions in fossil fuel use. In addition, the production and consumption of low-carbon fuels
U.S. Environmental Protection Agency recently re- within the U.S., but can also increase employment
vised the Renewable Fuel Standards (RFS) program within the state.
which is required under the Energy Independence
Below we develop three scenarios in which renewa-
and Security Act of 2007 (EISA). This new set of
ble fuels play an increasingly large role to meet the
standards, known as RFS2, specifies criteria for re-
forecast demand for transportation fuels in the state,
newable fuels and the feedstocks used to produce
and we estimate the employment impacts attributa-
them, and also sets volumetric requirements for the
ble to each scenario. We base the overall level of
production of biofuels.5 The fuels and pathways
transportation fuel consumption on forecasts in the
modeled which meet or exceed the respective re-
Energy Information Administration’s Annual Energy
quired minimum greenhouse gas (GHG) reduction
Outlook 2011, and then alter the mix of fuels used to
standards include:
meet projected consumption levels in 2021 and
corn-based ethanol using efficient technologies;
2035. In the first scenario (baseline scenario), the
soy based biodiesel;
shares of gasoline, diesel, and alternative fuels re-
biodiesel made from waste grease, oils, and fats;
main the same as today’s shares. In the second sce-
sugarcane based ethanol; and
nario (RFS2 scenario), the shares change according
fuels derived from cellulosic materials (including
to assumptions in the AEO2011, which include a
wood, grasses, agricultural waste, and non-edible
national Renewable Fuel Standard (RFS2). In the
parts of plants).
third scenario (LCFS scenario), the shares change
The RFS2 sets specific greenhouse gas reduction more aggressively in favor of renewable fuels and
thresholds. The lifecycle GHG emissions of a qualify- transportation electricity in response to implementa-
ing renewable fuel must be less than the lifecycle tion of a LCFS. The details of each scenario as well
GHG emissions of the 2005 baseline average gaso- as the methodology used to develop them are ex-
line or diesel fuel that it replaces. Four different lev- plained below. Further, we estimate the construction
els of reductions are required for the four different and manufacturing jobs that would result from build-
renewable fuel standards: ing new transportation energy capacity, as well as
renewable fuel: 20 percent the ongoing jobs in harvesting, transportation, and
advanced biofuel: 50 percent production, that would be created from expanding
biomass-based diesel: 50 percent the supply of renewable fuels.
cellulosic biofuel: 60 percent
According to the national renewable fuel standard, STRATEGIES TO REDUCE THE CARBON
the volumetric requirements for renewable fuels are INTENSITY OF TRANSPORTATION
as follows: Total renewable fuels must reach 36 bil- FUELS IN MINNESOTA
lion gallons by 2022, with 16 billion of these from
cellulosic biofuel. The standard for 2010 is 12.95 Strategies within the ethanol industry
Corn-based ethanol is the primary renewable trans-
5 "Feedstock" is raw material that can be used for energy production,
portation fuel sold in the U.S. It is blended with gas-
either as energy for heating and powering industrial processes, or as
raw materials from which liquid transportation fuels such as ethanol oline and sold as ‘E-10’– a blend which contains
can be produced. up to 10 percent ethanol and 90 percent gasoline.
THE EMPLOYMENT IMPACTS OF A LOW-CARBON FUEL STANDARD FOR MINNESOTA / PAGE 3Nationally, the ethanol industry produces more than While ethanol is a renewable fuel, its current mode
10 billion gallons of fuel ethanol annually, represent- of production relies heavily on the use of fossil fuels
ing 7 percent of the gasoline supply, and 70 percent for process heat and electricity. In order to reduce
of all gasoline sold contains some ethanol.6 As of the lifecycle carbon intensity of ethanol, plants can
2010, Minnesota had 21 ethanol plants with a com- shift to renewable energy sources to meet their pro-
bined capacity of 1.1 billion gallons annually.7 Min- cess energy needs.
nesota is thus a leading state in ethanol production.
A study by Kaliyan, Morey, and Tiffany published in
Various studies have shown that corn-based ethanol 2011 analyzes the greenhouse gas emissions reduc-
has a lower carbon intensity than petroleum-based tions that could be achieved by replacing fossil fuels
gasoline. While estimates vary depending on the in ethanol plants with biomass such as corn stover
precise location of the plant, the feedstock, and type and ethanol co-products.10 The authors find that
of process energy used, lifecycle analysis has shown conventional ethanol production (using natural gas
that corn-grain ethanol produced with the latest for process heat) reduces GHGs by 38.9 percent
technologies has a carbon intensity that is nearly compared to gasoline, over the lifecycle and without
equal to or significantly below that of gasoline.8 In- accounting for indirect land use change. If the natu-
creasing the use of ethanol can be a prominent ral gas is replaced by corn stover for process heat,
strategy to reduce the carbon intensity of transporta- the emissions reductions rise to 57.7 percent of
tion fuels, depending on the feedstock used. And gasoline emissions, and if corn stover is used for
changes within the ethanol industry itself can further both process heat and electricity, reductions rise to
reduce this fuel’s carbon intensity. Within the indus- 79.1 percent of gasoline.
try, we evaluate four strategies to reduce the carbon
Replacing fossil fuels with renewable sources for
intensity of transportation fuels: 1) using renewable
ethanol production will yield employment gains with-
energy in place of fossil fuels for the processing of
in the state of Minnesota. As existing ethanol plants
ethanol; 2) increasing the use of flex-fuel vehicles
are retrofitted to use biomass for process heat, both
which use a higher proportion of ethanol to gasoline;
short term and ongoing jobs will be created. In the
3) increasing the blend wall for low-level ethanol
short term, it will create jobs in manufacturing and
blends; and 4) increasing production of cellulosic
installing the new equipment used to generate re-
ethanol. Below we discuss each of these strategies.
newable process heat and electricity. Over the life of
USING RENEWABLE ENERGY IN PLACE OF FOSSIL the plant, it will also create and maintain jobs in ag-
FUELS FOR THE PROCESSING OF ETHANOL riculture and transportation as biomass is grown,
harvested, and transported to facilities within the
The production of ethanol is an energy-intensive pro- state.
cess. According to the Department of Energy, as of
2006, 96 percent of all ethanol plants in the U.S. INCREASING THE USE OF FLEX-FUEL VEHICLES
used natural gas as their primary source of process
Flex fuel vehicles (FFVs) are designed and built to run
energy. Not including the cost of the feedstock, fuel
on fuel blends which contain up to 85 percent etha-
costs (mainly natural gas) account for about one-
nol and 15 percent gasoline, termed ‘E-85.’ These
third of operating expenses in an ethanol plant.9
vehicles can also operate on lower-level blends or
6Mark D. Stowers, “The U.S. Ethanol Industry,” Regional Economic
simply on conventional gasoline. While the manufac-
Development, Federal Reserve Bank of St. Louis, Vol. 5, No. 1, 2009.
7Minnesota Department of Agriculture, “Minnesota Ethanol Industry”,
2010. Book, Edition 2.
8For a range of estimates based on various feedstocks, see National 10 N. Kaliyan, R.V. Morey, and DG Tiffany, March 2011, “Reducing
Academy of Sciences (2009) Liquid Transportation Fuels from Coal Lifecycle Greenhouse Gas Emissions of Corn Ethanol by Integrating
and Biomass, Washington D.C., National Academies Press. Biomass to Produce Heat and Power at Ethanol Plants,” Biomass and
9 U.S. Department of Energy, Office of EERE, Biomass Energy Data Bioenergy, Vol 35, Issue 3, pp 1103-1113.
THE EMPLOYMENT IMPACTS OF A LOW-CARBON FUEL STANDARD FOR MINNESOTA / PAGE 4ture of FFVs has risen dramatically in recent years, $11,237.15 Of Minnesota’s 3,080 total fuel stations,
the owners of these vehicles still rely primarily on E- only 354 currently host E85 pumps. Retrofitting or
10 as their fuel source, rather than E-85. As of 2010, installing new blending pumps at 1,000 additional
about 8 percent of vehicles sold or leased were flex- stations would mean that flex fuel vehicles would be
fuel vehicles.11 However, only about 5 percent of the- able to refuel with E85 at almost half of all fueling
se were used as FFVs.12 The use of higher level stations in Minnesota.
blends by FFV owners has been limited for two rea-
sons: (1) limited availability of E85 pumps at fueling INCREASING THE BLEND WALL FOR LOW-LEVEL
stations; and (2) lack of knowledge by FFV owners. ETHANOL BLENDS
Increasing the use of E85 in FFVs is one strategy to Until recently, 10 percent ethanol was the maximum
lower the carbon content of transportation fuels in approved blend rate as determined by the U.S. Envi-
Minnesota. In order to increase the use of FFVs, con- ronmental Protection Agency. While other states allow
sumer awareness must be raised and more blending E-10 to include any amount of ethanol equal to or
pumps must be installed.13 Minnesota already leads less than 10 percent, Minnesota mandates that the
the country in its number and share of fuel stations full 10 percent be included in E-10 blends. In October
which have E85 pumps. As of 2010, there are E85 2010, the EPA announced that blends up to E15
pumps in 354 fueling stations, which accounted for were safe for vehicles produced since 2007. Further
over 17 percent of all E85 pumps nationwide.14 testing is needed to see if vehicles older than 2007
However, Minnesota has a total of 3,080 fuel sta- can use E15 without any adverse effects. In the short
tions, thus more blending pumps must be installed term, it is therefore unlikely that blends beyond E10
statewide to increase the availability and use of E85. will be offered for sale. However, if blends such as
E12 or E15 are proven safe for a wider range of vehi-
The cost of adding E85 fueling to existing gasoline cles, then we may see greater use of these low-level
stations varies greatly. The major variables include blends. As described below, we assume that low level
whether the station owner needs to install multiple blends remain at E10 in the baseline and RFS2 sce-
new multiproduct dispensers or just to convert one narios. In the LCFS scenario, we assume that the
dispenser. New tank installation costs could include blend wall will increase to E20 by 2035.
concrete and excavation work, which themselves
could vary widely. Other variables include whether INCREASING PRODUCTION OF CELLULOSIC ETHANOL
owners can sell previously used tanks in the second-
Minnesota currently does not have any commercially
hand market, whether the project will include a new
operable cellulosic ethanol plants. This fuel has been
canopy, how large the tank is, and in which region
produced commercially in very small volumes in other
the station is located. Given these factors, the cost
states. Several commercial cellulosic ethanol produc-
of a new tank installation can range from $50,000
tion plants are under construction nationwide, and
to $200,000 with a mean cost of $71,735 and
intensive research and development is rapidly ad-
a median of $59,153. The costs of converting/
vancing the state of cellulosic ethanol technology.16
retrofitting an existing tank/dispenser are much
lower, with a mean of $21,031 and a median of Cellulosic ethanol offers a promising route to achiev-
ing dramatic reductions in the carbon content of
DOE, Alternative Fuels and Advanced Vehicles Data Center,
11 transportation fuels. While each gallon of gasoline
www.afdc.erergy.gov/afdc/data /vehicles.html. produces 25 pounds of CO2-equivalent GHG emis-
12 Table 1061 from Census Bureau Statistical Abstract 2010. sions, cellulosic ethanol produces on average fewer
13 Blending pumps allow users to select from a range of etha-
nol/gasoline blends, including low-level blends such as E10 and high-
level blends such as E85. 15NREL, “Cost of Adding E85 Fueling Capability to Existing Gasoline
14Energy Information Administration, Stations: NREL Survey and Literature Search.”
http://tonto.eia.doe.gov/state/state_energy_profiles.cfm?sid=MN 16 DOE, Alternative Fuels & Advanced Vehicles Data Center.
THE EMPLOYMENT IMPACTS OF A LOW-CARBON FUEL STANDARD FOR MINNESOTA / PAGE 5than 4 pounds.17 Replacing corn-based ethanol with blend of up to 2 percent biodiesel and 98 percent
cellulosic ethanol could help Minnesota reduce the diesel), B5 (a blend of up to 5 percent biodiesel and
carbon intensity of its transportation sector and also 95 percent diesel), B20 (a blend of up to 20 percent
contribute to the national renewable fuel standard biodiesel and 80 percent conventional diesel) or
(RFS2) which mandates the production of 16 billion B100 (up to 100 percent biodiesel). Biodiesel is con-
gallons of cellulosic ethanol by 2022. However, this sidered a ‘drop-in’ fuel and therefore can be used in
industry is not yet commercially viable in Minnesota. any engine which uses conventional diesel and is
In other states, cellulosic biorefineries are coming compatible with current diesel infrastructure. One
online, either as new plants or as integrated parts of current drawback to using B100 is that, like diesel,
corn ethanol plants. in extremely low temperatures (below 0°F) it be-
comes too viscous. There are countermeasures
Project LIBERTY, an integrated corn cellulose
available, but this viscosity issue must be consid-
biorefinery, will transform a corn ethanol plant in
ered. However, at most times of the year, both B20
Iowa owned by the POET company to an integrated
and B100 can be used in any diesel engine with no
plant which will produce 25 million gallons of cellulo-
change in performance.
sic ethanol (corn-based) in addition to 100 million
gallons of corn ethanol. The project will cost upwards The production and use of biodiesel remains rela-
of $200 million, will reduce the use of fossil fuels by tively limited in the U.S., based in part on the expira-
100 percent, and will create 30 new jobs at the facil- tion of the biodiesel tax credit in 2009, which led to
ity. It is expected to be operational in late 2013.18 the idling or reduced production of biodiesel in many
plants. Biodiesel is, however, a promising renewable
AEBiofuels opened an integrated facility in Montana
fuel with overall greenhouse gas emissions signifi-
in 2008 which processes both starch (corn) and cel-
cantly below those of gasoline. Conventional diesel
lulosic feedstocks. In this integrated facility, energy
emissions are 15 percent below gasoline, while B20
and labor costs are virtually unchanged, feedstock
emissions are 27 percent below, and B100 emis-
costs are lower for cellulosic feedstock, and tax in-
sions are 76 percent below gasoline and 72 percent
centives are higher, resulting in a rise in profit per
below conventional diesel.20 Minnesota has contin-
gallon. Up to 35 percent cellulosic feedstock can be
ued to be a strong supporter of biodiesel. The state
integrated into the ethanol production process.19
passed one of the first biodiesel blending mandates
These integrated biorefineries offer an example that in the country in 2002, requiring 2 percent blending
Minnesota could follow to increase the refining of of biodiesel in all diesel fuels sold in Minnesota. In
cellulosic feedstock and integrate it into its dominant 2008, Minnesota significantly increased this man-
corn ethanol industry. Cellulosic ethanol would dis- date, requiring the amount of biodiesel blended into
place starch-based ethanol in blended gasoline. diesel fuel sold in the state to increase incrementally
to a B20 blend by 2015.21 While consumption levels
Biodiesel are still relatively low in Minnesota, biodiesel use
Biodiesel is a renewable alternative to petroleum could expand rapidly if blending pumps were in-
diesel and is produced from both new and used stalled at fueling stations throughout the state.
vegetable and animal fat sources. It is sold in the The infrastructure and employment effects of ex-
U.S. at varying levels, but generally is sold as B2 (a panding the use biodiesel would be similar to those
17Mark D. Stowers, “The U.S. Ethanol Industry,” Regional Economic 20 Author’s calculations based on the standard assumptions con-
Development, Federal Reserve Bank of St. Louis, Vol. 5, No. 1, 2009. tained in the GREET model (Greenhouse Gases, Regulated Emissions,
18 See www.projectliberty.com.. and Energy Use in Transportation) maintained by the Argonne Nation-
19AEBiofuels, “Looking Beyond Conventional Oil: Cellulosic Ethanol,” al Laboratory.
December 2008. 21 www.mda.state.mn.us/renewable/biodiesel/aboutbiodiesel.aspx.
THE EMPLOYMENT IMPACTS OF A LOW-CARBON FUEL STANDARD FOR MINNESOTA / PAGE 6for high level blends of corn ethanol: new tanks and 2,802 electric vehicles were sold or leased nation-
dispensing equipment would need to be installed at wide. An additional 312,386 hybrid electric vehicles,
fueling stations, which would create short-term jobs in (HEVs) led by the Toyota Prius, were sold or leased
construction and manufacturing. In the longer term, in 2008. Combined, EVs and HEVs made up only
biodiesel would create more jobs within the state of about 2 percent of all vehicle sales. As with FFVs,
Minnesota than petroleum-based diesel, on par with the increased use of EVs will require behavioral
the employment differences between corn ethanol change and infrastructure improvements, and there-
and conventional gasoline. This is mainly due to the fore EVs represent medium-term and longer-term
fact that petroleum-based diesel and gasoline are solutions to reducing the carbon content of transpor-
refined from imported crude oil while the feedstocks tation in Minnesota.
for biodiesel and ethanol can be grown and harvested
Increased use of EVs will require increased produc-
within the state, creating jobs in agriculture, ware-
tion of these vehicles. As of October 2010, there are
housing, transportation, and related industries.
no manufacturers of mass-produced electric vehicles
As of June 2012, three biodiesel refineries have within the state of Minnesota. Thus the state is un-
been established in Minnesota. Their total combined likely to benefit from the increased manufacture of
capacity is about 63 million gallons per year.22 Most EVs in the short term. In the medium term, jobs will
of the biodiesel capacity in Minnesota is based on be created in infrastructure development as EV
soybean oil. The biorefineries also use recycled and charging stations are installed in homes and public
rendered grease and oils as feedstocks. Yellow areas. EV charging stations cost between $1,000 and
grease is currently the cheapest feedstock for bio- $10,000, with home charging stations being less ex-
diesel, but these refineries could also process corn pensive and public curbside charging stations being
oil, soybean oil, and various other vegetable and an- more expensive.23 The average installed cost for a
imal fat sources. home charging station ranges from $1,500 to
$2,500.24 The cost of public charging stations has a
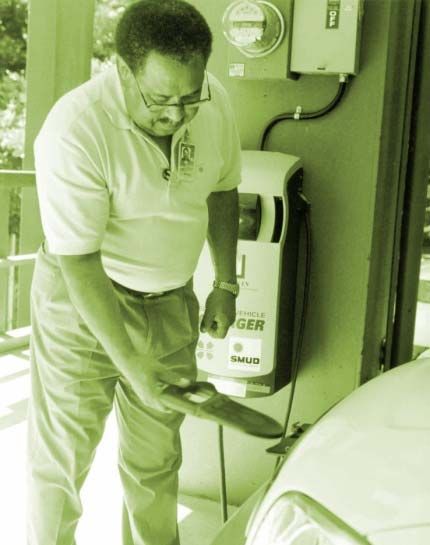
Electric vehicles larger range, depending on the location of the instal-
Electric vehicles offer another promising long term lation. According to the Alternative Fuels and Ad-
approach to reducing the carbon intensity of trans- vanced Vehicles Data Center of the Department of
portation and achieving significant emissions reduc- Energy, public charging infrastructure should consist
tions. EVs are considered zero-emissions vehicles, of charging locations where vehicle owners are highly
since they do not produce any tailpipe emissions. concentrated, such as shopping centers, city parking
They are nonetheless responsible for some emis- lots and garages, airports, hotels, government offices,
sions since they need to be plugged in and re- and other businesses. Widespread public charging
charged. If they are connected to the grid, which is infrastructure will help facilitate the penetration of all-
predominantly powered by fossil fuels, EVs will have electric vehicles and plug-in hybrid electric vehicles
lower emissions than gasoline-powered cars, but will and help address consumer ‘range anxiety’ for vehi-
still produce some carbon emissions. If powered by cles with limited range. The manufacture of charging
renewable sources such as wind, solar, or geother- stations as well as the installation of these stations
mal energy, EVs can indeed become zero-emissions can both lead to job creation, as electric vehicles be-
vehicles and can contribute to large decreases in the come a more prominent transportation alternative.
carbon intensity of transportation.
Until very recently, electric vehicles have seen limited
production and adoption in the U.S. In 2008, only
23 http://earth911.com/news/2010/07/20/nyc%E2%80%99s-first-
ev-charging-station-now-open/.
22 Ibid. 24 www.afdc.energy.gov/afdc/vehicles/electric_charging_home.html.
THE EMPLOYMENT IMPACTS OF A LOW-CARBON FUEL STANDARD FOR MINNESOTA / PAGE 7METHODOLOGY In 2011, motor gasoline accounts for approx-
imately 89 percent of transportation fuel
Fuel mix scenarios consumption, corn ethanol accounts for 10
percent and diesel accounts for the remaining 1
The three scenarios developed in this report were
percent. These percentages remain constant from
derived by using forecasts of transportation energy
2011 to 2035.
consumption and then altering the mix of fuels and
electricity used to meet the forecast consumption Sales of biodiesel, cellulosic ethanol, and
levels. The total fuel use levels for 2021 and 2035 transportation electricity are less than one
were taken from the ‘Reference Case for Light-Duty percent over the period.
Vehicle Energy Consumption’ in the Energy Infor-
Blended gasoline is E10 (90 percent gasoline and
mation Administration’s Annual Energy Outlook
10 percent corn-based ethanol) since Minnesota
2011. In 2010, Minnesota’s share of transportation
has a mandate to blend a minimum of 10 percent
energy was 2.1 percent of the national total, and we
ethanol into blended gasoline.
kept this share the same in 2021 and 2035. Applying
this percentage to the AEO2011 forecasts yielded a Biodiesel is B2 (2 percent biofuel and 98 percent
total level of fuel use for the state of Minnesota for diesel) in 2011. In 2021 and 2035 biodiesel is
these years. This level of fuel consumption can be B10.
met through various combinations of gasoline, diesel,
RFS2 SCENARIO: SHARES OF FUEL USE CHANGE AS
electricity, and alternative fuels. We altered these
IN THE AEO2011 REFERENCE CASE
combinations to create the following scenarios.
The total level of energy use for transportation in
BASELINE SCENARIO: SHARES OF FUEL USE REMAIN
Minnesota is about 339 trillion BTU in 2011,
CONSTANT OVER TIME
rising to 342.4 trillion BTU in 2021 and 371.4
The total level of energy use for transportation in trillion BTU in 2035. This is 2.1 percent of the
Minnesota is about 339 trillion BTU in 2011, national total fuel use forecasts for light-duty
rising to 342.4 trillion BTU in 2021 and 371.4 vehicles in the AEO2011.
trillion BTU in 2035. This is 2.1 percent of the
In the RFS2 scenario, we alter the shares of
national total fuel use forecasts for light-duty
transportation fuels according to assumptions in
vehicles in the AEO2011.
Baseline scenario fuel shares RFS2 scenario fuel shares
1 1
electricity electricity
0.8 0.8
biofuel (blended with diesel) biofuel (blended with diesel)
0.6 0.6 ethanol (cellulosic)
ethanol (cellulosic)
0.4 ethanol (corn) 0.4 ethanol (corn)
diesel
0.2 diesel 0.2
gasoline
gasoline
0 0
2011 2021 2035 2011 2021 2035
Baseline scenario fuel use (trillion BTU) RFS2 scenario fuel use (trillion BTU)
400 400
350 electricity 350 electricity
300 biofuel (blended with diesel) 300 biofuel (blended with diesel)
250 250
ethanol (cellulosic) ethanol (cellulosic)
200 200
ethanol (corn) ethanol (corn)
150 150
100 diesel 100 diesel
50 gasoline 50 gasoline
0 0
2011 2021 2035 2011 2021 2035
THE EMPLOYMENT IMPACTS OF A LOW-CARBON FUEL STANDARD FOR MINNESOTA / PAGE 8the AEO2011 Reference Case for Light-Duty LCFS scenario fuel shares
1
Vehicle Use, which include implementation of electricity
0.8
RFS2, an updated national renewable fuel biofuel (blended with diesel)
0.6 ethanol (cellulosic)
standard.
0.4 ethanol (corn)
In 2011, motor gasoline accounts for approx- 0.2
diesel
gasoline
imately 89 percent of transportation fuel con- 0
2011 2021 2035
sumption, corn ethanol accounts for 10 percent
LCFS scenario fuel use (trillion BTU)
and diesel accounts for the remaining 1 percent.
400
electricity
In 2021, the share of gasoline consumption falls 350
300 biofuel (blended with diesel)
slightly, to 87 percent, and falls further to 81 250 ethanol (cellulosic)
200
percent by 2035. 150
ethanol (corn)
100 diesel
The share of diesel fuel increases from 1 percent 50
gasoline
0
in 2011 to 2 percent in 2021 and 3 percent in 2011 2021 2035
2035.
The share of gasoline falls from 89 percent in
The share of ethanol grows from 10 percent in 2011 to 84 percent in 2021 and 66 percent in
2011 to 11 percent in 2021 and 13 percent in 2035.
2035, with corn ethanol growing in the first period
Diesel grows from a 1 percent share to 4 percent
and falling in the second period as cellulosic
in 2021 and 7 percent in 2035.
ethanol accounts for a larger share. Cellulosic
ethanol accounts for zero percent of ethanol in Both corn-based ethanol and cellulosic ethanol
2011, 10 percent in 2021, and 40 percent in grow over the period, accounting for a combined
2035. total of 10 percent of fuel consumption in 2011,
11 percent in 2021, and 25 percent in 2035.
Blended gasoline is E10 throughout the period. Cellulosic ethanol accounts for zero percent of
Biodiesel is B2 in 2011 and B10 in 2021 and ethanol consumption in 2011, 10 percent in
2035. 2021 and 40 percent in 2035.
LCFS SCENARIO: SHARES OF FUEL USE CHANGE IN
Blended gasoline is E10 in 2011 and 2021 and
RESPONSE TO A LOW-CARBON FUEL STANDARD E20 in 2035.
The total level of energy use for transportation in Biodiesel is B2 in 2011 and B10 in 2021 and
Minnesota is about 339 trillion BTU in 2011, 2035.
rising to 342.4 trillion BTU in 2021 and 371.4
Estimating employment
trillion BTU in 2035. This is 2.1 percent of the
national total fuel use forecasts for light-duty For this report we use an input-output (I-O) model to
vehicles in the AEO2011. analyze the statewide employment effects of various
methods to meet a LCFS in Minnesota. An I-O model
In the LCFS scenario, shares of fuel change in
is useful for analyzing the direct, indirect, and in-
response to a low-carbon fuel standard, which
duced levels of job creation that result from an in-
increases the shares of ethanol, biodiesel, and
crease in demand for any sector or combination of
electricity, and decreases the share of gasoline.
sectors in the economy. For this analysis, we use
To simulate the effects of the LCFS, we double
IMPLAN’s version 3.0 software along with Minnesota
the growth of ethanol, biodiesel, and electric
state data from 2008 for the direct and indirect em-
vehicles as compared to the RFS2 scenario.
ployment effects, and we model the induced effects
separately. Each of these is discussed below.
THE EMPLOYMENT IMPACTS OF A LOW-CARBON FUEL STANDARD FOR MINNESOTA / PAGE 9DIRECT EFFECTS Induced employment, we have shown elsewhere, is
equivalent to approximately forty percent of the total
The direct employment effects are the jobs that are
of direct and indirect employment at the national
created from an increase in demand for the products
level.25 However, at the state level, induced effects
or services of a given industry. Using the example of
are lower, since a household within a U.S. state will
the ethanol industry, the direct jobs that are created
buy goods imported not only from outside the U.S.
from an increase in demand for ethanol include jobs
but also from outside the state. Therefore the in-
in grain farming, truck transportation, and
duced effect in Minnesota will tend to be lower than
biorefining. An I-O model estimates the number of
the induced effect at the national level. In order to
jobs resulting from a given level of spending. Thus
adjust for this interstate trade, we compare the sup-
we can compare the direct jobs created through, for
ply/demand ratio of all commodities within the U.S.
example, $1 million in increased ethanol demand
to the supply/demand ratio of all commodities with
versus $1 million in increased gasoline demand.
Minnesota, using IMPLAN data in both cases. The
INDIRECT EFFECTS ratio in Minnesota is 70 percent of the U.S. ratio.
Using this information to scale our induced effect
Indirect employment represents the jobs that are downward, we estimate that induced jobs in Minne-
created throughout the supply chain of the industry sota are approximately 30 percent of the combined
we are analyzing. Using the example of ethanol once direct and indirect jobs.
again, the indirect jobs are created in industries such
as support services for agriculture and wholesale
RESULTS
trade – industries which supply goods or services to
the ethanol industry. It is important to note here that Changes in fuel consumption
the indirect effects of any program are lower at the
state level than they would be at the national level. The charts on page 11 show changes in the levels of
The ethanol industry in Minnesota will, for example, consumption of various transportation fuels in re-
source many of its goods and services from within sponse to the scenarios outlined above. We evaluate
Minnesota, but will also source some of its goods these changes for the period 2012 to 2021, which
from out of state. By using the Minnesota-specific reflects the ten-year period during which the first
data set from IMPLAN, these leakages out of state phase of a LCFS could be implemented. We further
are captured in our analysis and in the estimates we extend the analysis to 2035, the final year of fuel
present below. The indirect employment effects consumption forecasts contained in the AEO2011.
could be raised if more of the supply chain were lo- From 2012 to 2021, consumption of motor gasoline
cated within the state. But for the sake of this report, increases under the baseline scenario but decreases
we rely on the current supply chain structure of Min- slightly under the RFS2 scenario and further declines
nesota industries. under the LCFS scenario. Diesel fuel consumption
decreases slightly in the baseline scenario as biofuel
INDUCED EFFECTS makes up a larger share of biodiesel - the blend in-
The third tier of employment creation results from creases from B2 to B10, so although biodiesel as a
the induced effect. When workers in the direct (e.g., whole increases, the level of diesel fuel decreases in
ethanol) and indirect (e.g., warehousing) industries the baseline scenario. Diesel consumption increases
spend their earnings, they create demand for goods in both the RFS2 and LCFS scenarios as biodiesel
and services in other sectors of the economy, such consumption grows. Corn-based ethanol increases in
as retail and healthcare. The initial increase in de- the baseline and LCFS scenarios, but decreases
mand for ethanol thus results not only in newly em-
ployed workers in the ethanol industry, but also in 25See the discussion on pp 32-33 of “Green Prosperity” by Pollin,
new employment in indirect and induced industries. Wicks-Lim, and Garrett-Peltier available at www.peri.umass.edu.
THE EMPLOYMENT IMPACTS OF A LOW-CARBON FUEL STANDARD FOR MINNESOTA / PAGE 10Changes in fuel use production, there is a slight de-
from 2012 to 2021 (trillion BTU) cline in corn ethanol production
in the RFS2 scenario. Corn etha-
15
nol production grows in both the
10 baseline and LCFS scenarios.
Cellulosic ethanol production is
5
non-existent in the baseline sce-
0 nario but grows significantly by
Baseline Scenario
2035 in both the RFS2 and LCFS
-5
RFS2 Scenario scenarios.
-10 LCFS Scenario
Employment impacts
-15
gasoline diesel ethanol ethanol biofuel electricity We estimate two categories of
(corn) (cellulosic) (diesel blend)
Changes in fuel use employment that could result
from 2012 to 2035 (trillion BTU) from each of our three scenarios.
45
The first we refer to as construc-
tion-manufacturing (CM) jobs.
35 Baseline Scenario These are the jobs that will be
RFS2 Scenario created in building new capacity
25
LCFS Scenario and infrastructure to meet in-
15 creased demands for transporta-
tion fuels. CM jobs will be directly
5
created as new facilities are
-5 built, existing facilities are retro-
fit, and new pumps and charging
-15
gasoline diesel ethanol ethanol biofuel electricity stations are installed. Additional-
(corn) (cellulosic) (diesel blend) ly, jobs will be created in manu-
facturing the equipment and ma-
chinery which will be installed in
slightly in the RFS2 scenario as overall ethanol con- these new plants. For any one project, such as
sumption increases but cellulosic ethanol displaces building a new ethanol plant, CM jobs will have a
some corn ethanol. Combined corn-based and cellu- limited duration; however, building the infrastructure
losic ethanol grows in all three scenarios. Electricity required to meet increased demands for transporta-
also grows in all three scenarios but its level remains tion fuels will require the work of a generation. Con-
almost negligible by 2021. struction and manufacturing workers will be needed
By 2035, gasoline consumption increases signifi- for multiple projects, and therefore while each pro-
cantly in the baseline scenario, as the share of total ject has a limited duration, CM jobs are in no way
fuel consumption remains the same but the level short-term.
increases. Gasoline consumption is nearly flat over The second category of employment that we esti-
the period in the RFS2 scenario, as renewable fuels mate is what we call HTP employment. These are
meet increased demand for transportation fuels. In jobs in harvesting, transporting, and producing the
the LCFS scenario, gasoline is displaced by renewa- transportation fuels. While CM jobs will be created in
ble fuels. Diesel fuel and biodiesel grow in all three building the transportation fuel infrastructure, HTP
scenarios, as do electricity and ethanol. As cellu- jobs will continue from year to year as long as the
losic ethanol makes up a larger share of ethanol demand for fuel is level or growing.
THE EMPLOYMENT IMPACTS OF A LOW-CARBON FUEL STANDARD FOR MINNESOTA / PAGE 11For both CM jobs and HTP jobs, the level of employ- The baseline scenario entails a modest increase in
ment creation varies across the three scenarios, with ethanol consumption by 2021, which can be met by
employment increasing as the state moves more increasing the capacity of existing biorefineries but
aggressively toward alternative transportation ener- will also necessitate installation of blender pumps
gy. While refining both gasoline and ethanol is cur- for distribution of E85. Based on the forecast capaci-
rently done within the state of Minnesota, the ty needs, we estimate that no new biorefineries will
feedstock used to produce these fuels varies widely be built. Only three blender pumps are forecast to
in its employment creation within the state. Gasoline be installed in this scenario, creating only one addi-
and diesel are refined from imported oil, therefore tional job-year.
creating no employment in feedstock production.
In the RFS2 scenario, no new additional corn ethanol
The ethanol and biodiesel industries, on the other
plants are built, but there is one new cellulosic plant
hand, create jobs in-state in agriculture, transporta-
by 2021, and two existing corn ethanol plants are
tion, and warehousing. Since Minnesota is currently
retrofit to use biomass for process energy. In addi-
a net exporter of renewable fuels, we assume in this
tion, 2,726 blender pumps for ethanol are installed
analysis that all increased consumption of renewable
in this scenario so that all of Minnesota’s 3,080 re-
fuels is met by in-state production of those fuels.
fueling stations have one blending pump; 36 bio-
Thus in each scenario, alternative fuels make up
diesel blending pumps as well as 1,350 EV charging
an increasingly large share of transportation en-
stations are installed. The manufacturing jobs to
ergy, and harvesting-transportation-production em-
produce these technologies as well as the construc-
ployment grows concomitantly.
tion jobs to install them total about 3,500 job-years
CONSTRUCTION AND MANUFACTURING EMPLOYMENT when we include direct, indirect, and induced ef-
CREATION fects. Over half of those are the direct jobs in con-
struction and manufacturing.26
A number of jobs will be created in construction and
manufacturing in order to increase the capacity of The LCFS scenario entails a greater expansion of
renewable fuel production and to build up the infra- renewable fuels production capacity. In this scenario,
structure to enable vehicles to use higher blends of one new corn ethanol plants is built and seven exist-
ethanol and biodiesel as well as electricity. For each ing plants are retrofit; one new cellulosic plants is
of the three scenarios, we forecast the needed level built; 2,726 ethanol blender pumps are installed;
of capacity change (as shown in the figures on page 118 biodiesel pumps are installed and 2700 EV
11 and tables 1 and 2) and then estimate the asso- charging stations are installed. Over 3,800 direct job-
ciated costs and employment of building this capaci- years are created in construction and manufacturing,
ty. In table 1 (page 13), we show the jobs that could and over 7,500 job-years are created when we in-
be created over the next ten years, from 2012 to clude the indirect and induced effects.
2021. In table 2, (page 14) we show the jobs that In table 2, we estimate the CM jobs created in these
could be created if we extend the forecast to 2035. three scenarios during the period 2012 through
All of these estimates are in ‘job-years,’ meaning that 2035.
if a project lasts multiple years (such as construction
of a new ethanol plant), the total number of job-years
would be divided by the number of years of the pro-
ject to yield the number of people employed full-time 26 As described above, these estimates were derived using Minneso-
for the life of the project. As an example, if a new ta-specific industry data. While construction jobs will necessarily be
plant took three years to build and required 300 job- created in the local economy, manufacturing jobs could be created
within or outside of the state. For these short-term employment esti-
years, then 100 people would be employed full-time mates we assume that manufactured goods will be produced in-state
for the three year period. as well as imported from out-of-state, according to the current shares
of production and imports in these industries.
THE EMPLOYMENT IMPACTS OF A LOW-CARBON FUEL STANDARD FOR MINNESOTA / PAGE 12TABLE 1 : CONSTRUCTION AND MANUFACTURING ( CM ) JOBS - YEARS
CREATED BETWEEN 2012 AND 2021
New corn New Retrofitting Installing Installing New Charging Total CM jobs
2021 ethanol cellulosic ethanol blender pumps blender pumps biodiesel stations across all
plants plants plants for E85 for B10/B20 plants for EVs strategies
Additional capacity need-
ed (trillion BTU) 0.342 0 0 - - 0.355 -
Units needed 0 0 0 3 0 0 0
Baseline scenario
Total cost ($million) - - - 0.18 - - -
Direct job-years - - - 1 - - - 1
Indirect job-years - - - 0 - - - 0
Induced job-years - - - 0 - - - 0
Total jobs - - - 1 - - - 1
Additional capacity need-
ed (trillion BTU) 0 3.69 - - - 0.709 -
Units needed 0 1 2 2726 36 0 1350
RFS2 Scenario
Total cost ($million) - 171.77 118.5 163.56 2.16 - 3.38
Direct job-years - 687 474 572 8 - 16 1,757
Indirect job-years - 326 225 393 5 - 8 957
Induced job-years - 304 210 290 4 - 7 815
Total jobs - 1,317 909 1,255 17 - 31 3,529
Additional capacity need-
ed (trillion BTU) 1.591 3.896 - - - 1.506 -
Units needed 1 1 7 2726 118 1 2700
LCFS Scenario
Total cost ($million) 171.77 171.77 414.87 163.56 7.08 52 6.75
Direct job-years 687 687 1,659 572 25 208 32 3,870
Indirect job-years 326 326 788 393 17 99 16 1,965
Induced job-years 304 304 734 290 13 92 14 1,751
Total jobs 1,317 1,317 3,182 1,255 54 399 61 7,585
In the baseline scenario, ethanol consumption con- plants are built and 30 percent of current ethanol
tinues to expand, with one new corn-ethanol plant plants are retrofit to use biomass for process heat. In
and 33 ethanol blender pumps installed. Biodiesel addition, 2,726 ethanol blender pumps are installed
also increases slightly, with four new biodiesel blend- (so that all Minnesota refueling stations have one),
ing pumps installed. In total this scenario leads to 102 biodiesel blender pumps are installed, and
over 1,300 new job-years between 2012 and 2035 if 2,900 EV charging stations are installed. Over 6,000
we include the direct, indirect, and induced effects direct job-years are created in construction and man-
from building the new plants and manufacturing and ufacturing, and close to 13,000 job-years are created
installing pumps. if we include the indirect and induced effects.
The RFS2 scenario has greater ethanol production, Employment increases more dramatically under the
though all new plants are cellulosic. Six cellulosic LCFS scenario, which sees a significant increase in
THE EMPLOYMENT IMPACTS OF A LOW-CARBON FUEL STANDARD FOR MINNESOTA / PAGE 13TABLE 2 : CONSTRUCTION AND MANUFACTURING ( CM ) JOB - YEARS
CREATED BETWEEN 2012 AND 2035
New corn New Retrofitting Installing Installing New Charging Total CM jobs
ethanol cellulosic ethanol blender pumps blender pumps biodiesel stations across all
2035 plants plants plants for E85 for B10/B20 plants for EVs strategies
Additional capacity need-
ed (trillion BTU) 3.206 0 - - - 0.392 -
Units needed 1 0 0 33 4 0 0
Baseline scenario
Total cost ($million) 171.77 - - 1.98 0.24 - -
Direct job-years 687 - - 7 1 - - 695
Indirect job-years 326 - - 5 1 - - 332
Induced job-years 304 - - 4 0 - - 308
Total jobs 1,317 - - 15 2 - - 1,334
Additional capacity need-
ed (trillion BTU) 0 21.82 - - - 1.346 -
Units needed 0 6 7 2726 102 1 2900
RFS2 Scenario
Total cost ($million) - 1,030.60 414.87 163.56 6.12 52 7.25
Direct job-years - 4,122 1,659 572 21 208 34 6,616
Indirect job-years - 1,958 788 393 15 99 17 3,270
Induced job-years - 1,824 734 290 11 92 15 2,966
Total jobs - 7,905 3,182 1,255 47 399 66 12,854
Additional capacity need-
ed (trillion BTU) 25.16 39.09 - - - 2.779 -
Units needed 6 10 21 2726 249 1 5700
LCFS Scenario
Total cost ($million) 1,030.60 1,717.67 1,244.61 163.56 14.94 52 14.25
Direct job-years 4,122 6,871 4,978 572 52 208 67 16,870
Indirect job-years 1,958 3,264 2,365 393 36 99 33 8,148
Induced job-years 1,824 3,040 2,203 290 26 92 30 7,505
Total jobs 7,905 13,175 9,546 1,255 115 399 130 32,525
ethanol production from both corn and cellulosic HARVESTING-TRANSPORTATION-PRODUCTION
feedstocks. In this scenario, six new corn-based eth- EMPLOYMENT EFFECTS
anol plants are built, ten cellulosic plants are built,
In addition to the CM jobs created by building new
and all current ethanol plants are retrofit. In addition,
transportation energy capacity, a number of HTP jobs
2,726 ethanol blender pumps, 249 biodiesel blender
will be created to meet the new demands for trans-
pumps, and 5,700 charging stations are installed.
portation energy. HTP employment will grow in all
Close to 17,000 direct job-years are created and ap-
three scenarios, with stronger growth in the RFS2
proximately 32,500 direct, indirect, and induced job-
and LCFS scenarios. As production shifts more
years are created under this scenario.
toward renewable fuels using feedstocks grown
in-state, employment in agriculture, warehousing, and
THE EMPLOYMENT IMPACTS OF A LOW-CARBON FUEL STANDARD FOR MINNESOTA / PAGE 14transportation increase. In the baseline scenario, the industry. In the LCFS scenario, there are job losses in
oil refining industry sees a small amount of employ- oil refining, but these losses are more than offset by
ment growth and corn-based ethanol sees more employment creation in ethanol. In all three scenarios,
growth. In the RFS2 scenario, oil refining stays rela- employment in biodiesel rises.
tively level by 2021 with some growth by 2035; corn
Tables 3 and 4 show the direct, indirect, and induced
ethanol production falls but cellulosic production in-
jobs that could be created in each of our three sce-
creases, with overall employment gains in the ethanol
narios. Table 3 focuses on the period from 2012 to
TABLE 3 : CHANGE IN HARVESTING - TRANSPORTATION - PRODUCTION 2021 and Table 4 on the period from 2012 to 2035.
( HTP ) JOBS FROM 2012 TO 2021
Oil refining : Oil refining: Oil refining: Ethanol: Ethanol: Net change
Biodiesel
gas diesel total corn cellulosic in jobs
Direct jobs 5 -1 4 45 0 33 82
Baseline
scenario
Indirect jobs 25 -3 22 14 0 17 53
Induced jobs 9 -1 8 18 0 15 41
Total jobs 39 -4 35 77 0 64 176
Direct jobs -6 5 -1 -35 380 65 410
scenario
Indirect jobs -30 25 -5 -11 118 33 135
RFS2
Induced jobs -11 9 -2 -14 149 30 164
Total jobs -47 39 -8 -59 647 128 708
Direct jobs -22 17 -5 211 401 138 746
scenario
Indirect jobs -110 87 -24 65 124 71 237
LCFS
Induced jobs -40 31 -9 83 158 63 295
Total jobs -172 135 -37 359 683 272 1,277
TABLE 4 : CHANGE IN HARVESTING - TRANSPORTATION - PRODUCTION
( HTP ) JOBS FROM 2012 TO 2035
Oil refining : Oil refining: Oil refining: Ethanol: Ethanol: Net change
Biodiesel
gas diesel total corn cellulosic in jobs
Direct jobs 47 0 47 425 0 36 508
Baseline
scenario
Indirect jobs 234 0 234 131 0 18 384
Induced jobs 84 0 84 167 0 16 268
Total jobs 365 0 365 723 0 71 1,159
Direct jobs 1 15 16 -99 2,248 123 2,289
scenario
Indirect jobs 5 74 79 -31 695 63 807
RFS2
Induced jobs 2 27 29 -39 883 56 929
Total jobs 8 116 124 -168 3,826 243 4,025
Direct jobs -93 37 -56 3,336 4,028 255 7,562
scenario
Indirect jobs -464 185 -279 1,031 1,245 131 2,128
LCFS
Induced jobs -167 67 -100 1,310 1,582 116 2,908
Total jobs -724 289 -435 5,677 6,855 502 12,598
THE EMPLOYMENT IMPACTS OF A LOW-CARBON FUEL STANDARD FOR MINNESOTA / PAGE 15In each table, we see the various levels of job crea- increases in the baseline scenario, decreases in the
tion and loss in oil refining, ethanol production (both RFS2 scenario as corn is displaced by cellulosic eth-
corn-based and cellulosic) and biodiesel production. anol, and increases substantially in the LCFS scenar-
As mentioned above, we assume here that all in- io. Cellulosic ethanol remains at zero employment in
creased consumption of transportation fuels will be the baseline scenario but increases dramatically in
met by in-state production. If gasoline, diesel, or al- both the RFS2 and LCFS scenarios. Biodiesel em-
ternative fuels are produced out of state and import- ployment grows in all three scenarios.
ed into Minnesota, then job creation will of course be
These results suggest that a shift to alternative
lower in Minnesota.
transportation fuels such as ethanol and biodiesel
In table 3 we see that by 2021, oil refinery jobs, as will yield employment gains in the state over the next
well as the indirect and induced jobs connected to ten years and beyond. A more moderate approach to
them, increase in the baseline scenario but decrease shifting transportation energy, such as that forecast
in the RFS2 and LCFS scenarios as more of Minneso- by the AEO2011 and estimated here in the RFS2
ta’s transportation energy needs are met by alterna- scenario, yields small employment losses in oil refin-
tive sources. A LCFS entails larger decreases in oil ing but large gains in alternative fuels production. A
refinery employment, with up to 37 jobs lost over the more aggressive approach, achievable with a LCFS,
period as oil refining shrinks. Meanwhile, ethanol would entail larger losses in the oil refining sector
production increases in all three scenarios, with but even greater gains in ethanol and biodiesel pro-
a greater expansion in the LCFS scenario. Corn duction. These results not only suggest that a LCFS
ethanol production shrinks in the RFS2 scenario as will yield economic benefits to the state of Minneso-
cellulosic ethanol substitutes for some corn-based ta, but also imply that oil refineries have an oppor-
ethanol. In the LCFS scenario, both corn and cellulo- tunity to offset any job losses by adding ethanol
sic ethanol expand. Over the 10 year period, the net refining to their operations. By 2021, over 1,200 net
change in jobs is positive in all three scenarios, with ongoing jobs could be created in the state of Minne-
176 jobs created in the baseline scenario (including sota, and by 2035 that number could rise above
direct, indirect, and induced), about 700 jobs in the 12,000. These jobs would be created in harvesting,
RFS2 scenario, and over 1,200 jobs in the LCFS transporting, and processing alternative fuels.
scenario. These are ongoing jobs in harvesting feed-
stock, warehousing and transporting the feedstock, CONCLUSION
and processing the fuel. The number of HTP jobs
reported here will be maintained as long as fuel pro- Minnesota is a national leader in alternative fuel
duction continues. production and consumption. With the enactment of
a low-carbon fuel standard, the state could also be a
Table 4 extends the analysis to 2035. This table in- leader in carbon emissions reductions. With a LCFS
cludes the jobs created over the next ten years (cap- modeled after one such as California’s, Minnesota
tured in table 3) as well as the additional jobs could reduce the carbon intensity of its transporta-
needed by 2035 in order to meet increased produc- tion fuels by 10 percent in 10 years. To do so would
tion of transportation fuels. In table 4 we see that oil require increased production of alternative fuels
refining jobs, as well as the indirect and induced such as ethanol (both corn-based and cellulosic) and
jobs created in relation to refining, increase by 365 biodiesel; changes within the ethanol industry, such
under the baseline scenario. Oil refinery and related as using biomass for process energy; and behavioral
employment increases by 124 total jobs in the changes and infrastructure improvements that would
RFS2 scenario and falls by over 400 direct, indirect, enable consumers to use higher blends of ethanol
and induced jobs in the LCFS scenario. These job and biodiesel as well as electric vehicles.
losses are more than offset by job gains in the etha-
nol industry. Once again, corn ethanol employment
THE EMPLOYMENT IMPACTS OF A LOW-CARBON FUEL STANDARD FOR MINNESOTA / PAGE 16You can also read