Enhanced Frequency Stability of SAW Yarn Tension Sensor by Using the Dual Differential Channel Surface Acoustic Wave Oscillator
←
→
Page content transcription
If your browser does not render page correctly, please read the page content below
sensors
Article
Enhanced Frequency Stability of SAW Yarn Tension Sensor by
Using the Dual Differential Channel Surface Acoustic
Wave Oscillator
Yang Feng , Wenbo Liu and Ben Wang *

 School of Information Science and Technology, Hangzhou Normal University, Hangzhou 311121, China
 * Correspondence: 20170056@hznu.edu.cn

 Abstract: This paper presents a 60 MHz surface acoustic wave (SAW) yarn tension sensor incorporat-
 ing a novel SAW oscillator with high-frequency stability. A SAW delay line was fabricated on ST-X
 quartz substrate using the unbalanced-split electrode and bi-directional engraving slots. The dual
 differential channel delay linear acoustic surface wave oscillator is designed and implemented to
 test yarn tension, which can effectively remove the interference of temperature, humidity, and other
 peripheral factors through differential design. The yarn tension sensor using the surface acoustic
 wave has high-precision characteristics, and the SAW delay line oscillator is designed to ensure
 the test system’s stable operation. The effect of time and tension on oscillator frequency stability
 is studied in detail, and the single oscillator and the dual differential channel system were tested,
 respectively. After using the dual differential channel system, the short-term frequency stability
 from is reduced from 1.0163 ppm to 0.17726 ppm, the frequency accuracy of the tension sensor is
 improved from 134 Hz to 27 Hz, and the max frequency jump steady is reduced from 2.2395 ppm to
 0.45123 ppm.

 Keywords: surface acoustic wave (SAW); yarn tension sensor; dual differential channel circuit;
 oscillators frequency stability

Citation: Feng, Y.; Liu, W.; Wang, B.
Enhanced Frequency Stability of
SAW Yarn Tension Sensor by Using
 1. Introduction
the Dual Differential Channel Surface
Acoustic Wave Oscillator. Sensors The yarn tension is an essential indicator of measuring the quality of the yarn product,
2023, 23, 464. https://doi.org/ which directly affects the balance and stability of the product quality, the production
10.3390/s23010464 efficiency, and the subsequent processing [1]. Appropriate yarn tension makes the winding
 bobbin roll efficient, increasing the production efficiency of winding, twisting, weaving,
Academic Editors: Pai Zheng,
 and knitting [2–4]. Therefore, selecting an appropriate detection circuit is necessary to
Tao Peng, Yuchun Xu, Chao Liu
 ensure the precision and stability of the yarn tension sensor’s output signal [5].
and Xi Wang
 At present, the commonly used sensors for detecting yarn tension are based on phase
Received: 30 November 2022 detection systems [6], amplitude detection systems [7], the phase lock loop (PLL) detection
Revised: 24 December 2022 method [8], direct digital synthesizer (DDS) scanning detection [9], and mixing detection
Accepted: 26 December 2022 method [10]. Among them, phase detection and amplitude detection systems are used in
Published: 1 January 2023 the largest amounts; however, both of them are low sensitivity [11]. The way to select the
 PPL and DDS circuit makes the detection circuits very complicated [12]. In addition, to
 simplify the detection circuits and obtain high precision and stable detection signals, the
 mixing detection circuit is presented [13].
Copyright: © 2023 by the authors.
 The yarn tension sensor is based on the surface acoustic wave device and oscillation
Licensee MDPI, Basel, Switzerland.
 circuit. Two factors affect the frequency stability of the SAW oscillator (SAWO): one is
This article is an open access article
distributed under the terms and
 the performance of the SAW device, and the other is the oscillation circuit’s noise [14–16].
conditions of the Creative Commons
 This paper focused on the frequency stability of SAWO and solved the following two
Attribution (CC BY) license (https://
 critical problems:
creativecommons.org/licenses/by/ (1) The following measures are taken to minimize the second order of the surface acoustic
4.0/). wave devices. First, this is accomplished by reducing the electrode reflection by using

Sensors 2023, 23, 464. https://doi.org/10.3390/s23010464 https://www.mdpi.com/journal/sensors
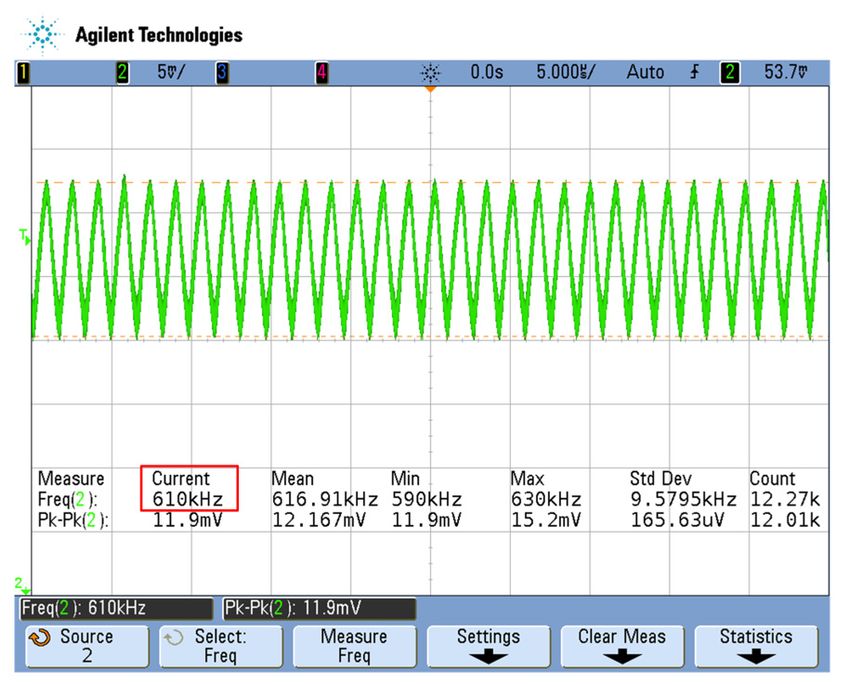
Sensors 2023, 23, x FOR PEER REVIEW 2 of 16

Sensors 2023, 23, 464 2 of 15
 (1) The following measures are taken to minimize the second order of the surface acous-
 tic wave devices. First, this is accomplished by reducing the electrode reflection by
 using the unbalanced-split electrode [17]. Second, this is accomplished by reducing
 the
 the unbalanced-split electrode [17].
 sound–electricity reclamation (SER)Second, this is the
 by choosing accomplished
 ST-X quartzby as reducing
 the piezoe-the
 sound–electricity reclamation
 lectric substrate [18]. (SER) by
 Third, reducing thechoosing the ST-X
 interference quartz
 of bulk as the
 acoustic piezoelectric
 wave (BAW)
 substrate [18].bi-directional
 by engraving Third, reducing the interference
 engraving of bulk acoustic
 slots of the piezoelectric wave
 substrate (BAW) by
 [19].
 engraving bi-directional engraving slots of the piezoelectric substrate
 (2) To solve the temperature interference, the dual differential channel SAWO is de- [19].
 (2) To solveThe
 signed. the temperature interference,
 dual differential the dual
 channel SAWO differential
 consists of thechannel SAWOline
 double delay is designed.
 oscilla-
 The
 tors, an integrated mixer circuit, and the LC low pass filter. At the same time, thean
 dual differential channel SAWO consists of the double delay line oscillators,
 integrated mixer
 signals source circuit,
 circuit andand the LC
 voltage low pass
 regulator filter.
 circuits areAtdesigned,
 the sameandtime,
 then the signals
 Agilent
 source
 E5061Acircuit
 ENA-L and
 wasvoltage
 used toregulator circuits the
 test and analyze are PCB
 designed,
 board.and then Agilent E5061A
 ENA-L wasisused
 This paper to test and
 organized analyzeAfter
 as follows. the PCBthis board.
 introductory Section 1, Section 2 pre-
 This
 sented paper
 the is organized
 principle as follows.
 of the SAWO After thischannel
 dual differential introductory
 circuit.Section 1, Section
 The design 2 pre-
 and prep-
 sented
 arationthe
 of principle
 the SAW of thetensor
 yarn SAWOsensor
 dual differential
 are shown in channel
 Sectioncircuit. The design
 3. In Section 4, theand
 testprepa-
 and
 ration of theofSAW
 application yarndifferential
 the dual tensor sensor are of
 channel shown in Section
 the SAWO 3. InConclusions
 are given. Section 4, the
 are test
 drawnand
 application
 in Section 5.of the dual differential channel of the SAWO are given. Conclusions are drawn
 in Section 5.
 2. Principle of the SAWO Dual Differential Channel Circuit
 2. Principle of the SAWO Dual Differential Channel Circuit
 Figure 1 shows the dual differential surface acoustic wave oscillator system. It can be
 Figure
 divided 1 shows
 into the dual differential surface acoustic wave oscillator system. It can be
 three parts:
 divided into three parts:
 (1) Two identical SAWOs. One of the SAWOs applies yarn tension on the piezoelectric
 (1) Two identical
 substrate, SAWOs.
 namely, One of the
 the detection SAWOs
 channel; applies
 another yarn is
 SAWO tension on the piezoelectric
 the reference channel.
 (2) substrate,
 An integratednamely, theWhen
 mixer. detection channel;
 the output anothersignals
 frequency SAWOofisthe
 thetwo
 reference
 SAWO channel.
 are added
 (2) An integrated mixer. When the output frequency signals of the two
 to the mixer, the output signal of the mixer is the frequency sum and frequency SAWO are added
 dif-to
 the mixer,
 ference. the output signal of the mixer is the frequency sum and frequency difference.
 (3)
 (3) LC
 LC low-pass
 low-pass filter.
 filter. When the output
 When the output signal
 signalof ofthe
 themixer
 mixerpasses
 passesthrough
 throughthe
 thelow-pass
 low-pass
 filter,
 filter, the output signal of the low-pass filter is the frequency difference (that is,is,the
 the output signal of the low-pass filter is the frequency difference (that the
 frequency
 frequency difference
 difference in the output
 in the output signal
 signalof ofthe
 themixer).
 mixer).

 Figure1.1.The
 Figure Theschematic
 schematic of
 of SAW
 SAW yarn
 yarn tension sensor with
 with dual
 dual differential
 differentialcircuit
 circuitsystem.
 system.

 In
 InFigure
 Figure 1, SAWO1
 SAWO1 generate
 generatethe
 thesine
 sinewave
 wave V1,Vand
 signal
 signal 1 , and the output
 the output is .is
 frequency
 frequency
 fSAWO2
 1 . SAWO2 create
 create thethe sine
 sine wave
 wave signal V2,Vand
 signal 2 , and
 the the output
 output frequency
 frequency is is. Signals
 f 2 . Signals V 1 and
 V1 and V2
 Ventered into
 2 entered thethe
 into integrated mixer
 integrated AD835,
 mixer AD835, andandthethe
 signal output
 signal outputfrequency
 frequency is is
 3, where 3
 V 3 , where
 V 3 is the frequency sum and frequency difference of V 1 and V 2 (V1 ± V2 ). After the mixed
 output, signal V 3 is input to the LC low pass filter, the frequency sum of f 1 and f 2 are
 filtered out, and only the frequency difference of f 1 and f 2 is left.
Sensors 2023, 23, 464 3 of 15

 In this system, SAW1 is used to measure the yarn tension, and SAW2 is used as a
 reference. The output signals V1 of the SAWO1 can be expressed as:
 √
 V1 = 2U1 sin(2π f 1 t + ϕ1 ) (1)

 where U1 is the effective value of the output voltage of SAWO1, f 1 is the frequency of
 the output signal of the SAWO1, and ϕ1 is the initial phase angle of the output signal
 of SAWO1.
 The output signal V2 of the SAWO2 can be expressed as:
 √
 V2 = 2U2 sin(2π f 2 t + ϕ2 ) (2)

 where U2 is the effective value of the output voltage of SAWO2, f 2 is the frequency of
 the output signal of the SAWO2, and ϕ2 is the initial phase angle of the output signal
 of SAWO2.
 The mixing circuit adopts an integrated mixer AD835 as the core signal processing
 circuit. AD835 is a voltage output multiplier produced by analog devices, which can
 complete the function of W = XY + Z. The X and Y input signals range from −1 V to
 +1 V, and the bandwidth is up to 250 MHz. It is suitable for mixing the output signals of
 dual SAWO.
 When the output signals V1 and V2 pass through the integrated mixer AD835 circuit,
 the signals of the two SAWOs will be mixed, and the signal V3 after mixing is:

 h√ V3 = V1ih × V2
 √ i
 = 2U1 sin(2π f 1 t + ϕ1 ) 2U2 sin(2π f 2 t + ϕ2 ) (3)
 = 2U1 U2 {cos[2π ( f 1 − f 2 ) + ( ϕ1 − ϕ2 )] − cos[2π ( f 1 + f 2 ) + ( ϕ1 + ϕ2 )]}

 In Equation (3), the mixing signal contains f 1 − f 2 and f 1 + f 2 signals. According
 to Figure 1, the mixer output signal V3 passes through the low-pass filter, and the output
 signal V4 is:
 V4 = K L U1 U2 cos[2π ( f 1 − f 2 )t + ( ϕ1 − ϕ2 )] (4)
 where K L is the magnification of the low pass filter.
 The simultaneity of the input supply voltage Vi applied to the dual surface acoustic
 wave oscillator system and the symmetry of the system, concerning the initial phase of the
 SAWO1 and the SAWO2, should be:

 ϕ1 = ϕ2 (5)

 By substituting Equation (5) into Equation (4), the output signal V4 is converted into:

 V4 = K L U1 U2 cos[2π ( f 1 − f 2 )t] == KU1 U2 cos(2π∆ f LPF t) (6)

 where ∆ f LPF is the frequency difference of SAWO1 and SAWO2.
 According to Equation (6), when the dual differential SAWO is affected by external
 interference, the output signal is still ∆ f LPF = f 1 − f 2 . So, the design of a dual channel
 can suppress external interference to a certain extent and realize the stability and anti-
 interference of the system.
 However, in practice, because the device structure cannot be completely symmetric,
 the component distribution is somewhat different, and the device parameters cannot be
 entirely consistent, so the difference between the frequency f 1 of the SAWO1 and the f 2 of
 the SAWO2 will not be utterly equal to zero. Therefore, before the test, it is necessary to
 determine the essential calibration value f 00 of the detection and the reference channels.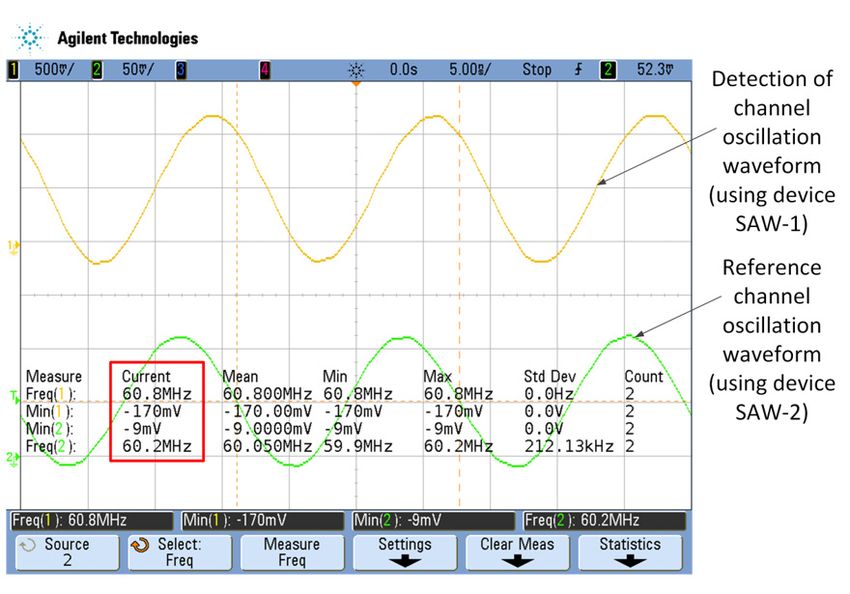
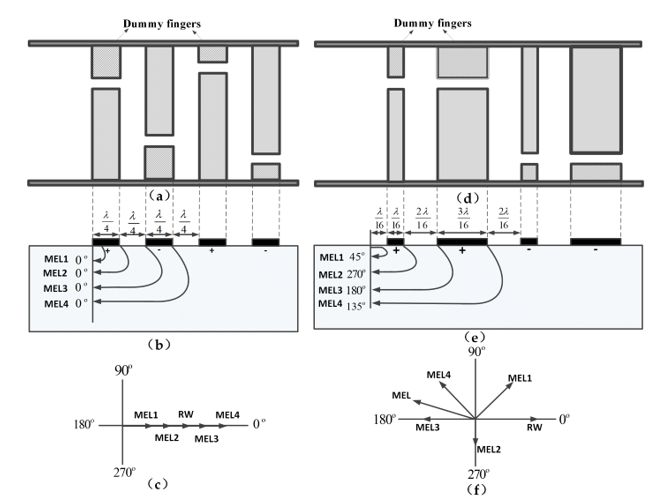
Sensors 2023, 23, 464 4 of 15

 3. Design and Preparation of the SAW Yarn Tensor Sensor
 3.1. SAW Delay Line
 As the core of SAWO, the frequency response of SAW will directly affect the perfor-
 mance of the whole circuit. For the excellent frequency characteristics of SAW devices,
 it is necessary to select a piezoelectric substrate with a high electromechanical coupling
 coefficient and improve the side lobe and bulk acoustic wave suppression ability. Therefore,
 the SAW devices are optimized from the following three aspects.
Sensors 2023, 23, x FOR PEER REVIEW 5 of 16
 (1) Choosing the unbalanced-split electrode to solve the electrode reflection and side lobe
 of the SAW devices, as shown in Figure 2.

 Figure
 Figure 2. Electrode
 2. Electrode reflection
 reflection of of single
 single electrodes
 electrodes IDTs
 IDTs andunbalanced-split-electrode
 and unbalanced-split-electrodeIDTs.
 IDTs.(a)
 (a)Sin-
 Single
 gleelectrodes
 electrodesIDTs; (b)(b)
 IDTs; Mass
 Massload (MEL)
 load reflection
 (MEL) of single
 reflection electrodes
 of single IDTs;IDTs;
 electrodes (c) Phase synthesis
 (c) Phase diagram
 synthesis
 diagram of single
 of single electrodes
 electrodes IDTs;IDTs; (d) Unbalanced-split
 (d) Unbalanced-split electrodes
 electrodes IDTs;IDTs; (e) Mass
 (e) Mass loadload (MEL)
 (MEL) reflec- of
 reflection
 tionunbalanced-split
 of unbalanced-split electrodes IDTs; (f) Phase synthesis diagram of unbalanced-split electrodes
 electrodes IDTs; (f) Phase synthesis diagram of unbalanced-split electrodes IDTs.
 IDTs.
 Single electrode IDT is arranged in a periodic λ/2 (Figure 2a), and the regenerated
 Table 1. Piezoelectric
 waves substrate
 (RW) are caused materials
 by the metaland their In
 electrode. . Figure 2b, MEL1, MEL2, MEL3, and MEL4
 are the mass/electrical load reflection reflected by the edge of each metal electrode, which is
 Material SiO2 SiO2 SiO2 LiTaO3 LiTaO3 LiTaO3
 of the same phase. Therefore, the electrode reflection received by the centre of the transducer
 Direction of
 is the sum of all electrode reflections,
 ST-X 42.75as shown inY-X
 0Y-X Figure 3c.Y-Z
 The unbalanced-split
 X-1120Y 420electrode
 Y-X
 propagation
 width is λ/16 and 3λ/16, with an interval of 2λ/16, as shown in Figure 2d. Figure 2e

 /% synthesis diagram
 is the phase 0.14 0.16
 of the 0.23 0.66
 unbalanced-split-electrode 0.75
 interdigital 7.6
 transducers
 Material
 (IDT). The total phaseLiNbO LiNbO3reflection
 of the regenerated
 3 LiNbO wave
 3 Li2Bmass
 and 4O7 Li2Bfeedback
 load 4O7 Li2isB4close
 O7 to
 ◦ (Figure of
 180Direction 2f), effectively0 reducing the in-band0ripple effect characterised by the sensor
 X-112 Y Z-X 128 Y-X Z-X Z-450X 6.70X-Z
 propagation
 frequency response.
 /%
 The electromechanical
 0.75 coupling2.0 2 determines the suitable material for the
 coefficient k5.5 0.9 1.1 1.4
 2
 SAW sensor. k represents the energy conversion degree of SAW piezoelectric material,
 which is related to SER [20]. The larger the k2 is, the stronger the SER is. Therefore, the
 minor k2 material is chosen to ensure the IDTs of the SAW sensor can perform well. The
 common materials of the piezoelectric substrate and their k2 values are listed in Table 1.

 /% 0.14 0.16 0.23 0.66 0.75 7.6
 Material LiNbO3 LiNbO3 LiNbO3 Li2B4O7 Li2B4O7 Li2B4O7
 Direction of
 X-1120Y Z-X 1280Y-X Z-X Z-450X 6.70X-Z
 propagation
Sensors 2023, 23, 464 /% 0.75 2.0 5.5 0.9 1.1 5 of 15
 1.4

 Figure 3. Change in BAW reflection excited by IDT by engraving bi−directional slots.

 (2) Choosing the ST-X Quartz as the piezoelectric substrate to decrease SER.

 Table 1. Piezoelectric substrate materials and their k2 .

 Material SiO2 SiO2 SiO2 LiTaO3 LiTaO3 LiTaO3
 Direction of
 ST-X 42.750 Y-X Y-X Y-Z X-1120 Y 420 Y-X
 propagation
 k2 /% 0.14 0.16 0.23 0.66 0.75 7.6
 Material LiNbO3 LiNbO3 LiNbO3 Li2 B4 O7 Li2 B4 O7 Li2 B4 O7
 Direction of
 X-1120 Y Z-X 1280 Y-X Z-X Z-450 X 6.70 X-Z
 propagation
 k2 /% 0.75 2.0 5.5 0.9 1.1 1.4

 (3) Engraving bi-directional slots on the back of the piezoelectric substrate to solve the
 interference of BAW in SAW devices, as shown in Figure 3.
 The engraved bi-directional slots on the back of the substrate can block the propa-
 gation path of BAW to a certain extent, reducing the influence of BAW propagation and
 suppressing the out-of-band suppression of the frequency response. In Figure 3, the way of
 1 is the electrode-A’s BAW, the way of 1’ is the reflection of DBAW before the slotting, and
 the way of 1’ (red dotted line) is the reflection of DBAW after the slotting. After slotting,
 the thickness of the piezoelectric substrate changes (from 0.5 mm to 0.45 mm, slot depth of
 0.05 mm), which leads to the most potent reflection of DBAW falls on the end of the central
 area output IDT, thus significantly weakening the influence of DBAW.
 The SAW design parameters are shown in Table 2 and fabricated on ST-X quartz
 substrates, as shown in Figure 4.

 Table 2. Design parameters of SAW delay line.

 Material ST-X Quartz
 Piezoelectric Substrate
 Size L = 30 mm, W = 6 mm, H = 0.5 mm
 Structure Delay line
 The centre frequency 60 MHz
 −3 dB bandwidth 1.38%
 IDT Wavelength λ = 52.633333 µm
 Aperture width 3588.733333 µm
 Number of input IDT 145
 Number of output IDT 49
 Distance between input and
 27.422 mm(521 λ)
 output IDT center
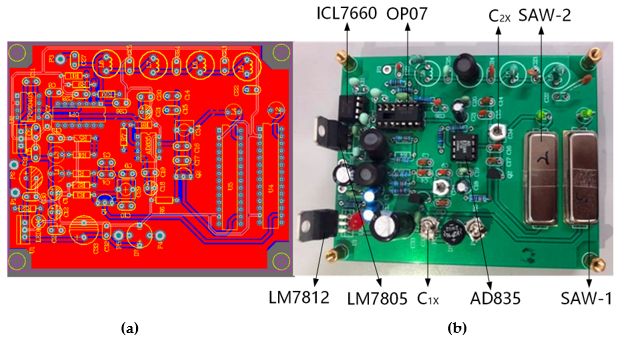
Wavelength λ = 52.633333 μm
 IDT Aperture width 3588.733333 μm
 Number of input IDT 145
 Number of output IDT 49
Sensors 2023, 23, 464 Distance between input and out- 6 of 15
 27.422 mm(521 λ)
 put IDT center

 Figure
 Figure 4. Surface
 4. Surface acoustic
 acoustic wave
 wave devices
 devices fabricated
 fabricated on on ST-X
 ST-X Quartz
 Quartz substrates.
 substrates. (a) (a) unbalanced-split
 unbalanced-split
 electrode (b) image of SAW devices.
 electrode (b) image of SAW devices.
 3.2. Dual Differential Channel Circuit
 3.2. Dual Differential Channel Circuit
 There are two kinds of structures of the surface acoustic wave oscillator constructed by
 There are two kinds of structures of the surface acoustic wave oscillator constructed
 transistor: Pierce type and Colpitts type low noise oscillation circuit [21]. The crystal and
 bythe
 transistor:
 inductorPierce
 of thetype and
 Pierce Colpittsare
 oscillator type low noise
 connected oscillation
 in series to formcircuit [21].
 a series The crystal
 resonant circuit,
 and the inductor of the Pierce oscillator are connected in series to
 which works on the series resonance [22]. The Colpitts oscillator is a parallel form a series resonant
 resonant
 circuit,
 circuitwhich
 withworks on the
 large total series resonance
 impedance [22]. The Colpitts
 and low-frequency oscillator
 stability is a parallel
 [23]. This paper usedreso-the
 nant circuit with large total impedance and low-frequency stability [23].
 surface acoustic wave device as the oscillator frequency output device, and the working This paper used
 thefrequency
 surface acoustic wave device as the oscillator frequency output device,
 is high. Therefore, choosing the Pierce oscillator can improve the frequency and the work-
 ingstability
 frequency is high.
 of the Therefore,
 surface acousticchoosing the Pierce oscillator can improve the frequency
 wave device.
 stabilityTheof the
 dualsurface acoustic
 differential wave
 surface device.wave oscillator system is shown in Figure 5. The
 acoustic
 The supply
 power dual differential
 voltage of surface acoustic
 the oscillating wave
 circuit is oscillator
 +12 V, andsystem is shown
 the positive in Figure
 and negative 5.
 power
 The power supply voltage of the oscillating circuit is +12 V, and the positive
 supply voltages of the mixing module AD835 are, respectively, ±5 V. +5 V is generated and negative
 power
 by +12 supply voltages
 V voltage of the
 through mixingFigure
 LM7805. module 5a AD835
 shows the are,PCB
 respectively,
 layout of the ±5 V. +5 Vofisthe
 circuit
 yarn tension sensor. The PCB size is 100 mm × 100 mm. In Figure 5b, C1X and C2X is
 the adjustable capacitor whose purpose is to determine the basic calibration value of the
 detection and the reference channels. AD835 is a mixer of ADI Semiconductor company.
 Its operating frequency is 250 MHz, which meets the frequency requirement of 60 MHz of
 SAW device design.
generated by +12 V voltage through LM7805. Figure 5a shows the PCB layout of the circuit
 of the yarn tension sensor. The PCB size is 100 mm × 100 mm. In Figure 5b, C1X and C2X is
 the adjustable capacitor whose purpose is to determine the basic calibration value of the
 detection and the reference channels. AD835 is a mixer of ADI Semiconductor company.
Sensors 2023, 23, 464
 Its operating frequency is 250 MHz, which meets the frequency requirement of 607 MHzof 15

 of SAW device design.

 Figure5.5.Diagram
 Figure Diagramofofthe
 thedual
 dualdifferential
 differentialsurface
 surfaceacoustic
 acousticwave
 waveoscillator
 oscillatorsystem.
 system.(a)
 (a)The
 Thedesign
 designof
 PCB. (b) The
 of PCB. Circuit
 (b) The board.
 Circuit board.

 4.4.Test
 Testand
 andApplication
 Applicationofofthe
 theDual
 DualDifferential
 DifferentialChannel
 Channelofofthe
 theSAWO
 SAWO
 4.1. Test of SAW Delay Line
 4.1. Test of SAW Delay Line
 Agilent E5061A ENA-L radio frequency network analyzer was used to test the acoustic
 Agilent E5061A ENA-L radio frequency network analyzer was used to test the acous-
 surface wave devices’ frequency response characteristics. The frequency response of a group
 tic surface wave devices’ frequency response characteristics. The frequency response of a
 of acoustic surface wave devices was measured, as shown in Figure 6. Figure 6a shows the
 Sensors 2023, 23, x FOR PEER REVIEW group of characteristics
 frequency acoustic surface
 of wave devices
 SAW-1, whosewas measured,
 centre as is
 frequency shown in Figure
 8 of 16
 59.836190 MHz.6.Figure
 Figure6b6a
 shows the frequency characteristics of SAW-1, whose centre frequency is 59.836190
 shows the frequency characteristics of SAW-2, whose centre frequency is 59.836494 MHz. MHz.
 Figure 6b shows the frequency characteristics of SAW-2, whose centre frequency is
 59.836494 MHz.

 (a)

 Figure 6. Cont.
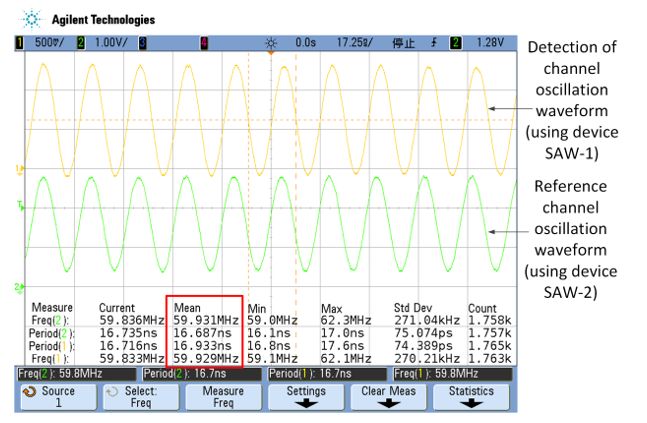
Sensors 2023, 23, 464 8 of 15

 (a)

Sensors 2023, 23, x FOR PEER REVIEW 9 of 16
 (b)
 Figure 6. Frequency characteristics of the acoustic surface wave devices. (a) SAW−1; (b) SAW−2.
 Figure 6. Frequency characteristics of the acoustic surface wave devices. (a) SAW−1; (b) SAW−2.
 4.2. Test and Analysis of Dual Differential Channel Circuit
 4.2. Test and Analysis of Dual Differential Channel Circuit
 4.2.1.
 4.2.1.The
 TheBasic
 BasicCalibration
 CalibrationValue
 Valueofofthe
 theDetection
 DetectionChannel
 Channeland andReference
 ReferenceChannel
 Channel
 KEYSIGHT
 KEYSIGHT 4000X high-performancehybrid
 4000X high-performance hybriddigital
 digital oscilloscope
 oscilloscope (4 channels
 (4 channels 200
 200 MHz)
 MHz)
 is usedis used
 to testto the
 testfrequency
 the frequency of SAW
 of SAW devices,
 devices, andand
 thethe oscillation
 oscillation waveform
 waveform is is shownin
 shown
 inFigure
 Figure 7. 7.
 InIn Figure
 Figure 7, the
 7, the yellow
 yellow curve
 curve is detection
 is the the detection channel’s
 channel’s waveform,
 waveform, and theandgreen
 the
 green curve is the reference channel’s waveform. Since the circuit parameters
 curve is the reference channel’s waveform. Since the circuit parameters of the two channels of the two
 channels are the
 are the same, thesame, the oscillation
 oscillation frequencyfrequency of both is
 of both channels channels
 59.8 MHz is 59.8
 (shownMHzin (shown in
 the red box
 the red box7).
 of Figure of Figure 7).

 Surfaceacoustic
 Figure7.7.Surface
 Figure acousticwave
 waveoscillator
 oscillatorwaveform
 waveformdiagram
 diagram(Test
 (Testby
 byKEYSIGHT
 KEYSIGHT4000X).
 4000X).

 When the environment temperature changes, the frequency of the output signal of
 surface SAWO2 is:

 f2 = f02 +ΔfT 2 (7

 where is the centre frequency of SAWO2; ∆ is the frequency variation of surface
Sensors 2023, 23, 464 9 of 15

 When the environment temperature changes, the frequency of the output signal of
 surface SAWO2 is:
 f 2 = f 02 + ∆ f T2 (7)
 where f 02 is the centre frequency of SAWO2; ∆ f T2 is the frequency variation of surface
 SAWO2 caused by temperature change.
 At the same time, the frequency of the output signal of SAWO1 is:

 f 1 = f 01 + ∆ f T1 + ∆ f F (8)

 where f 01 is the centre frequency of SAWO1; ∆ f T1 is the frequency variation of SAWO1
 caused by temperature change. ∆ f F is the centre frequency change in SAWO1 when yarn
 tension F 6= 0.
 The output frequency of the low-pass filter is:

Sensors 2023, 23, x FOR PEER REVIEW ∆ f LPF = f 1 − f 2 10 of(9)
 16

 By substituting Equations (7) and (8) into Equation (9), one obtains:

 where is a constant, ==( f 01 +−∆ f T1, +
 ∆ f LPF and∆ f F∆
 ) − (isf 02the ∆ f T2 )
 +frequency difference between
 the two oscillators caused by f 01 − f 02 ) + (∆ f T1 − ∆ f T2 ) + ∆ f F
 = (temperature. (10)
 To determine in Equation (10),00the basic
 = f + ∆ f + ∆ f
 T calibration
 F values of the detection chan-
 nel and the reference channel should be tested. The determination method is given below.
 f 00 isthe
 whereAdjust a constant, Cx=(inf 01Figure
 capacitorf 00 andto∆offset
 − f 02 ,5b) f T is the
 the frequency
 oscillation difference
 frequency between the
 of the detec-
 two oscillators caused by temperature.
 tion channel and the reference channel. This offset is a fixed value and does not change
 withTo determine f 00conditions.
 environmental in EquationIn(10),thisthe basic calibration
 experiment, this offsetvalues
 value of is
 the detection
 defined channel
 as the basic
 and the reference channel should be tested. The determination method
 calibration value of the frequency difference output, which is the difference between is given below.
 Adjust thefrequencies
 the oscillation capacitor Cxof(inthe
 Figure 5b)curve
 yellow to offset
 and the
 theoscillation
 green curve frequency of the
 in Figure detection
 8 (shown in
 channel and the reference channel. This offset is a fixed value and does not change with
 the red box).
 environmental conditions. In this experiment, this offset value is defined as the basic
 When the yarn tension F is loaded into the detection channel, the difference fre-
 calibration value η of the frequency difference output, which is the difference between the
 quency output of the yarn tension sensor circuit is subtracted from the basic calibration
 oscillation frequencies of the yellow curve and the green curve in Figure 8 (shown in the
 value η. That is, the frequency difference component ∆ is obtained.
 red box).

 Figure 8. Test waveform diagram of the surface acoustic wave oscillator after adjusting the capaci-
 Figure 8. Test waveform diagram of the surface acoustic wave oscillator after adjusting the capacitor
 tor
 Cx.Cx.

 4.2.2. Output Signal of Low Pass Filter
 The mixing waveform is measured after the mixer AD835, as shown in Figure 9. Due
 to the complex harmonic components, disorderly waveforms, and broad-spectrum range
 in the waveform shown in Figure 9, differential frequency components with lower fre-
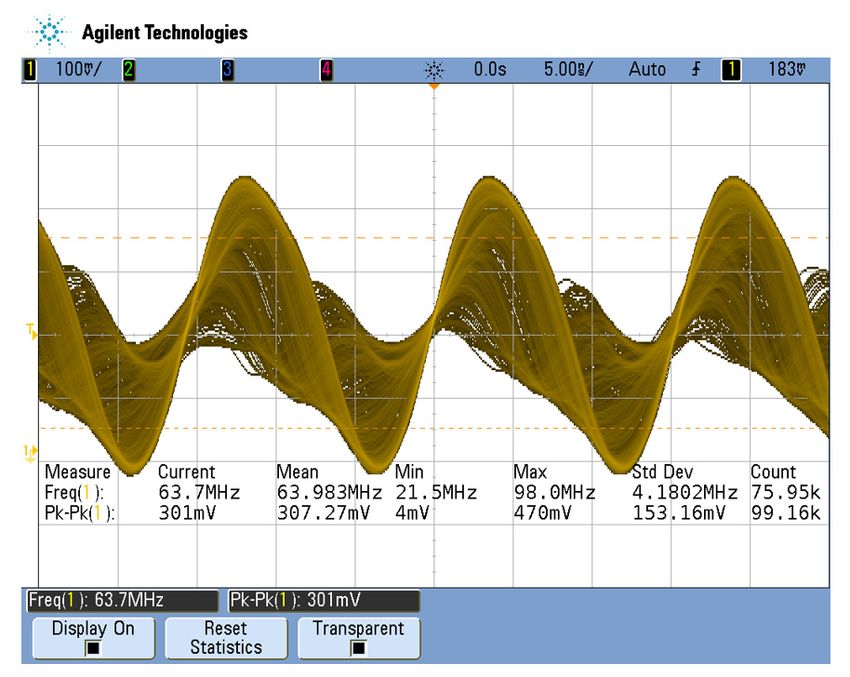
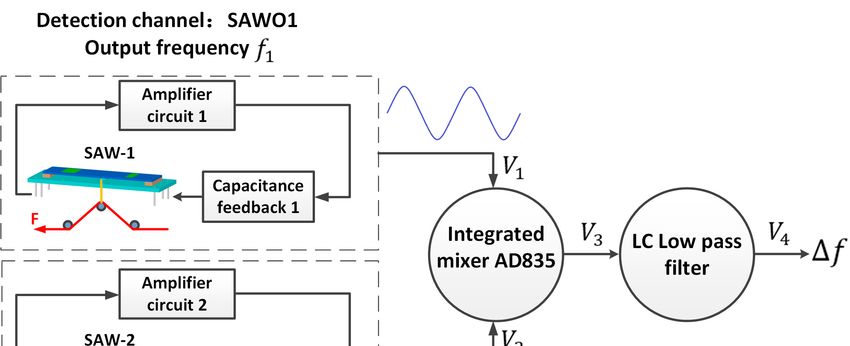
Sensors 2023, 23, 464 10 of 15

 When the yarn tension F is loaded into the detection channel, the difference frequency
 output of the yarn tension sensor circuit is subtracted from the basic calibration value η.
 That is, the frequency difference component ∆ f LPF is obtained.

 4.2.2. Output Signal of Low Pass Filter
 Sensors 2023, 23, x FOR PEER REVIEW 11 of 16
 The mixing waveform is measured after the mixer AD835, as shown in Figure 9. Due
 to the complex harmonic components, disorderly waveforms, and broad-spectrum range in
 the waveform
 function showncircuit
 of the difference in Figure 9, differential
 is realized, and the yarnfrequency components
 tension sensor can eliminatewith
 the lower frequencies
 need toofbe
 influence extracted. interference.
 environmental

 Sensors 2023, 23, x FOR PEER REVIEW 11 of 16

 function of the difference circuit is realized, and the yarn tension sensor can eliminate the
 influence of environmental interference.

 Figure
 Figure9. Test waveform
 9. Test diagramdiagram
 waveform of the output signal
 of the of AD835
 output mixer.
 signal of AD835 mixer.

 Figure 10 shows the output waveform after the second-order low-pass filter is passed.
 The difference frequency signal is a sine wave signal, and the oscillation frequency is
 610 kHz (as shown in the red box in Figure 10), which is the difference frequency value of
 the two waveforms in Figure 8 (as shown in the red box). Therefore, the basic calibration
 value of the measured detection channel and reference channel η = 610 kHz. That is,
 f 00 = 610 kHz, and Equation (10) can be changed to:

 ∆ f LPF
 Figure 9. Test waveform diagram of the output signal=of610k
 AD835+ ∆ fT
 mixer. + ∆ fF (11)

 Figure 10. Test waveform diagram of differential frequency signal of low-pass filter.

 4.3. Test and Analysis of Dual Differential Channel Circuit Stability
 The stability of the oscillating circuit is an essential factor in determining the perfor-
 mance of a surface acoustic wave sensor. The frequency stability of SAWO refers to the
 random frequency variation value within a specific sampling time, which can be divided
 into long-term, medium-term, and short-term frequency stability. There are two ways to
 express short-term frequency stability: one is the time domain representation, which is

 Figure
 Figure 10.10.
 TestTest
 waveform diagram
 waveform of differential
 diagram frequency signal
 of differential of low-pass
 frequency filter.of
 signal low-pass filter.
 4.3. Test and Analysis of Dual Differential Channel Circuit Stability
 The stability of the oscillating circuit is an essential factor in determining the perfor-
 mance of a surface acoustic wave sensor. The frequency stability of SAWO refers to the
 random frequency variation value within a specific sampling time, which can be divided
 into long-term, medium-term, and short-term frequency stability. There are two ways to
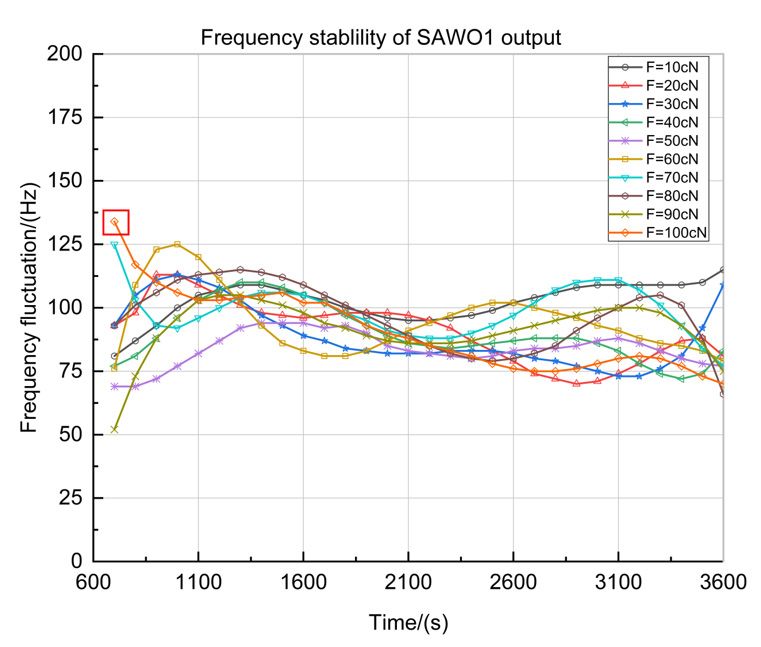
Sensors 2023, 23, 464 11 of 15 In summary, after the complex harmonic signal output by the mixer passes through the low-pass filter, the high-frequency harmonic in the signal is significantly attenuated, and only a single component of the difference frequency signal is left. Thus, the detection function of the difference circuit is realized, and the yarn tension sensor can eliminate the influence of environmental interference. 4.3. Test and Analysis of Dual Differential Channel Circuit Stability The stability of the oscillating circuit is an essential factor in determining the perfor- mance of a surface acoustic wave sensor. The frequency stability of SAWO refers to the random frequency variation value within a specific sampling time, which can be divided into long-term, medium-term, and short-term frequency stability. There are two ways to express short-term frequency stability: one is the time domain representation, which is generally expressed by Allen variance; the other is frequency domain representation, which can be represented by phase noise. The Allen variance is commonly used to describe short-term frequency stability, which is defined as: v u 1 N u 2N k∑ σ(τ ) = t ( f k +1 − f k )2 (12) =1 where τ is the sampling interval, f k is the frequency point, and N is the total of samples. In the experiment, the interval sampling is k times, and short-term frequency stability can be defined as: 1 N 2 2 ∑ ( f k +1 − f k ) δ(t) 1 k =1 K= = (13) fM fM 2N where f M is the average frequency. Equation (13) K is used to estimate the short-term frequency stability of the oscillating circuit. 4.3.1. Frequency Stability of SAWO1 Output Signal with Loaded Tension The output of SAWO1 with different tension from 0 to 100 cN is tested at intervals of 10 cN. A continuous test was carried out for one hour, and the frequency fluctuation was Sensors 2023, 23, x FOR PEER REVIEW 13 of 16 recorded between 600 s and 3600 s. As shown in Figure 11, ten groups of data ranging from 10 cN to 100 cN are obtained from 600 s to 3600 s. Figure Figure 11.11. Frequency Frequency stability stability curve of curve of SAWO1 SAWO1 loaded loaded with tension with (the tension red box (the red is the maximum box is the maximum data for all the tests). data for all the tests). Table 3. Frequency fluctuations test data of SAWO1 from 600 s to 3600 s when F = 100 cN (the group where the greatest fluctuation occurred, and the red color is the maximum data for this group of tests). Time(s) 600 700 800 900 1000 1100 1200 1300 1400 1500 1600 ∆ (Hz) 0 134 117 110 106 103 103 104 105 106 102 Time(s) 1700 1800 1900 2000 2100 2200 2300 2400 2500 2600 2700
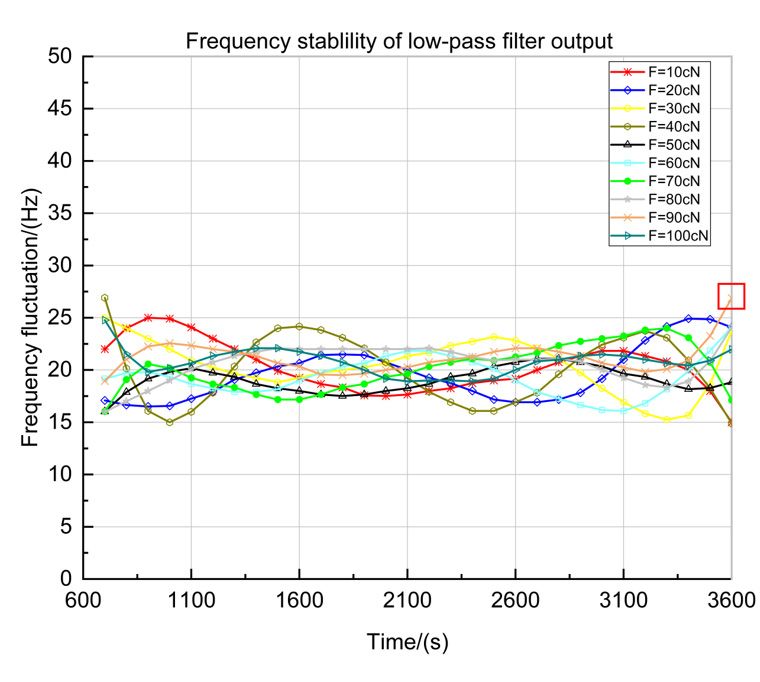
Sensors 2023, 23, 464 12 of 15 In Figure 11, the X-axis is the measuring period from 600 s to 3600 s, frequency sampling is conducted every 100 s, and the Y-axis is the value of the frequency fluctuation near the center frequency. According to the test data in Figure 11 and the centre frequency of SAW-1 ( f S1− M = 59.836190 MHz in Figure 6a), the short-term frequency stability can be obtained as: 1 N 2 2 1 ∑ ( f k +1 − f k ) k =1 KS1 = = 1.0163 × 10−6 = 1.0163ppm (14) f S1− M 2N Table 3 shows the data with the largest frequency fluctuation among the ten data groups, measured when F = 100 cN tension. According to the test data in Table 3, the max frequency jump of the detection circuit can be stable at 134 Hz (time at 700 s) from 600 s to 3600 s (Figure 11 in red box), so the max frequency jump is steady at: ∆ f δmax 134Hz/h KS1−max = = = 2.2395 × 10−6 = 2.2395ppm (15) f S1− M 59.83619MHz Table 3. Frequency fluctuations test data of SAWO1 from 600 s to 3600 s when F = 100 cN (the group where the greatest fluctuation occurred, and the red color is the maximum data for this group of tests). Time(s) 600 700 800 900 1000 1100 1200 1300 1400 1500 1600 ∆ f δ (Hz) 0 134 117 110 106 103 103 104 105 106 102 Time(s) 1700 1800 1900 2000 2100 2200 2300 2400 2500 2600 2700 ∆ f δ (Hz) 102 98 93 90 88 85 83 81 78 76 75 Time(s) 2800 2900 3000 3100 3200 3300 3400 3500 3600 ∆ f δ (Hz) 75 76 78 80 81 80 77 73 70 4.3.2. Frequency Stability of Low Pass Filter Output Signal with Loaded Tension The output of low pass filter with different tension from 0 to 100 cN also is tested at intervals of 10 cN. A continuous test was carried out for one hour, and the frequency Sensors 2023, 23, x FOR PEER REVIEW 14 of 16 fluctuation was recorded between 600 s and 3600 s. As shown in Figure 12, ten groups of data ranging from 10 cN to 100 cN are obtained from 600 s to 3600 s. Figure 12. Frequency stability curve of low-pass filter output loaded with tension (the red box is the Figure 12. Frequency stability curve of low-pass filter output loaded with tension (the red box is maximum the maximum data forallall data for thethe tests). tests). Table 4 shows the data with the largest frequency fluctuation among the ten data groups, measured when = 90 tension. According to the test data in Table 4, the max frequency jump of the detection circuit can be stable at 27 Hz (time at 3600 s) from 600 s to 3600 s (Figure 12 in red box), so the max frequency jump is steady at:
Sensors 2023, 23, 464 13 of 15 In Figure 12, the X-axis is the measuring period from 600 s to 3600 s, frequency sampling is conducted every 100 s, and the Y-axis is the value of the frequency fluctuation near the center frequency. According to the test data in Figure 12 and the centre frequency of SAW-2 ( f S2− M = 59.836494 MHz in Figure 6b), the short-term frequency stability can be obtained as: 1 N −1 2 2 ∑ ( f k +1 − f k ) 1 k =1 KS2 = = 1.7726 × 10−7 = 0.17726ppm (16) f S2− M 2N Table 4 shows the data with the largest frequency fluctuation among the ten data groups, measured when F = 90 cN tension. According to the test data in Table 4, the max frequency jump of the detection circuit can be stable at 27 Hz (time at 3600 s) from 600 s to 3600 s (Figure 12 in red box), so the max frequency jump is steady at: ∆ f δmax 27Hz/h KS2−max = = = 4.5123 × 10−7 = 0.45123ppm (17) f S2− M 59.836494MHz Table 4. Frequency fluctuations test data of low-pass filter output from 600 s to 3600 s when F = 90 cN (the group where the greatest fluctuation occurred, and the red color is the maximum data for this group of tests). Time(s) 600 700 800 900 1000 1100 1200 1300 1400 1500 1600 ∆ f δ (Hz) 0 19 21 22 23 22 22 22 21 21 20 Time(s) 1700 1800 1900 2000 2100 2200 2300 2400 2500 2600 2700 ∆ f δ (Hz) 20 19 20 20 20 21 21 21 22 22 22 Time(s) 2800 2900 3000 3100 3200 3300 3400 3500 3600 ∆ f δ (Hz) 22 21 21 20 20 20 21 23 27 5. Conclusions This paper presents a design for the dual differential channel SAWO to enhance the SAW yarn tension sensor’s frequency stability. The method of surface acoustic wave devices is optimized from three aspects. First, this involves designing the unbalanced-split electrode to reduce the electrode reflection and side lobe of the oscillator. Second, this involves choosing the ST-X Quartz as the piezoelectric substrate to reduce the SER. Third, this involves engraving the back grooving of the piezoelectric substrate to reduce the interference BAW. The dual differential channel circuits are designed and manufactured by using an AD835 mixer. The output of SAWO1 and low pass filter with different tension from 0 to 100 cN are tested at intervals of 10 cN. A continuous test was carried out for one hour, and the frequency fluctuation was recorded between 600 s and 3600 s. The conclusions were shown as follows: (1) The dual differential channel SAWO can enhance the frequency stability of the SAW yarn tension sensor. (2) Using the dual differential channel SAWO can reduce the short-term frequency stabil- ity from 1.0163 ppm to 0.17726 ppm. (3) The frequency accuracy of the tension sensor is improved from 134 Hz to 27 Hz. (4) The max frequency jump steady is reduced from 2.2395 ppm to 0.45123 ppm. Author Contributions: Data curation, W.L.; Funding acquisition, B.W.; Methodology, Y.F.; Project administration, Y.F. and B.W.; Writing—original draft, Y.F. All authors have read and agreed to the published version of the manuscript.
Sensors 2023, 23, 464 14 of 15

 Funding: This research was funded in part by the Natural Science Foundation of Zhejiang Province
 under Grant LQ23F010005, by the Scientific Research Foundation of Zhejiang Education Department
 under Grant Y202250022, and by the Research Foundation of Hangzhou Normal University under
 Grant 4115C50220204101.
 Institutional Review Board Statement: Not applicable.
 Informed Consent Statement: Not applicable.
 Data Availability Statement: Not applicable.
 Conflicts of Interest: The authors declare no conflict to interest.

References
1. Wang, J.L.; Lu, C.H.; Zhang, K. Textile-Based Strain Sensor for Human Motion Detection. Energy Environ. Mater. 2020, 3, 80–100.
 [CrossRef]
2. Guzman-Sepulveda, J.R.; May-Arrioja, D.A.; Fuentes-Fuentes, M.A.; Cuando-Espitia, N.; Torres-Cisneros, M.; Gonzalez-Gutierrez,
 K.; LiKamWa, P. All-fiber measurement of surface tension using a two-hole fiber. Sensors 2020, 20, 4219. [CrossRef] [PubMed]
3. Kim, S.J.; Kim, H.A. Effect of fabric structural parameters and weaving conditions to warp tension of aramid fabrics for protective
 garments. Text. Res. J. 2018, 88, 987–1001. [CrossRef]
4. Zhang, J.G.; Wu, X.G.; Zhu, L.; Chao, Y.; Zhang, J.B. Embedded yarn tension control system based on the design of the sensor. In
 Proceedings of the Measuring Technology and Mechatronics Automation, International Conference on IEEE, Zhangjiajie, China,
 18 August 2009; pp. 93–97.
5. Karnoub, A.; Kadi, N.; Azari, Z. Using the expert system to analyze loom performance. J. Text. Inst. 2016, 108, 203–215. [CrossRef]
6. De Marcellis, A.; Ferri, G.; Palange, E. A Novel Analog Autocalibrating Phase-Voltage Converter for Signal Phase-Shifting
 Detection. IEEE Sens. J. 2011, 11, 259–266. [CrossRef]
7. Agarwal, A.; Psomas, C.; Krikidis, I. Communication Systems with Amplitude Detection: An Asymptotic Approach. IEEE Internet
 Things J. 2022, 9, 18319–18322. [CrossRef]
8. Cecati, F.; Zhu, R.W.; Pugliese, S.; Liserre, M.; Wang, X.F. State Feedback Reshaping Control of Voltage Source Converter. IEEE
 Trans. Power Electron. 2022, 37, 14280–14292. [CrossRef]
9. Lei, X.; Zhang, J.N.; Deng, J.; Yin, P.; Shu, Z.; Tang, F. An Automatic Clock-Induced-Spurs Detector Based on Energy Detection for
 Direct Digital Frequency Synthesizer. Sensors 2022, 22, 3396. [CrossRef]
10. Engelmann, U.M.; Pourshahidi, A.M.; Shalaby, A.; Krause, H.J. Probing particle size dependency of frequency mixing magnetic
 detection with dynamic relaxation simulation. J. Magn. Magn. Mater. 2022, 563, 169965. [CrossRef]
11. Takamitsu, I.; Shingo, A.; Tatsuhiro, O.; Nobuo, T.; Kazushi, Y. Dynamic calibration method for trace moisture analyzer based on
 quick response of ball surface acoustic wave sensor. Meas. Sci. Technol. 2020, 31, 94003.
12. Stoney, R.; Geraghty, D.; O’Donnell, G.E. Characterization of differentially measured strain using passive wireless surface acoustic
 wave (SAW) strain sensors. IEEE Sens. J. 2013, 14, 722–728. [CrossRef]
13. Quintero, S.; Figueiredo, S.; Takahashi, V.; Llerena, R.A.W.; Braga, A.M.B. Passive downhole pressure sensor based on surface
 acoustic wave technology. Sensors 2017, 17, 1635. [CrossRef] [PubMed]
14. Lu, W.K.; Feng, Y.; Zhu, C.C.; Zheng, J.L. Temperature compensation of the SAW yarn tension sensor. Ultrasonics 2017, 76, 87–91.
 [CrossRef] [PubMed]
15. Wen, C.B.; Zhu, C.C. A novel architecture of implementing wavelet transform and reconstruction processor with SAW device
 based on MSC. Sens. Actuators A 2006, 126, 148–153. [CrossRef]
16. Lei, B.B.; Lu, W.K.; Zhu, C.C.; Liu, Q.H. Optimization of sensitivity induced by substrate strain rate for surface acoustic wave
 yarn tension sensor. IEEE Sens. J. 2015, 15, 4769–4776. [CrossRef]
17. Feng, Y.; Lu, Z.X.; Lu, W.K.; Zhu, C.C.; Liu, Q.H.; Zhang, H.X. Study of the Doubly-clamped Beam Yarn Tension Sensor Based on
 the Surface Acoustic Wave. IEEE Trans. Ind. Electron. 2019, 66, 3256–3264. [CrossRef]
18. Zhao, M.; Zhang, H.; Zhang, R.Y.; Yao, M.; Ma, M.Y. Design of surface acoustic wave parafoil riser tension sensor. IEEE Sens. J.
 2017, 17, 3022–3029. [CrossRef]
19. Darinskii, A.N.; Weihnacht, M.; Schmidt, H. Surface acoustic wave scattering from steps, grooves, and strips on piezoelectric
 substrates. IEEE Trans. Ultrason. Ferroelectr. Freq. Control. 2010, 57, 2042–2050. [CrossRef]
20. Lu, W.K.; Zhu, C.C. Solving three key problems of wavelet transform processor using surface acoustic wavedevices. IEEE Trans.
 Ind. Electron. 2010, 57, 3801–3806. [CrossRef]
21. Reindl, L.; Scholl, G.; Ostertag, T.; Scherr, H.; Wolff, U.; Schmidt, F. Theory and application of passive saw radio transponders as
 sensors. IEEE Trans. Ultrason. Ferroelectr. Freq. Control 1998, 45, 1281–1292. [CrossRef]
Sensors 2023, 23, 464 15 of 15

22. Ballato, A. MEMS Fluid Viscosity Sensor. IEEE Trans. Ultrason. Ferroelectr. Freq. Control 2010, 57, 669–676. [CrossRef]
23. Gerber, E.A.; Ballato, A. Precision Frequency Control, Vol. 2: Oscillators and Standards; Academic Press: London, UK, 1985.

Disclaimer/Publisher’s Note: The statements, opinions and data contained in all publications are solely those of the individual
author(s) and contributor(s) and not of MDPI and/or the editor(s). MDPI and/or the editor(s) disclaim responsibility for any injury to
people or property resulting from any ideas, methods, instructions or products referred to in the content.
You can also read