Observational Evidence of Distinguishable Weather Patterns for Three Types of Sudden Stratospheric Warming During Northern Winter
←
→
Page content transcription
If your browser does not render page correctly, please read the page content below
ORIGINAL RESEARCH
                                                                                                                                           published: 23 February 2021
                                                                                                                                        doi: 10.3389/feart.2021.625868

                                            Observational Evidence of
                                            Distinguishable Weather Patterns for
                                            Three Types of Sudden Stratospheric
                                            Warming During Northern Winter
                                            Hyesun Choi 1, Joo-Hong Kim 1, Baek-Min Kim 2* and Seong-Joong Kim 1*
                                            1
                                              Division of Atmospheric Sciences, Korea Polar Research Institute, Incheon, Republic of Korea, 2Department of Environmental
                                            Atmospheric Sciences, Pukyong National University, Pusan, Republic of Korea

                                            Sudden stratospheric warming (SSW) events often lead to a cold surface air temperature
                                            anomaly over the extratropical regions. In this study, we propose, through observational
                                            evidence, that the types of SSW determine the severity of the cold anomaly. Based on the
                                            three-type classification of SSW, it is found that the surface air temperature drops notably
                                            over central to eastern North America following an SSW-type transition, especially from
                                            displacement to split. Note, however, that the differences in mean surface air temperature
                                            anomalies between SSW types are not statistically significant, even though after SSW-type
                                            transition from displacement to split, surface air temperature anomalies are colder than the
                          Edited by:
                     Chaim Garfinkel,        other two types. The development of an anomalous tropospheric ridge in the North Pacific
Hebrew University of Jerusalem, Israel      Arctic sector, associated with the difference in the vertical and zonal propagation of
                      Reviewed by:          planetary waves, characterizes the post-warming period of the displacement–split type.
                           Ian White,
Hebrew University of Jerusalem, Israel
                                            After the occurrence of the displacement–split type transition of SSW events, upward
                         Daoyi Gong,        propagation of planetary waves of zonal wavenumber 1 is suppressed, whereas planetary
    Beijing Normal University, China        waves of zonal wavenumber 2 increase in the troposphere. Accompanying the ridge in the
                 *Correspondence:           North Pacific, a trough developed downstream over North America that carries cold polar
                       Baek-Min Kim
                 baekmin@pknu.ac.kr         air therein. The results in this study are relevant for the subseasonal time scale, within
                   Seong-Joong Kim          20 days after an SSW occurrence.
                seongjkim@kopri.re.kr
                                            Keywords: sudden stratospheric warming, type-transition, North America, surface temperature, cold polar air
                    Specialty section:
         This article was submitted to
                Atmospheric Science,        INTRODUCTION
               a section of the journal
            Frontiers in Earth Science      There is increasing evidence that weak polar vortex states can account for cold winters over
      Received: 04 November 2020            midlatitudes (Cellitti et al., 2006; Kolstad et al., 2010; Park et al., 2011; Kim et al., 2014; Kidston et al.,
        Accepted: 19 January 2021           2015; Kretschmer et al., 2018a, Kretschmer et al., 2018b). However, not all polar vortex weakening
       Published: 23 February 2021
                                            events exhibit cold weather, and not all of them are accompanied by the same surface response
                              Citation:     (Nakagawa and Yamazaki, 2006; Mitchell et al., 2013; Lehtonen and Karpechko, 2016; Rao et al.,
Choi H, Kim J-H, Kim B-M and Kim S-J        2020).
     (2021) Observational Evidence of
                                               Extremely weak vortex states are often associated with Sudden stratospheric warmings (SSWs)
 Distinguishable Weather Patterns for
Three Types of Sudden Stratospheric
                                            characterized by rapid warmings in the polar stratosphere and a reversal of circumpolar westerlies.
    Warming During Northern Winter.         Using an objective algorithm based on the stratospheric polar vortex structure, Charlton and Polvani
           Front. Earth Sci. 9:625868.      (2007) classified SSW events into two types: vortex displacement events and vortex splitting events.
      doi: 10.3389/feart.2021.625868        Whereas Charlton and Polvani (2007) concluded that the hemispheric influence of SSW on the

Frontiers in Earth Science | www.frontiersin.org                                   1                                         February 2021 | Volume 9 | Article 625868
Choi et al.                                                                                                    Different SSW Impacts on Surface

tropospheric state was not affected by the event type, Mitchell         naming system. Choi et al. (2019) found that the three SSW
et al. (2013) identified different surface responses over North          types display different characteristics in upward-propagating
America and Eurasia between displacement and split events.              wave activity and a tropospheric height field during the pre-
They argued that the surface impact of split events was                 warming period. They showed that the results based on the
stronger than that of displacement events. Lehtonen and                 traditional two-type classification (Charlton and Polvani, 2007)
Karpechko (2016) also analyzed surface weather patterns                 could weaken the distinct features between DS and SS types, and
related to major SSW events and classified them into                     suggested that DS-type SSW events should be objectively defined
displacement and split events based on reanalysis data and              to improve the understanding of SSW-related phenomena. In
models. Through observational analysis, they showed that cold           their extended study, differences in tropospheric precursor
anomalies in northern Eurasia appeared before, rather than after,       patterns over the North Atlantic between DD- and DS-type
the SSW events, particularly for displacement events, even though       SSW were identified (Choi et al., 2020).
the models failed to reproduce the cooling process. However,               Following the studies conducted by Choi et al. (2019); Choi
Maycock and Hitchcock (2015) and White et al. (2019) showed             et al. (2020), we investigate the surface responses over
that the relative impact of the conventional two types could be         midlatitudes based on the three-type classification of SSW
subject to sampling issues due to the small number of SSW events.       (Choi et al., 2019). The current study will provide
   SSW type can be classified based on the tropospheric response,        observational evidence on how the regional wintertime climate
wave mechanism, and SSW strength. Nakagawa and Yamazaki                 varies depending on the SSW type. In addition, because the
(2006) showed that downward propagating events tended to be             dependence of the cold events in midlatitudes on the type of
accompanied by an enhanced upward flux of the wavenumber 2               SSW can help in the prediction of the tropospheric weather
during the prewarming period. Kodera et al. (2016) classified            (Kodera et al., 2008; Mitchell et al., 2013; Matthias and
SSW events into absorbing and reflecting types based on the              Kretschmer, 2020), information on SSW events based on the
propagation property of planetary waves and revealed the                different types of SSW can be useful for predicting the occurrence
different influences of SSW on the troposphere. Matthias and             of cold weather in midlatitudes, especially North America, on the
Kretschmer (2020) argued that cold spells over Europe and North         subseasonal time scale. The data and methods adopted in the
America are related to different wave mechanisms, based on the          current study are described in Data and Methods section and
analysis of two SSW events. Hitchcock et al. (2013), Maycock and        the results are described in Results section. The summary is
Hitchcock (2015), and Karpechko et al. (2017) showed that               presented in Summary section.
lower-stratospheric anomaly during postwarming periods is
crucial for assessing the surface impact by SSW. Rao et al.
(2020) predicted the downward propagation and surface                   DATA AND METHODS
impact of two different types of SSW events in subseasonal to
seasonal models and also revealed that the strength of the SSW is       We use the reanalysis dataset from the National Centers for
more critical than the vortex morphology and dominant                   Environmental Prediction–National Center for Atmospheric
wavenumber in determining the magnitude of its downward                 Research (NCEP–NCAR) developed over January 1, 1957 to
impact.                                                                 December 31, 2014 (Kalnay et al., 1996). This dataset has a
   The difference in findings and discrepancies among the                horizontal resolution of 2.5o latitude × 2.5o longitude at 17
researchers renders it challenging to summarize the                     pressure levels from 1,000 to 10 hPa. The daily climatological
relationship between the SSW events and surface weather.                values of each atmospheric variable are calculated based on the
Therefore, further research is required to understand the               period 1981–2010, and are smoothed by a 31-day running mean.
different results obtained using the other analysis methods and         Anomaly fields are defined by deviations from these
different target periods and generalize the relationship between        climatological means. In this study, we determine statistical
weak vortex states and tropospheric cold events.                        significance from a zero at the 90% confidence level based on
   Choi et al. (2019) identified two distinct groups in                  Student’s two-sided t-test.
conventional split-type SSW events using reanalysis data and               Major SSW events are detected by wind reversal at 10 hPa and
objectively classified the conventional split type into                  60°N. The first day of wind reversal is defined as the central day
displacement–split (DS) and split–split (SS) types. Based on            (Day 0). Major SSW events and their types for the period
the temporal evolution of the stratospheric polar vortex                1957–2014 are chosen, according to Table 1 in Choi et al.
structure, the DS type in the conventional split type is                (2019). During the analysis period, the numbers of DD-, DS-,
characterized by the type of transition from the displacement           and SS-type events occurred 20, 10, and 7 times, respectively.
type before the SSW to the split type after the SSW, and the            These events are used for composite analysis.
remaining events are classified as the SS type, in which two
vortexes are generally maintained both before and after the SSW.
Therefore, the DS and SS types can be considered as transient and       RESULTS
stationary split types, respectively. The conventional
displacement type, characterized by a single displaced polar            Figure 1 presents the composite mean of 1,000 hPa temperature
vortex both before and after SSW, is classified as a                     anomalies (shading) and 300 hPa geopotential height (GPH)
displacement–displacement (DD) type by applying the same                anomalies (contours) before (days -20 to -5) and after (days 5

Frontiers in Earth Science | www.frontiersin.org                    2                                  February 2021 | Volume 9 | Article 625868
Choi et al.                                                                                                                          Different SSW Impacts on Surface

  FIGURE 1 | Temperature anomaly at 1,000 hPa (shading) and geopotential height (GPH) anomaly at 300 hPa (contours) for zonal wave components from 1 to 5.
  The results are shown for (A,D,G) Displacement–displacement (DD); (B,E,H) Displacement–split (DS); and (C,F,I) Split–split (SS) sudden stratospheric warming (SSW)
  events, averaged (Top) from days -20 to -5, (middle) from days 5 to 20, and (bottom) from days 20 to 35. Contour interval is 25 m. Sold and dashed contours denote
  positive and negative values, respectively. Pink dots and bold contours indicate significant regions at 90% confidence level in temperature anomaly and GPH
  anomaly, respectively.

to 20 and days 20 to 35) the central day according to SSW types.                       here, is favorable for wave-2 development and one of the
Before SSW, in DD (Figure 1A) and DS (Figure 1B) types,                                characteristic features of SS type (Choi et al., 2019). The cold
positive GPH anomaly over the North Atlantic and negative GPH                          anomaly and overlying trough are shown in North America.
anomaly over the North Pacific are prominent, although the                                 Numerous studies have shown that ridge in the Pacific and the
location of the trough centers near the North Pacific differs. The                      downstream trough over North America provide favorable
Atlantic ridge and Pacific trough correlate with vortex weakening                       conditions for the northerly flow between these two centers
by constructive interference with climatological wave-1 height                         that results in low surface temperature over North America,
field (Garfinkel et al., 2010). For both types, cold anomaly over                        and have suggested the causes inducing this overlying
Eurasia and warm anomaly over North America are identified.                             circulation pattern, as a tropical influence or Arctic warming
According to Kolstad et al. (2010), a precursor signal of warming                      (Carrera et al., 2004; Hartmann, 2015; Kug et al., 2015; Sung et al.,
aloft in the form of wave-1 GPH anomaly is associated with long-                       2016, 2019). Carrera et al. (2004) examined the composite
lived and robust cold anomalies over Asia and Europe. While the                        structure and temporal evolution of Alaskan blocking events,
DS type shows atmospheric circulation patterns similar to the DD                       which is a persistent atmospheric anticyclonic ridge over the
type before the central day, in SS type (Figure 1C), a positive                        northeast Pacific. They showed that the mature block was
GPH anomaly is identified over the northeast North Pacific. The                          associated with pronounced troughing downstream over North
ridge over the northeast North Pacific, although not significant                         America, using reanalysis data. The anomalous cyclonic flow in

Frontiers in Earth Science | www.frontiersin.org                                   3                                         February 2021 | Volume 9 | Article 625868
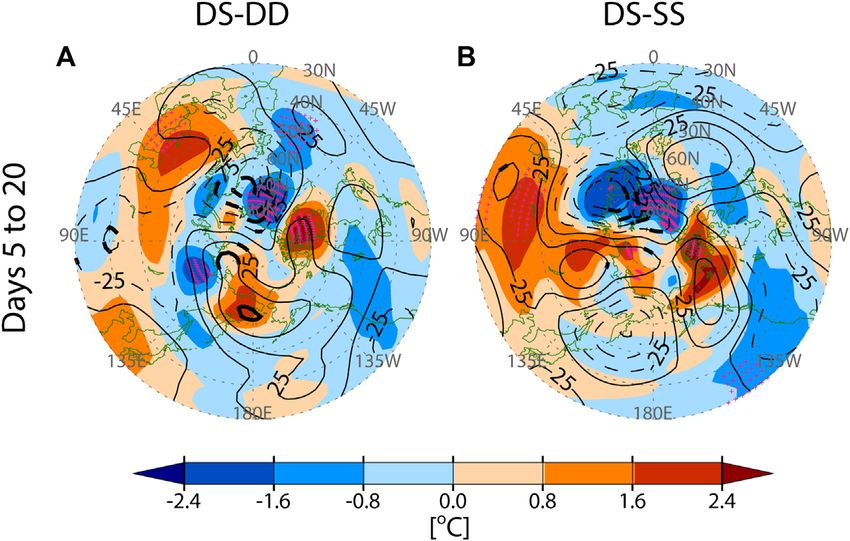
Choi et al.                                                                                                                     Different SSW Impacts on Surface

  FIGURE 2 | Differences in temperature anomaly at 1,000 hPa and geopotential height (GPH) anomaly at 300 hPa averaged from days 5 to 20 (A) between DS and
  DD types, and (B) between DS and SS types. Pink dots and bold contours indicate significant regions at 90% confidence level in temperature difference and GPH
  difference, respectively.

the downstream regions can be explained by Rossby wave                             to the sign of the Atlantic response by synoptic storm propagation
propagation from the upstream North Pacific ridge anomaly.                          from the East Pacific toward the Atlantic. Figures 1G–I show the
Although blocking is not analyzed in this study, North Pacific                      possibility that, during the second postwarming period, North
high anomaly can be related to more frequent North Pacific                          Atlantic responses are different depending on SSW types.
blocking events (Renwick and Wallace, 1996).                                           Figure 1 shows temporally and geographically distinct cold
   During the first postwarming period (days 5 to 20), the cold                     anomalies and pressure anomalies through the life cycle of SSW
anomaly over Eurasia diminishes in magnitude for both DD and                       events according to SSW types and provides the composite results
DS types (Figures 1D,E). Simultaneously, the cold anomaly                          for cold wave over North America, especially for DS type, that
appears over North America by the strengthening of the                             have not been examined in detail before.
North Pacific ridge. The ridge in the North Pacific and the                              We note the drop in near-surface temperature anomaly over
trough in North America are consistent with the atmospheric                        central to eastern North America for DS type during days 5 to 20
circulation pattern in favor of the North American cold weather                    (Figure 1E) and perform a significance test for the differences in
discussed above. In particular, the overlying atmospheric                          near-surface temperature anomalies and tropospheric GPH
circulation after DS type (Figure 1E) appears similar to that                      anomalies between SSW types. Figure 2 shows that after the
before SS type (Figure 1C), and substantial cold anomalies are                     DS-type SSW events, the near-surface temperature anomalies are
identified in central North America (120–80°W, 40–55°N). This                       colder than the other two types. However, the differences in
provides observational evidence for the outbreak of cold waves in                  surface temperature anomalies over central North America are
central North America within the conventional split type. For SS                   not statistically significant. Figure 2B also shows that in
type (Figure 1F), as the wave-3 pattern develops, a downstream                     northwestern North America, where a strong cold anomaly is
trough and a significant cold anomaly are limited to northwestern                   identified for SS type (Figure 1F), the difference in the near-
North America, despite the strong ridge of the Northwest Pacific.                   surface temperature between DS and SS is not statistically
   During the second postwarming period (days 20 to 35), the                       significant even though the near-surface temperature anomaly
North Pacific ridge in all types weakens, and the amplitude of the                  for DS type is relatively warmer. In Figure 2A, the positive GPH
cold anomaly in North America also decreases. For the DD type                      anomaly differences over the northern part of the North Pacific
(Figure 1G), positive GPH anomaly in the northern North                            region (north of 60°N) indicate that the development of the ridge
Atlantic and negative GPH anomaly in the southern North                            in the region for the DS type is pronounced compared to DD type.
Atlantic occur. The negative North Atlantic Oscillation                            On the other hand, in Figure 2B, the difference in GPH anomaly
(NAO)-like pattern is often associated with the weakening of                       between the DS and SS types in the region is uncertain. For both
the polar vortex (Baldwin and Dunkerton, 2001). However, for                       cases, the near-surface temperature anomaly over Scandinavia
DS and SS types (Figures 1H,I), the North Atlantic response is                     and Northern Europe (40°W-40°E, 60°N-75°N) are colder for the
relatively uncertain. According to Choi et al. (2020), for DS type,                DS type than the other two types. The significant negative
the negative NAO phase can be considered a precursor rather                        difference in GPH anomaly in these regions between DS and
than a response. Afargan-Gerstman and Domeisen (2020) found                        the other two types in Figure 2 is related to the deepening of the
that the anomalous weather patterns in the Pacific may contribute                   trough for DS type (Figure 1E).

Frontiers in Earth Science | www.frontiersin.org                               4                                       February 2021 | Volume 9 | Article 625868
Choi et al.                                                                                                                             Different SSW Impacts on Surface

  FIGURE 3 | (A) Time series of the 3-day running mean temperature anomaly at 1,000 hPa averaged over (A) North American (80°–120°W, 40°N–55°N) and (B)
  Scandinavia/Northern Europe (40°W-40°E, 60°N-75°N). Blue, orange, and gray lines denote DD, DS, and SS SSW types, respectively. The asterisk indicates statistically
  significant periods from a zero at 90% confidence level. The black bold solid part indicates when the DS minus DD and DS minus SS differences are significantly different
  at 90% confidence level, respectively. Scatter plot of temperature anomaly at 1,000 hPa over (C) North America and (D) Scandinavia/Northern Europe occurring
  during the three SSW types. The temperature anomaly is averaged over days 5 to 20. The mean temperature anomaly for each type is denoted by a closed circle with an
  error bar, indicating one standard deviation. The filled circle represents a statistically significant value at a 90% confidence level.

   To investigate the temporal evolution of the surface                                  Figure 1, the warm anomalies during the prewarming period
temperature over North America according to the SSW type                                 change into cold anomalies after the occurrence of the event for
in more detail, a time series temperature index averaged over                            the DD and DS types. In contrast, for the SS type, the cold
central North America is depicted in Figure 3A. As shown in                              anomaly develops before the central day and gradually weakens

Frontiers in Earth Science | www.frontiersin.org                                     5                                          February 2021 | Volume 9 | Article 625868

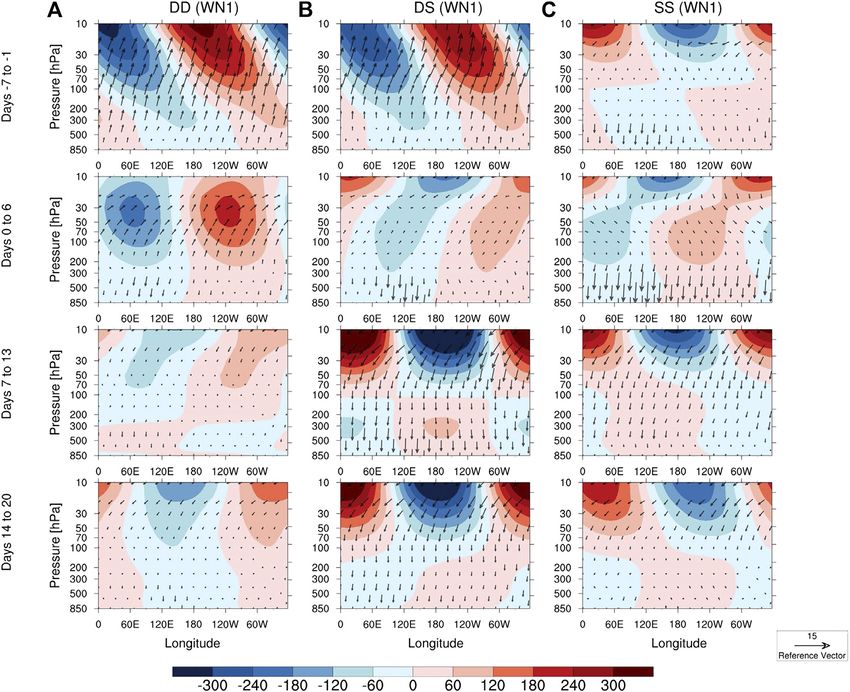
Choi et al.                                                                                                     Different SSW Impacts on Surface

  FIGURE 4 | (Continued).

over time. The difference in the timing of development of the             occur more frequently after the events. Therefore, not only the
North pacific ridge and the North America trough (Figures 1C,E)            mean difference between SSW types but also the significance of
can be related to the difference in the temporal evolution of near-       the mean value itself can provide useful information regarding
surface temperature over North America between DS and SS                  predictability. Figures 3B,D show temperature evolution and
types. Using the traditional two-type classification (Charlton and         index for Scandinavia and Northern Europe, where the cold
Polvani, 2007), where the DS and SS types are not distinguished,          anomaly is more prominent after the DS-type SSW events but
identifying the difference in this type of temperature trend is           is weaker or uncertain after other types. The temperature
challenging. The temperature difference between the DS and SS             difference between the DS type and the other two types is
types is robust during the prewarming period rather than during           significantly lower for about a week after day 10 at the 90%
postwarming period, especially between days -21 to -14. During            significant level. In Figure 3D, a total of 8 cold anomalies are
this period, near-surface temperature over North America for SS           observed out of 10 DS-type events, 10 out of 20 DD-type events,
type is significantly colder than for DS type. The near-surface            and 4 out of 7 SS-type events. Considering the mean value of the
temperature transition from the maximum (day -17) to the                  temperature anomaly, only the cold event from the DS-type result
minimum (day 7) peaks is more rapid in the DS-type period                 is statistically significant.
than the DD-type period. The temperature over North America is                To investigate the origin of the ridge over the North Pacific
further examined based on the temperature index averaged over             Arctic sector, we calculate the planetary-scale wave activity
days 5–20 (Figure 3C). A total of 7 cold anomalies are observed           associated with the North Pacific circulation exhibiting a
out of 10 DS-type events, 13 out of 20 DD-type events, and 4 out          three-dimensional (3-D) wave activity flux (Takaya and
of 7 SS-type events. Considering the mean value of the                    Nakamura, 2001). The longitude-height sections of the 3-D
temperature anomaly, the DD- and SS-type results are                      wave activity flux anomaly averaged over 50–60°N for the
statistically insignificant, and only the cold event from the DS-          zonal-wave component waves 1 and 2, together with GPH
type result is statistically significant. The robust cold anomaly          anomaly averaged over 60–70°N, are depicted in Figure 4. The
over North America for DS type indicates that the near-surface            GPH anomaly is also shown in Figure 4 for the zonal-wave 1 and
cold anomaly is less varying than other SSW types and could               2 components, respectively. We display from day -7 to day 20,

Frontiers in Earth Science | www.frontiersin.org                      6                                 February 2021 | Volume 9 | Article 625868
Choi et al.                                                                                                                           Different SSW Impacts on Surface

  FIGURE 4 | (A)–(C) Longitude-height sections of geopotential height anomaly (shading) averaged over 60°N–70°N, and zonal and vertical components of the 3-D
  wave activity flux anomaly (arrows) averaged over 50°N–60°N, calculated from wave 1 component. From the top to bottom, each panel shows the results averaged over
  7 days from days -7 to 20. The color interval is 100m. Arrows

                                                                at the bottom right indicate the magnitude
                                                                                                       of the zonal and vertical components of 3-D wave activity
  flux [m2 s-2]. The 3-D wave activity flux is scaled by 1000
                                                         p for the zonal component and by 150 ×
                                                                                                    1000
                                                                                                     p for the vertical component. The p is the pressure at each
  level. (A) DD; (B) DS; and (C) SS SSW types. (D)–(F) As in (A)–(C) but for wave 2 component.

because the circulation pattern associated with wave activity                          prominent. At the same time, a tropospheric ridge develops
remained almost the same before day -7 and after day 20.                               near 180°E. During days 14-20, for the DS type, the
   As shown in Choi et al. (2019), before the central day (days -7                     anomalous downward propagation and the North Pacific ridge
to -1), wave-1 GPH anomalies are predominant in DD and DS                              slightly weaken.
types (Figures 4A,B), and their ridges and troughs shift westward                          Choi et al. (2019) showed that the role of the wave-2
toward the upper level and are in phase with winter climatological                     component was marginal throughout the period in the DD
wave-1 pattern (See Supplementary Figure S1A), which                                   type, whereas in DS type, it began to increase a few days
indicates a favorable structure for upward propagation of the                          before the central day. As in the previous finding, Figure 4D
planetary wave (Charney and Drazin, 1961). The upper-level                             also shows that during days -7 to -1, for DD type, wave-2 field
tropospheric ridge is located over the Atlantic sector. The wave-1                     propagates downward to the lower level, whereas for DS type
field for the SS type shows negligible amplitude (Figure 4C), but                       (Figure 4E), upward propagation from the troposphere to the
the wave-2 field (Figure 4F) is developed in phase with the                             upper level is identified. The upward propagation of wave 2 for
climatological wave (See Supplementary Figure S1B) and                                 DS type is temporarily weakened in the troposphere just after the
propagates upward from the troposphere to the stratosphere                             central day (days 0-6) but reinforces during days 7 to 13. Between
(Figure 4F). For wave-1 component, temporal changes in the                             two periods (days -7 to -1 and days 7 to 13), the upper-
zonal and vertical structure of GPH anomaly and upward                                 tropospheric ridge development in the North Pacific region for
propagation properties of the wave before and after the central                        DS type seems to be more pronounced than for other types. After
day appear to be much more dramatic for the DS type than other                         SS type (Figure 3F), the wave-2 field somewhat weakens.
types. During days 7-13, for the DS type, the ridge and trough                         Considering only extreme-long waves (waves 1 and 2), the
lines with height are out of phase with the winter climatological                      tropospheric North Pacific ridge development after SS type is
wave-1 pattern, and anomalous downward propagation is                                  not as evident (Figure 1F). This means that the North Pacific

Frontiers in Earth Science | www.frontiersin.org                                   7                                          February 2021 | Volume 9 | Article 625868
Choi et al. Different SSW Impacts on Surface
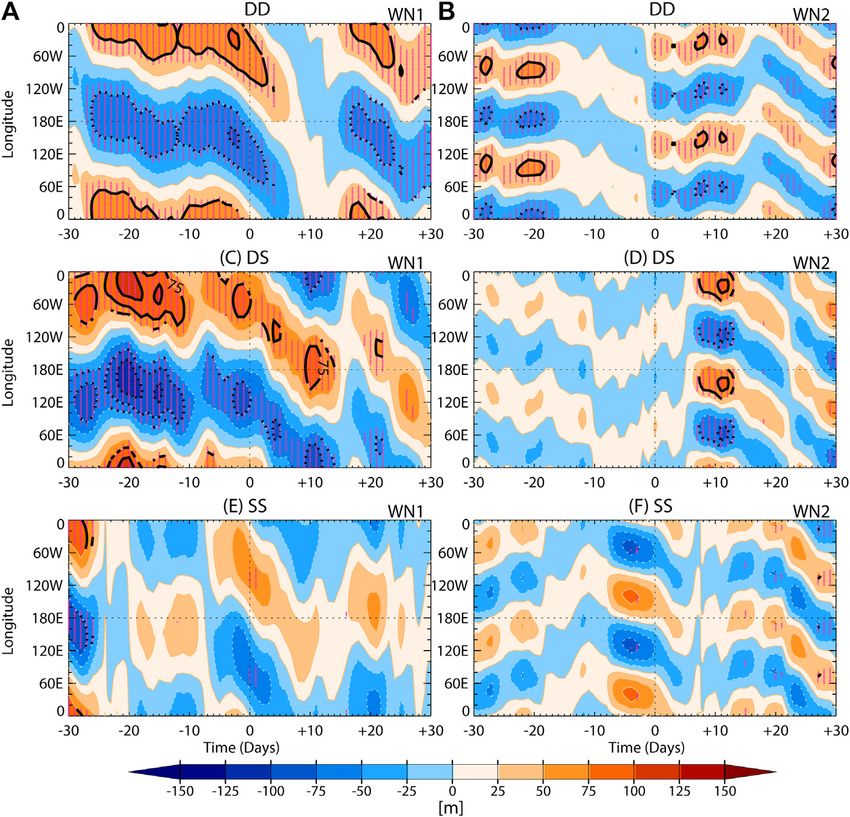
FIGURE 5 | Time-longitude sections of the anomalous geopotential height (A,C,E) wave 1, and (B,D,F) wave 2 averaged over 60°N–70°N at 300 hPa for (Top) DD,
(Middle) DS, and (Bottom) SS SSW types. The color interval is 25 m. Bold contours and pink dots indicate significant regions at 90% confidence level.
ridge development after SS type is associated with wave activity coincides with the time during which there is an anomalous
with wave 3 or higher. downward propagation of the wave 1 component (Figure 4B).
Choi et al. (2019) showed that the stratospheric polar vortex The anomalous North Pacific ridge temporarily weakens but
split into a wave 2 pattern around day 5 after the central day develops again around day 20. The development of the wave 2
during DS-type SSW. Figures 4B,E show the weakening of wave 1 anomaly after the central day (Figure 5D) is also prominent
activity, increase of wave 2 activity, and the North Pacific ridge around day 10. The high-pressure anomaly at approximately
development in the troposphere during days 7–13 for the DS type, 180°E in the North Pacific and a low-pressure anomaly at
all of which are identified following the occurrence of type 60–120°W, corresponding to North America, is consistent with
transition from the displacement to split in the stratosphere. the circulation pattern associated with the significant cold
To show the detailed structural changes of the tropospheric anomaly in North America, as identified in Figure 1E. As
GPH anomaly in Figure 4, the time-longitude sections of the discussed in Figure 4, it is difficult for the SS type to show the
wave 1 and 2 GPH anomalies are depicted in Figure 5, original observed features by considering only waves 1 and 2. The
respectively. For the DD and DS types (Figures 5A,C), before wave 1 evolution after the central day (Figure 5E) seem to be
the central day, the position of the North Pacific ridge similar to the DS type (Figure 5C) but smaller in amplitude.
(60°E–60°W) and trough (120°W–120°E) of wave 1 GPH Although it is re-amplified after day 20, it is not significant. The
anomaly is almost stationary, but after the central day, the large wave 2 amplitude before the central day (Figure 5F)
wave 1 GPH anomaly propagates westward. For the DD type substantially decreases after the central day.
(Figure 5A), its amplitude diminishes rapidly for approximately
two weeks after the central day. The trough in the North Pacific
sector and the ridge in the North Atlantic sector reappear. In SUMMARY
contrast, for the DS type (Figure 5C), its amplitude persists even
after the SSW event and around day 10, an amplification of the In this study, observational evidence for features in weather
positive anomaly appears at approximately 180°E. This period patterns based on the three types of SSW events is provided
Frontiers in Earth Science | www.frontiersin.org 8 February 2021 | Volume 9 | Article 625868Choi et al. Different SSW Impacts on Surface
through a composite analysis using reanalysis data. The surface DATA AVAILABILITY STATEMENT
temperature over North America becomes rapidly cold after the
occurrence of DS-type SSW events. This is probably due to the Publicly available datasets were analyzed in this study. This data
high-pressure anomaly that continuously appears and can be found here: https://psl.noaa.gov/data/gridded/data.ncep.
strengthens around the North Pacific, leading to the formation reanalysis.pressure.html.
of a downstream trough and cold weather.
The development of a North Pacific ridge in the troposphere is
associated with the difference in the vertical and zonal propagation AUTHOR CONTRIBUTIONS
of planetary waves and the vertical structure of planetary waves. The
temporal evolution of the wave 1 GPH anomaly shows that, during HC, BK, and SK initiated and coordinated the work. HC
the DS-type period, the high-pressure anomaly in 0–120°W before provided the calculation. HC wrote the manuscript, and SK,
SSW propagates westward after SSW and the subsequent high- BK, and JK revised it. SK, BK, and JK gave valuable suggestions
pressure anomaly near 180°E and low-pressure anomaly over for analysis.
60–120°W emerge. These circulation patterns are associated with
cold weather in North America.
Although this study mainly describes winter weather in North FUNDING
America, the large cold anomaly over Scandinavia and Northern
Europe after DS-type SSW events (Figure 1E) is also noteworthy. The This study was funded by the project “Earth System Model-based
cold anomaly in this region is prominent after the DS-type SSW Korea Polar Prediction System (KPOPS-Earth) Development and
events but is weaker or uncertain after other types. The temperature Its Application to the High-impact Weather Events originated
difference between the DS type and the other two types is significantly from the Changing Arctic Ocean and Sea Ice” (KOPRI, PE21010).
lower for about a week after day 10 at the 90% significant level. B-MK is supported by the project entitled “Korea-Arctic Ocean
We focus mainly on the observational dependence of the Observing System (K-AOOS), KOPRI, 20160245,” funded by the
tropospheric response on the different SSW types, leaving the MOF, Korea.
question of a causal relationship between planetary-wave
development and wave-propagation properties after the DS-
type SSW for a future study. SUPPLEMENTARY MATERIAL
The results suggest that DS-type SSW information could be
utilized to improve forecasts of cold weather over North America, The Supplementary Material for this article can be found online at:
although the mechanism for the development of the North Pacific https://www.frontiersin.org/articles/10.3389/feart.2021.625868/
ridge remains to be investigated. full#supplementary-material.
Hartmann, D. L. (2015). Pacific sea surface temperature and the winter of 2014.
REFERENCES Geophys. Res. Lett. 42, 1894–1902. doi:10.1002/2015gl063083
Hitchcock, P., Shepherd, T. G., and Manney, G. L. (2013). Statistical
Afargan-Gerstman, H., and Domeisen, D. I. V. (2020). Pacific modulation of the characterization of Arctic polar-night jet oscillation events. J. Clim. 26,
North Atlantic storm track response to sudden stratospheric warming events. 2096–2116. doi:10.1175/jcli-d-12-00202.1
Geophys. Res. Lett. 47, e2019GL085007. doi:10.1029/2019GL085007 Kalnay, E., Kanamitsu, M., Kistler, R., Collins, W., Deaven, D., Gandin, L.,
Baldwin, M. P., and Dunkerton, T. J. (2001). Stratospheric harbingers of anomalous et al. (1996). The NCEP/NCAR 40-year reanalysis project. Bull. Am.
weather regimes. Science 294, 581–584. doi:10.1126/science.1063315 Meteorol. Soc. 77, 437–471. doi:10.1175/1520-0477(1996)0772.0.co;2
impacts associated with atmospheric blocking over the Northeast Pacific. Karpechko, A. Y., Hitchcock, P., Peters, D. H. W., and Schneidereit, A. (2017).
J. Clim. 17, 4823–4839. doi:10.1175/jcli-3237.1 Predictability of downward propagation of major sudden stratospheric
Cellitti, M. P., Walsh, J. E., Rauber, R. M., and Portis, D. H. (2006). Extreme cold air warmings. Q. J. R. Meteorol. Soc. 104 (30), 937. doi:10.1002/qj.3017
outbreaks over the United States, the polar vortex, and the large-scale Kidston, J., Scaife, A. A., Hardiman, S. C., Mitchell, D. M., Butchart, N.,
circulation. J. Geophys. Res. 111, D02114. doi:10.1029/2005jd006273 Baldwin, M. P., et al. (2015). Stratospheric influence on tropospheric jet
Charlton, A. J., and Polvani, L. M. (2007). A new look at stratospheric sudden streams, storm tracks and surface weather. Nat. Geosci. 8, 433–440. doi:10.
warmings. Part I: climatology and modeling benchmarks. J. Clim. 20, 449–469. 1038/ngeo2424
doi:10.1175/jcli3996.1 Kim, B. M., Son, S. W., Min, S. K., Jeong, J. H., Kim, S. J., Zhang, X., et al. (2014).
Charney, J. G., and Drazin, P. G. (1961). Propagation of planetary-scale Weakening of the stratospheric polar vortex by Arctic sea-ice loss. Nat.
disturbances from the lower into the upper atmosphere. J. Geophys. Res. 66, Commun. 5, 4646. doi:10.1038/ncomms5646
83–109. doi:10.1029/jz066i001p00083 Kodera, K., Mukougawa, H., and Itoh, S. (2008). Tropospheric impact of reflected
Choi, H., Choi, W., Kim, S. J., and Kim, B. M. (2020). Dependence of sudden planetary waves from the stratosphere. Geophys. Res. Lett. 35, L16806. doi:10.
stratospheric warming type-transition on preceding North Atlantic oscillation 1029/2008gl034575
conditions. Atmos. Sci. Lett. 21 (3), e953. doi:10.1002/asl.953 Kodera, K., Mukougawa, H., Maury, P., Ueda, M., and Claud, C. (2016). Absorbing
Choi, H., Kim, B.-M., and Choi, W. (2019). Type classification of sudden and reflecting sudden stratospheric warming events and their relationship with
stratospheric warming based on pre- and postwarming periods. J. Clim. 32, tropospheric circulation. J. Geophys. Res. Atmos. 121, 80–94. doi:10.1002/
2349–2367. doi:10.1175/jcli-d-18-0223.1 2015jd023359
Garfinkel, C. I., Hartmann, D. L., and Sassi, F. (2010). Tropospheric precursors of Kolstad, E. W., Breiteig, T., and Scaife, A. A. (2010). The association between
anomalous Northern hemisphere stratospheric polar vortices. J. Clim. 23, stratospheric weak polar vortex events and cold air outbreaks in the Northern
3282–3299. doi:10.1175/2010jcli3010.1 hemisphere. Q. J. R. Meteorol. Soc. 136, 886–893. doi:10.1002/qj.620
Frontiers in Earth Science | www.frontiersin.org 9 February 2021 | Volume 9 | Article 625868Choi et al. Different SSW Impacts on Surface Kretschmer, M., Cohen, J., Matthias, V., Runge, J., and Coumou, D. (2018b). The Renwick, J. A., and Wallace, J. M. (1996). Relationships between North different stratospheric influence on cold-extremes in Eurasia and North Pacific wintertime blocking, El Niño, and the PNA pattern. Mon. Weather America. npj Clim. Atmos. Sci. 1, 44. doi:10.1038/s41612-018-0054-4 Rev. 124, 2071–2076. doi:10.1175/1520-0493(1996)1242. Kretschmer, M., Coumou, D., Agel, L., Barlow, M., Tziperman, E., and Cohen, J. 0.co;2 (2018a). More-persistent weak stratospheric polar vortex states linked to cold Sung, M.-K., Jang, H.-Y., Kim, B.-M., Yeh, S.-W., Choi, Y.-S., and Yoo, C. (2019). extremes. Bull. Am. Meteorol. Soc. 99, 49–60. doi:10.1175/bams-d-16-0259.1 Tropical influence on the North Pacific oscillation drives winter extremes in Kug, J.-S., Jeong, J.-H., Jang, Y.-S., Kim, B.-M., Folland, C. K., Min, S.-K., et al. North America. Nat. Clim. Change 9 (5), 413–418. doi:10.1038/s41558-019- (2015). Two distinct influences of Arctic warming on cold winters over North 0461-5 America and East Asia. Nat. Geosci. 8, 759–762. doi:10.1038/ngeo2517 Sung, M.-K., Kim, B.-M., Baek, E.-H., Lim, Y.-K., and Kim, S.-J. (2016). Arctic- Lehtonen, I., and Karpechko, A. Y. (2016). Observed and modeled tropospheric North Pacific coupled impacts on the late autumn cold in North America. cold anomalies associated with sudden stratospheric warmings. J. Geophys. Res. Environ. Res. Lett. 11, 084016. doi:10.1088/1748-9326/11/8/084016 Atmos. 121, 1591–1610. doi:10.1002/2015jd023860 Takaya, K., and Nakamura, H. (2001). A formulation of a phase-independent Matthias, V., and Kretschmer, M. (2020). The influence of stratospheric wave wave-activity flux for stationary and migratory quasigeostrophic eddies on a reflection on North American cold spells. Mon. Weather Rev. 148, 1675–1690. zonally varying basic flow. J. Atmos. Sci. 58, 608–627. doi:10.1175/1520- doi:10.1175/mwr-d-19-0339.1 0469(2001)0582.0.co;2 Maycock, A. C., and Hitchcock, P. (2015). Do split and displacement sudden White, I., Garfinkel, C. I., Gerber, E. P., Jucker, M., Aquila, V., and Oman, L. D. stratospheric warmings have different annular mode signatures?. Geophys. Res. (2019). The downward influence of sudden stratospheric warmings: association Lett. 42, 10943–10951. doi:10.1002/2015gl066754 with tropospheric precursors. J. Clim. 32 (1), 85–108. doi:10.1175/jcli-d-18- Mitchell, D. M., Gray, L. J., Anstey, J., Baldwin, M. P., and Charlton-Perez, A. J. 0053.1 (2013). The influence of stratospheric vortex displacements and splits on surface climate. J. Clim. 26, 2668–2682. doi:10.1175/jcli-d-12-00030.1 Conflict of Interest: The authors declare that the research was conducted in the Nakagawa, K. I., and Yamazaki, K. (2006). What kind of stratospheric sudden absence of any commercial or financial relationships that could be construed as a warming propagates to the troposphere?. Geophys. Res. Lett. 33, L04801. doi:10. potential conflict of interest. 1029/2005gl024784 Park, T.-W., Ho, C.-H., and Yang, S. (2011). Relationship between the Arctic oscillation Copyright © 2021 Choi, Kim, Kim and Kim. This is an open-access article distributed and cold surges over East Asia. J. Clim. 24, 68–83. doi:10.1175/2010jcli3529.1 under the terms of the Creative Commons Attribution License (CC BY). The use, Rao, J., Garfinkel, C. I., and White, I. P. (2020). Predicting the downward and distribution or reproduction in other forums is permitted, provided the original surface influence of the February 2018 and January 2019 sudden stratospheric author(s) and the copyright owner(s) are credited and that the original publication warming events in subseasonal to seasonal (S2S) models. J. Geophys. Res. 125, in this journal is cited, in accordance with accepted academic practice. No use, e2019JD031919. doi:10.1029/2019jd031919 distribution or reproduction is permitted which does not comply with these terms. Frontiers in Earth Science | www.frontiersin.org 10 February 2021 | Volume 9 | Article 625868
You can also read