Ensemble Temperature and Precipitation Projection for Multi-Factorial Interactive Effects of GCMs and SSPs: Application to China
←
→
Page content transcription
If your browser does not render page correctly, please read the page content below
ORIGINAL RESEARCH
                                                                                                                                     published: 06 September 2021
                                                                                                                                    doi: 10.3389/fenvs.2021.742326

                                           Ensemble Temperature and
                                           Precipitation Projection for
                                           Multi-Factorial Interactive Effects of
                                           GCMs and SSPs: Application to China
                                           Ruixin Duan 1,2, Guohe Huang 1*, Yongping Li 1, Rubing Zheng 2, Guoqing Wang 3,
                                           Baozhen Xin 3, Chuyin Tian 1,2 and Jiayan Ren 1,2
                                           1
                                            State Key Joint Laboratory of Environmental Simulation and Pollution Control, China-Canada Center for Energy, Environment
                                           and Ecology Research, UR-BNU, School of Environment, Beijing Normal University, Beijing, China, 2Sino-Canada Resources and
                                           Environmental Research Academy, North China Electric Power University, Beijing, China, 3State Key Laboratory of
                                           Hydrology–Water Resources and Hydraulic Engineering, Nanjing Hydraulic Research Institute, Nanjing, China

                                           Climate change has broadly impacted on the China areas. There will be severe challenges
                                           due to the variations of precipitation and temperature in the future. Therefore, a
                        Edited by:
                                           comprehensive understanding of the future climate change over China areas is
                        Shan Zhao,
          Shandong University, China       desired. In this study, future annual precipitation and annual mean temperature under
                      Reviewed by:         two SSPs over China areas were projected through multiple global climate models.
                        Lujun Zhang,       Meanwhile, to explore the sources of uncertainty in projecting future climate change,
University of Oklahoma, United States
                            Wei Sun,       the multi-factorial analysis was conducted through GCMs (five levels) and SSPs (two
       Sun Yat-Sen University, China       levels). This study can help us understand the possible changes in precipitation,
                *Correspondence:           temperature, and the potential extreme climate events over the China area. The results
                     Guohe Huang           indicate that China would have more annual precipitation and higher annual mean
          guohe.huang@outlook.com
                                           temperature in the future. Compared with the historical period, the annual mean
                                           temperature would face a continuously increasing trend under SSPs. Regardless of
                    Specialty section:
         This article was submitted to     SSP245 or SSP585, the growth rate of annual precipitation and annual mean
     Interdisciplinary Climate Studies,    temperature increase in the northern region (e.g., Northeast China, North China, and
                a section of the journal
   Frontiers in Environmental Science      Northwest China) are higher than those in the southern parts (e.g., East China, South
            Received: 16 July 2021         China, and Central China). The future temperature rise may increase the frequency of heat-
        Accepted: 23 August 2021           related extreme climate events, which needs to be focused on in future research.
     Published: 06 September 2021
                                           Moreover, GCM was the main contributing factor to the sources of uncertainty in
                               Citation:
                                           projecting future precipitation and SSP was the main factor for future temperature.
   Duan R, Huang G, Li Y, Zheng R,
   Wang G, Xin B, Tian C and Ren J         Overall, climate change is an indisputable fact in China. The annual precipitation and
  (2021) Ensemble Temperature and          annual mean temperature would increase to varying degrees in the future. Reducing the
    Precipitation Projection for Multi-
 Factorial Interactive Effects of GCMs     systemic bias of the climate model itself will undoubtedly be the top priority, and it would
     and SSPs: Application to China.       help to improve the projection and evaluation effects of relevant climate variables.
       Front. Environ. Sci. 9:742326.
    doi: 10.3389/fenvs.2021.742326         Keywords: climate change, annual precipitation, annual mean temperature, multi-factorial analysis, China

Frontiers in Environmental Science | www.frontiersin.org                          1                                     September 2021 | Volume 9 | Article 742326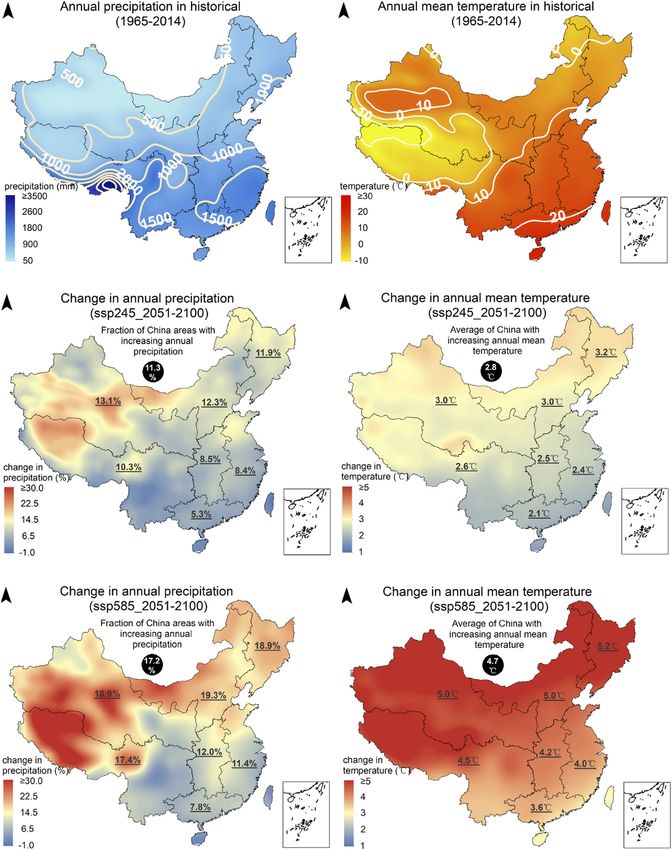
Duan et al.                                                                                                                         Climate Change

INTRODUCTION                                                               (Manrique-Alba et al., 2020). Currently, the GCMs are the
                                                                           only tool available to project future climate change. They have
Temperature and precipitation are the two major climatic                   been widely used in assessing climate change (Thomas et al.,
elements that people are most concerned about under climate                2013). Due to the lack of a full understanding of the complex
change (Tisseuil et al., 2012). Observations show that the average         climate change process, there are inevitably many deficiencies in
temperature of the global land area has been increasing                    GCMs (Paeth and Hense, 2004; Dan et al., 2015; Spinoni et al.,
significantly, especially in recent decades (Cheng et al., 2019).           2019). The grid points of GCMs are often larger than 100 km,
Not only that, but the precipitation has also changed to varying           which makes them difficult to employ for regional climate change
degrees. Changes in temperature and precipitation will cause a             research. Besides, due to the uncertainty of emission scenarios,
series of extreme climate events (Kodinariya and Makwana, 2013;            climate change in the future is often uncertain (Carrão et al., 2016;
Duan et al., 2020). For instance, droughts and heatwaves have              Park et al., 2016; Peltier et al., 2018). Although existing studies
increased, and floods have become more frequent (Wang et al.,               have analyzed the uncertainties of climate models and emission
2004b). There is no doubt that the intensification of climate               scenarios for future climate projections, they have seldom
change has affected the survival and development of humans                 considered their interactive effects (Vogel et al., 2020).
(Feng and Hu, 2014). Besides, changes in precipitation and                 Moreover, the new version of climate models has improved
temperature also affect agricultural, industrial, fisheries, animal         the ability to simulate climate elements. Therefore, it is
husbandry, and other aspects. Therefore, the assessment of future          necessary to strengthen the analysis of future climate change
temperature and precipitation will help to improve the ability to          under the latest coupled model. (i.e., CMIP6).
deal with climate-related impacts (Wang et al., 2018).                        Therefore, as an extension of previous studies, the objective of
Precipitation and temperature in China have also seen                      this research is to evaluate the possible changes in annual
significant changes in recent decades (Shivam et al., 2019).                precipitation and annual mean temperature in China and trace
The increase in climate disasters caused by climate warming                the sources of uncertainty on projecting future climate change.
may be a more prominent problem in China. This may bring                   Specifically, the objective entails 1) exploring changes in
frequent climatic disasters, including excessive rainfall, extensive       temperature and precipitation in the future from multiple
droughts, and sustained high temperatures, resulting in large-             perspectives through an ensemble of multiple GCMs under
scale disaster losses. Therefore, the projection and analysis of           different Shared Socioeconomic Pathways (SSPs), 2)
future climate change have important socio-economic                        quantifying the main contribution (and their interactions) of
significance (Ghosh and Mujumdar, 2007; Zhai et al., 2020).                 climate models and emission scenarios to the sources of
    Previous studies have checked future changes in temperature            uncertainty on climate change projection.
and precipitation in China by multiple climate models (e.g.,
global climate models and regional climate models) (Du et al.,
2018; Jacob et al., 2018). Most research focused on analyzing the          METHODOLOGY AND CLIMATE DATA
temporal and spatial characteristics of key climate elements.
Besides, the quantitative analysis of climate elements was also            Study Area
one of the current research hotspots. In particular, the changes in        The terrain of China is high in the west and low in the east and is
relative historical periods such as temperature and precipitation          complex and diverse (Smirnov et al., 2016; Poschlod et al., 2018;
under different emission scenarios in the future (Cho et al., 2015;        Zhou et al., 2018). Mountains accounted for 33.3% of the total
Ji et al., 2018; Batibeniz et al., 2020). There is no doubt that the       land area, plateaus accounted for 26%, basins accounted for
climate model has become an important tool for assessing future            18.8%, plains accounted for 12%, and hills accounted for 9.9%
climate change in the current period. For example Hui et al.               (Sharafi et al., 2020). The terrain forms a three-level ladder from
(2018), analyzed the mean and extreme climate over China                   west to east. Among them, the Qinghai-Tibet Plateau is located in
during future period through the simulations from global                   the west, with the highest terrain. It is composed of extremely
climate models (GCMs) under two RCPs (Representative                       high mountains and plateaus. Therefore, it is also called the “roof
Concentration Pathways). Ultimately, the study revealed that               of the world”. The second ladder is from the east of the Qinghai-
China area would experience much warmer climate in the                     Tibet Plateau to Daxinganling-Taihang-Wushan-Xuefeng
future (Hui et al., 2018). Ba et al. (2018) assessed the impacts           Mountain (Tan et al., 2011; Thompson et al., 2016). The
of climate change on water resources in Kaidu River Basin                  altitude is generally 1,000–2000 m, and it is mainly composed
through multiple general circulation models under two RCPs.                of mountains, plateaus, and basins. The broad plains and hills of
The results showed that both the precipitation and temperature in          eastern China are the third ladder. The annual precipitation
the study area would increase in the future relative to the                gradually decreases from the southeast coast to the northwest
historical period (Ba et al., 2018). Hou et al. (2019) compared            inland. The annual precipitation in the southeast coastal area is
the performance of multiple climate models for future climate              more than 1,600 mm and decreases to 800 mm near the Qinling-
change projection over different regions in China (Hou et al.,             Huaihe River. Then to the northwest to Daxinganling-Yinshan-
2019).                                                                     Lanzhou-southeast of the Qinghai-Tibet Plateau, it is reduced to
    However, many studies were mainly focused on analyzing the             400 mm. The Helan Mountain to the central part of the Qinghai-
future changes in precipitation and temperature through                    Tibet Plateau reduces to 200 mm. The annual precipitation in the
individual global climate models (GCMs) from CMIP5                         Tarim Basin is less than 50 mm (Moore et al., 2013). The

Frontiers in Environmental Science | www.frontiersin.org               2                                 September 2021 | Volume 9 | Article 742326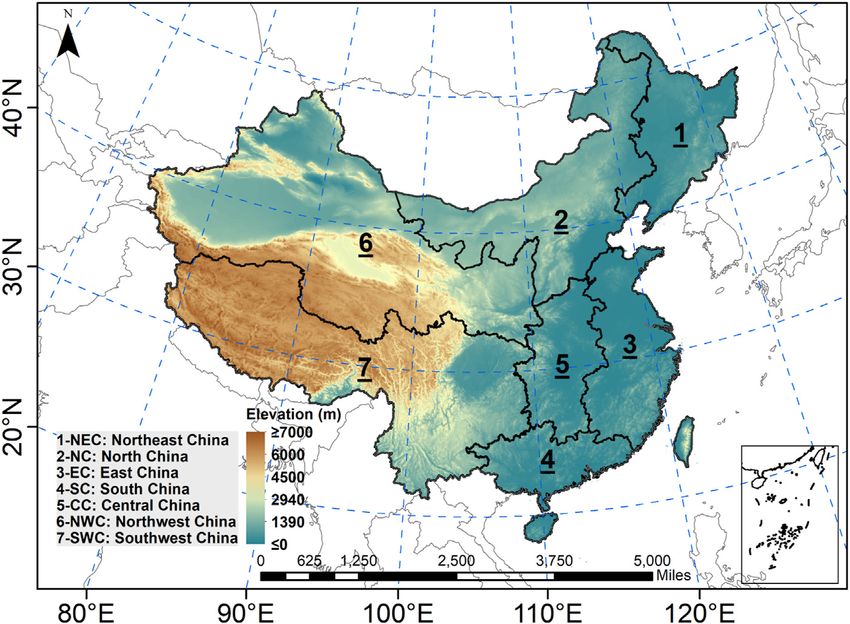
Duan et al.                                                                                                                                          Climate Change

  FIGURE 1 | The study area of China with seven sub-regions. The seven sub-regions are Northeast China, North China, East China, South China, Central China,
  Northwest China, and Southwest China.

TABLE 1 | The information of five global climate models employed in this study.

GCM model                         Resolution (deg)                            Experiment                           Time frequency                     Variant Label

CESM2                                 1.25 × 0.94                     historical,   ssp245,   ssp585                     Mon                             r1i1p1f1
GFDL-ESM4                              1.25 × 1.0                     historical,   ssp245,   ssp585                     Mon                             r1i1p1f1
IPSL-CM6A-LR                          2.50 × 1.27                     historical,   ssp245,   ssp585                     Mon                             r1i1p1f1
MIROC6                                1.41 × 1.40                     historical,   ssp245,   ssp585                     Mon                             r1i1p1f1
MRI-ESM2-0                           1.125 × 1.12                     historical,   ssp245,   ssp585                     Mon                             r1i1p1f1

temperature difference between north and south is large in                               dataset archive (https://esgf-node.llnl.gov/projects/cmip6/). The
winter, while the south is warm, and the temperature gets                                details are shown in Table 1. Two 50-year periods are employed
lower as it goes north. The summer is generally high                                     in this study, including the historical period (1965–2014) and the
throughout the country, and the Qinghai-Tibet Plateau is the                             future period (2051–2100). The data in the future period is
coolest place in China. Due to the combined influence of human                            extracted under two SSPs (i.e., SSP245 and SSP585). The
activities and natural factors, the annual average temperature in                        annual precipitation and annual mean temperature are the two
China has risen by 0.68°C since the 1950s. Therefore, it is                              variables of interest in this study. The data are all united to 0.5° ×
imminent to carry out climate change projection and                                      0.5° in spatial through the bilinear interpolation method (Chen
assessment over China. The changes in precipitation and                                  et al., 2016). The SSPs (Shared Socioeconomic Pathways) is the
temperature in different regions of China are not the same. To                           latest scenarios to project socioeconomic global changes up to
facilitate comparative analysis, China is divided into seven                             2100. They are broadly employed to derive greenhouse gas
subregions, including Northeast China, North China, East                                 emissions scenarios with different climate policies. The SSP245
China, South China, Central China, Northwest China, and                                  scenario assumes that the world follows a path where social,
Southwest China, as shown in Figure 1. The division of                                   economic, and technological trends will not significantly deviate
subregions refers to previous studies (Smalley et al., 2019).                            from historical patterns. Among them, development and income
                                                                                         growth are not balanced. Some countries have made good
Dataset                                                                                  progress, while others have fallen short of expectations. The
Five different kinds of GCMs (i.e., CESM2, GFDL-ESM4, IPSL-                              environmental system has experienced degradation, but there
CM6A-LR, MIROC6, and MRI-ESM2-0) are acquired from the                                   have been some improvements, and the intensity of resource and
WCRP Coupled Model Intercomparison Project (Phase 6)                                     energy use has declined overall (Ying et al., 2019). Global

Frontiers in Environmental Science | www.frontiersin.org                             3                                  September 2021 | Volume 9 | Article 742326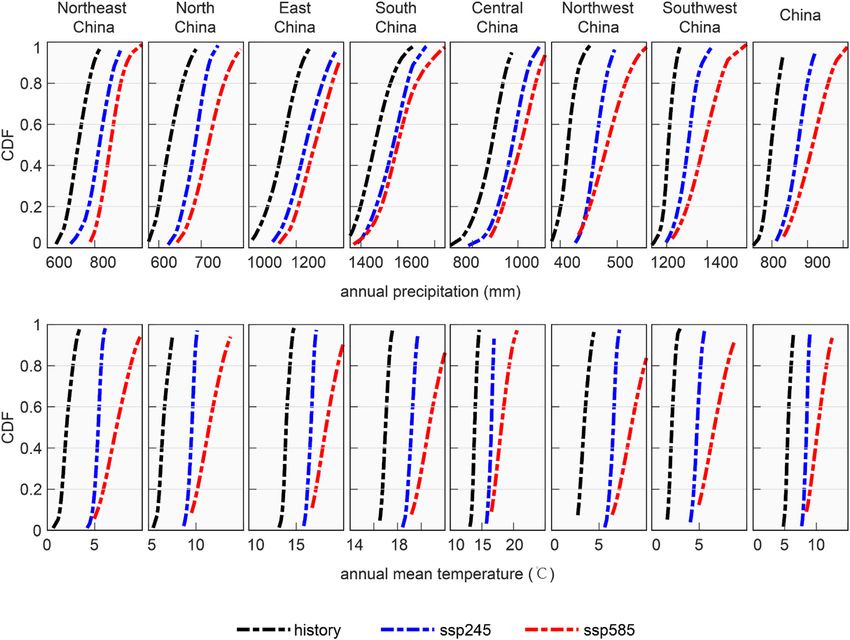
Duan et al. Climate Change
population growth is modest and stabilized in the second half of TABLE 2 | The multi-level factorial design for the sources of uncertainty of future
precipitation and temperature projection.
this century. Income inequality persists or is slow to improve, and
the challenge of reducing vulnerability to social and Levels Factors Response
environmental changes remains (Roberts et al., 2019; Asif and GCMs (x1) SSPs (x2) Precipitation Temperature
Chen, 2020; Li et al., 2020). SSP585 assumes that the world
increasingly believes that competitive markets, innovation, and a 1 CESM2 SSP245 y1-1 y2-1
2 CESM2 SSP585 y1-2 y2-2
participatory society can bring rapid technological progress and
3 GFDL-ESM4 SSP245 y1-3 y2-3
human capital development as a way to sustainable development. 4 GFDL-ESM4 SSP585 y1-4 y2-4
At the same time, while promoting economic and social 5 IPSL-CM6A-LR SSP245 y1-5 y2-5
development, all parts of the world are developing abundant 6 IPSL-CM6A-LR SSP585 y1-6 y2-6
fossil fuel resources and adopting resource- and energy-intensive 7 MIROC6 SSP245 y1-7 y2-7
8 MIROC6 SSP585 y1-8 y2-8
lifestyles. All these factors have led to the rapid growth of the 9 MRI-ESM2-0 SSP245 y1-9 y2-9
global economy, while the global population has reached its peak 10 MRI-ESM2-0 SSP585 y1-10 y2-10
and declined in the 21st century (Trenberth and Shea, 2005).
Multi-Factorial Analysis Method
The main content of the multi-factorial analysis method is the employed (Figure 2). Therefore, there are a total of ten
Analysis of variance (ANOVA) theory (Li et al., 2010). As an different level combinations in this design.
effective statistical method, the main contribution and the
interactions of multiple factors to the sources of uncertainty
can be traced. In this study, the global climate models RESULTS
(i.e., GCMs) and emission scenarios (i.e., SSPs) are the two
sources of uncertainty on future precipitation and temperature
Spatial-Temporal Trends in Precipitation
projection. It has been broadly used to address the non-linear and Temperature
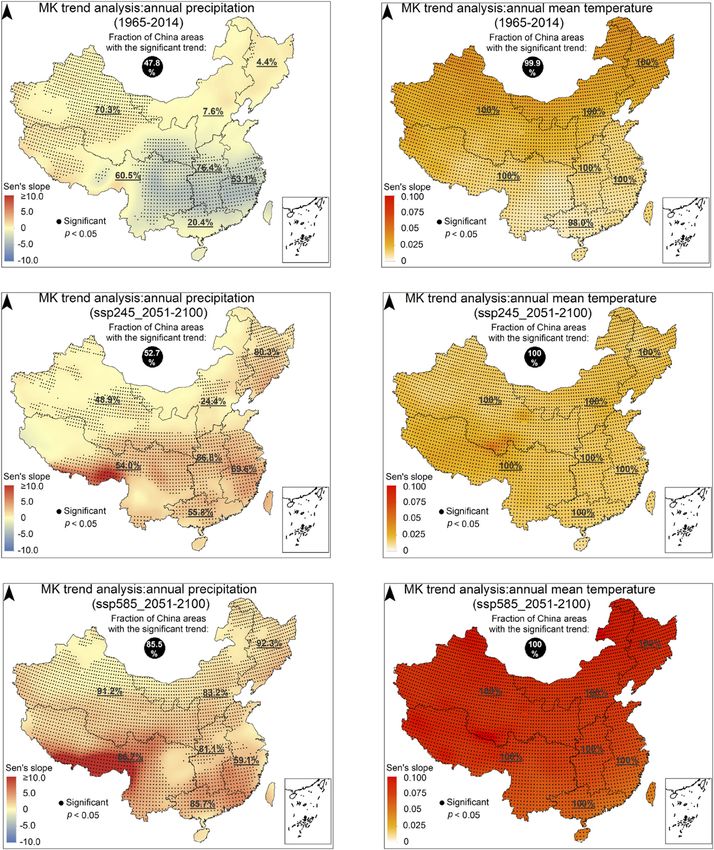
relationship between the independent factors and the dependent Figure 3 presents the Mann-Kendall trend analysis results for
factor (Wang et al., 2004a; Wang et al., 2018; Feng and Hu, 2014). annual precipitation and annual mean temperature in the
In general, a formula can be written as y F (x1, x2, x3, ..., xn) to historical and future periods. MK trend analysis is a non-
express the complex connection. Among them, y is the dependent parametric test method broadly employed to statistically
factor and x represents the multiple independent factors. In this evaluate whether there is a significant change trend in a time
study, the future precipitation or temperature is the y variable, sequence of the corresponding variable. The null hypothesis, H0,
GCMs (five levels) and SSPs (two levels) are x variables (Huang indicates that there is no monotonic trend. The alternative
et al., 1997; Wang et al., 2021). According to the ANOVA theory, hypothesis, H1, states that there is a positive or negative
the total variance contains two aspects: monotonic trend in the data series. More details can be found
in previous study (Duan et al., 2021). For the annual
n
precipitation, nearly half of the areas (47.8%) show a
SStotal SSi + SSint (1)
i1
significant trend in the historical period. Among them, the
central areas in China present a significant decreasing trend.
where SStotal is the total variance; SSi represents the variance of a In the Northwest China, there is a significant growth trend. The
single factor; SSint is expressed as the variance of interactions significant proportion reached 70.3%. In the Northeast China and
between multiple factors. The SSint also can be written as: North China, the significant proportions are relatively small, at
n n n 4.4 and 7.6%, respectively. The fraction of China areas with a
SSint SSij + ... + SS1,2,...,n SStotal − SSi (2) significant trend will be increased to 52.7% during 2051–2100
i1 j > i i1 under SSP245. Besides, the annual precipitation will be increased
to varying degrees in all seven sub-regions. The central areas,
The ratio of the variance of each part to the total variance is South China, and Northeast China have a statistically significant
regarded as the contribution of the main effect and the interactive (indicate by dots) increasing trend for annual precipitation. The
effect to the total effect, respectively. The variance fraction p can significant proportion of precipitation increase in North China
be calculated as follows: and Northeast China has increased compared with the historical
SSi period. The significant proportions in the Northeast China and
pi × 100% (3) North China have reached 80.3 and 24.4%, respectively. The
SStotal
SSint percentage of significant trend areas will continually increase to
pint × 100% (4) 85.5% during 2051–2100 under SSP585. Meanwhile, there will be
SStotal
a significantly high increase center in Southwest China. The
Table 2 presents the detailed multi-factorial design for future significant proportions in Northwest China and Northeast
precipitation and temperature projection. In this study, two China exceed 90%. In North China, Central China, Southwest
factors (i.e., GCM with five levels and SSP with two levels) China, and South China, proportions exceed 80%. The trend
and two responses (i.e., precipitation and temperature) are change in annual mean temperature is in sharp contrast with
Frontiers in Environmental Science | www.frontiersin.org 4 September 2021 | Volume 9 | Article 742326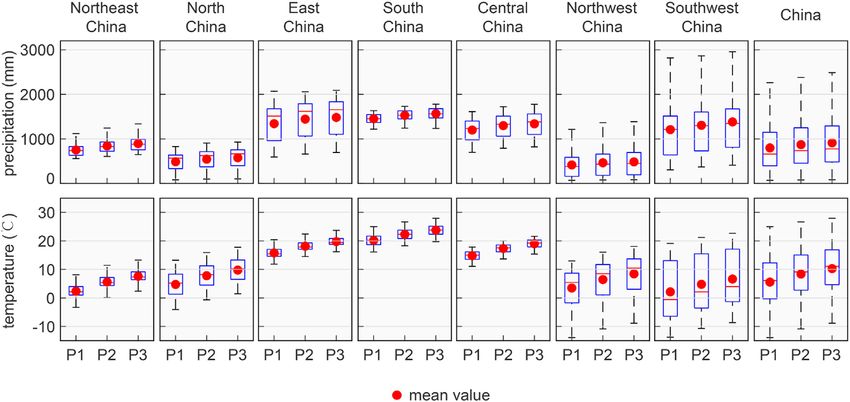
Duan et al.                                                                                                                       Climate Change

  FIGURE 2 | The flowchart of this study.

annual precipitation. It has shown a significant increasing trend         area is still higher than that of the eastern regions. Compared with
both in historical (99.9% significant trend areas) and future             the historical period, the whole China areas will be much wetter
periods (100% significant trend areas) over China areas. The              due to the increase annual precipitation. Among them, the
growth rate is the largest during 2051–2100 under SSP585, which          proportion of precipitation increase in Northwest China,
is 0.1°C/year. In general, over China areas, the annual                  North China, and Northeast China is about 19%. The
precipitation and annual mean temperature will increase                  southwestern region is 18%, and the rest parts are about 10%.
significantly in the future, especially under SSP585. In                  Figure 4 also presents the change in annual mean temperature.
historical and future periods, the northwestern inland                   Undoubtedly, temperature will increase in the future, both under
temperature has increased relatively high. Compared with                 SSP245 and SSP585. The increasing annual mean temperature
precipitation, the temperature has increased significantly                over the whole China areas is 2.8°C under SSP245, and under
throughout China, especially in the future. That means China             SSP585, this increment will be 4.7°C. Interestingly, the spatial
will face higher temperature in the future, and there may be more        pattern of annual mean temperature variations is quite similar to
temperature-related extreme climate events. It is also consistent        precipitation, under both SSPs. Temperature increase in
with previous research conclusions (Chaudhuri et al., 2020; Ramil        Northeast China, North China, and Northwest China is higher
et al., 2020; Shrestha and Wang, 2020).                                  than that in the southern regions. The temperature increase is 3.2,
                                                                         3.0, and 3.0°C, respectively, under SSP245. While under SSP585,
                                                                         the increase is further expanded to 5.2, 5.0, and 5.0°C,
Projections of Future Precipitation and                                  respectively. The temperature increase in the other four sub-
Temperature                                                              regions was relatively small. Under SSP245, the increase is around
Figure 4 shows the variations of future annual precipitation and         2°C, and under SSP585, the increase is around 4°C.
annual mean temperature under SSP245 and SSP585. Compared                   In summary, the results indicate that both annual
with the historical period, the annual precipitation will increase       precipitation and annual mean temperature over China will
by 11.3% over whole China areas, under SSP245. Besides, the              increase in the future. Regardless of SSP245 or SSP585, the
precipitation will also increase to varying degrees in the seven         growth rate of annual precipitation and annual mean
sub-regions. Among them, the growth rate of the inland                   temperature increase in the northern region (e.g., Northeast
northwest area is higher than that of the northern and eastern           China, North China, and Northwest China) are higher than
coastal regions. In general, the increase in the northern part is        those in the southern parts (e.g., East China, South China, and
higher than that in the southern region. The fraction of entire          Central China). The increase in precipitation is closely related to
China areas with increasing annual precipitation will reach to           the rise in temperature, and it has been discussed in previous
17.2% under SSP585. The growth rate of the inland northwest              studies. Potential evapotranspiration will be increased with the

Frontiers in Environmental Science | www.frontiersin.org             5                                 September 2021 | Volume 9 | Article 742326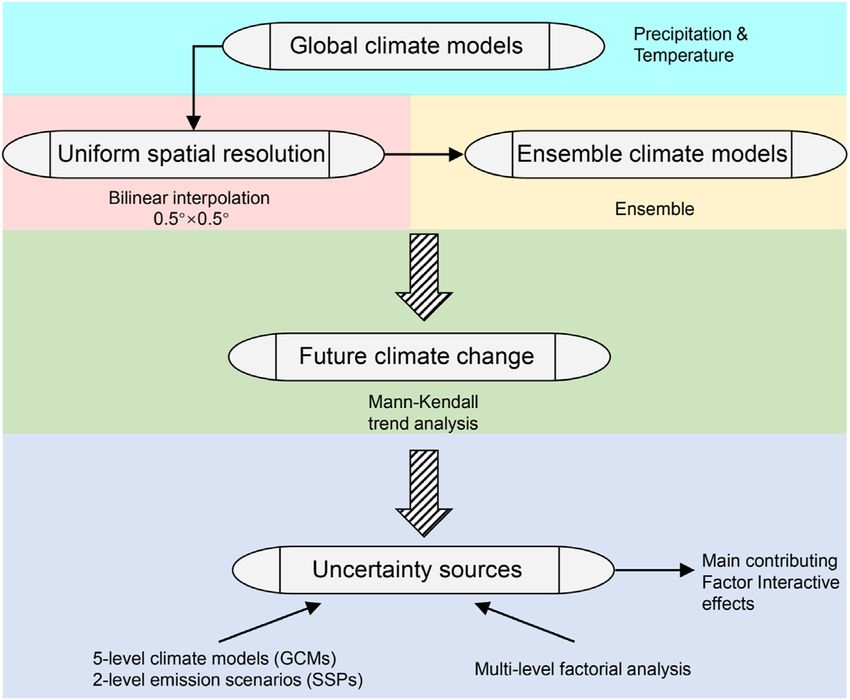
Duan et al.                                                                                                                                                   Climate Change

  FIGURE 3 | The results of Mann-Kendall trend analysis for annual precipitation and annual mean temperature during the historical and future periods. The historical
  period is 1965–2014, and the future period is 2051–2100 under SSP245 and SSP585.

rise in temperature, and it may cause large amounts of moisture                           increase the frequency of heat-related extreme climate events,
to converge. Eventually lead to a large increase in precipitation.                        which needs to be focused on in future research.
Changes in precipitation and temperature will affect many                                    Figure 5 visually shows the historical and future changes in
aspects of China. Such as the agricultural output, human                                  annual precipitation and annual mean temperature in China and
health, and infrastructure. The future temperature rise may                               the seven sub-regions. The results provide more detailed statistics

Frontiers in Environmental Science | www.frontiersin.org                              6                                        September 2021 | Volume 9 | Article 742326

Duan et al.                                                                                                                                            Climate Change

  FIGURE 4 | The change in spatial distribution of annual precipitation and annual mean temperature during 2051–2100 under two SSPs relative to the historical
  period.

on the changes in precipitation and temperature. Precipitation in                      dry areas tend to be wet. For the annual mean temperature, the
East China, South China, Central China, and Southwest China is                         East China, South China, and Central China will face higher
much more. However, the growth rate in the future is significantly                      temperature.
lower than that of other regions, as shown in Figure 4. The results                       Figure 6 presents the changes in the probability distribution of
also indicate that the previously wet areas will be wetter, while the                  annual precipitation and annual mean temperature. The black

Frontiers in Environmental Science | www.frontiersin.org                           7                                      September 2021 | Volume 9 | Article 742326
Duan et al.                                                                                                                                                  Climate Change

  FIGURE 5 | Changes in annual precipitation and the annual mean temperature in China and its seven regions in the historical and future periods. Among them, P1
  represents 1965–2014, P2 is 2051–2100 under SSP245, and P3 is 2051–2100 under SSP585.

  FIGURE 6 | Changes in probability distribution of annual precipitation and the annual mean temperature in China and its seven regions in the historical and future
  periods.

Frontiers in Environmental Science | www.frontiersin.org                              8                                        September 2021 | Volume 9 | Article 742326
Duan et al.                                                                                                                                          Climate Change

  FIGURE 7 | The main contribution (and their interactions) of GCM and SSP to the sources of uncertainty on annual precipitation and annual mean temperature
  projections over China and seven sub-regions.

line represents the distribution of precipitation and temperature                    Figure 7, the total variance of precipitation and temperature
in the historical period. The blue line is the probability                           projection contains three aspects: GCMs, SSPs, and their
distribution of the two variables in 2051–2100 under SSP245,                         interactions. For annual precipitation, the largest contributing
and the red line represents the probability variation of the two                     factor to the total variance comes from GCM, with the rate of
variables in 2051–2100 under SSP585. Compared with the                               50.68% (Northeast China), 68.33% (North China), 83.28% (East
historical period, the probability distribution of precipitation                     China), 53.35% (South China), 81.20% (Central China), 77.79%
and temperature under SSP245 and SSP585 both shifted to the                          (Northwest China), 53.49% (Southwest China), and 44.73%
right. The results also show that under the SSP scenarios, the                       (entire China), respectively. The second contributing factor is
seven sub-regions and the entire China area will have more                           SSP, with the rate of 34.63% (Northeast China), 22.25% (North
precipitation and higher temperature in the future. Climate                          China), 11.17% (East China), 11.52% (South China), 8.50%
change has significant impacts on China, and the regional                             (Central China), 18.91% (Northwest China), 35.56%
ecological environment and human production may face                                 (Southwest China), and 44.36% (entire China), respectively.
severe challenges in the future due to changes in temperature                        The contribution of the interaction is relatively small, with the
and precipitation, as well as their derivative disasters (e.g.,                      rate of 14.69% (Northeast China), 9.42% (North China), 5.54%
drought). Therefore, a full understanding of the possible                            (East China), 35.13% (South China), 10.30% (Central China),
impacts of climate change on China is desired.                                       3.30% (Northwest China), 10.95% (Southwest China), and
                                                                                     10.91% (entire China), respectively.
                                                                                        For annual mean temperature, the largest contributing factor
Contributing Factors to Variations of                                                to the total variance comes from SSP, with the rate of 54.75%
Precipitation and Temperature                                                        (Northeast China), 64.08% (North China), 65.96% (East China),
The uncertainties come from various factors, such as GCMs and                        74.60% (South China), 66.66% (Central China), 64.84%
SSPs. In this study, GCMs (with five levels) and SSPs (with two                       (Northwest China), 73.22% (Southwest China), and 66.42%
levels) are employed to quantify the main and interactive effects                    (entire China), respectively. The second contributing factor is
on precipitation and temperature projection. As presented in                         GCM, with the rate of 40.64% (Northeast China),32.02% (North

Frontiers in Environmental Science | www.frontiersin.org                         9                                      September 2021 | Volume 9 | Article 742326
Duan et al. Climate Change
China), 29.25% (East China), 21.04% (South China), 28.42% climate change. Ultimately, the outputs of climate models
(Central China), 30.70% (Northwest China), 22.07% accompany various assumptions and limitations. Due to the
(Southwest China), and 29.09% (entire China), respectively. unpredictability of social-economic factor and human behavior
The contribution of the interaction is relatively small, with the in the future period, a variety of potential greenhouse gas
rate of 4.61% (Northeast China), 3.91% (North China), 4.80% emission scenarios have been generated (Shivam et al., 2019;
(East China), 4.35% (South China), 4.92% (Central China), 4.46% Sharafi et al., 2020). For instance, the Representative
(Northwest China), 4.71% (Southwest China), and 4.49% (entire Concentration Pathways (RCPs) in CMIP5 and the Shared
China), respectively. Socioeconomic Pathways (SSPs) in CMIP6. Different emission
The projections of future precipitation and temperature have scenarios have multiple premises and assumptions, which
the uncertainty of global climate models and emission scenarios. represent variations of development paths in the future (Du
Results show that GCM is the main source of uncertainties in et al., 2018). Although developers try to incorporate the main
precipitation projection. For all sub-regions, the main physical processes of the earth’s natural changes into the climate
contributing factor to the total variance in precipitation model, due to unknown emission scenarios, imperfect model
projection is GCM. The average contribution portions are all structure, and complex climate systems, the simulation output of
exceeded 50%. The interaction between GCM and SSP is the climate model is bound to be uncertain. To reduce the system
relatively small. Results also present that SSP is the major uncertainty in the modeling process as much as possible, the
contributing factor to the total variance in temperature calculation and simulation are usually carried out through
projection. The average contribution portions are also ensemble means of multiple GCMs (Moore et al., 2013;
exceeded 50%. Besides, the interaction between GCM and SSP Smalley et al., 2019). A variety of ensemble methods have
is also quite small. Different variables have different sources of been developed in previous studies. In this study, five different
uncertainty. This may reflect the influence of different GCMs under two SSPs are given equal weights. After the
parameterization schemes of the model on the final output result. ensemble process, future annual precipitation and annual
mean temperature are then projected. The simulation
performance of multiple GCMs will vary with different
DISCUSSION variables and the study area. Besides, due to some GCMs
share the same parameterization scheme, some modules or
The study on future precipitation and temperature projection, codes, different GCMs are not completely independent (Vogel
based on ensemble of global climate models, has the uncertainties et al., 2020; Zhai et al., 2020). Therefore, in this study, giving the
of different emission scenarios and climate models. The same weight to all GCMs may not be the optimal solution to
uncertainty of future climate projection may have a profound achieve ensemble. Wang et al. (2019) have assessed eight different
impact on climate change projection and assessment. It is weighting schemes to determine the optimal weight distribution
necessary to quantify different sources of uncertainty to among multiple GCMs. In addition, the effects of different
provide reliable output achieve (Tisseuil et al., 2012; Feng and weighting schemes on the final output simulation results are
Hu, 2014). The relationship between the independent variables also compared (Wang et al., 2019). The performance of multiple
(i.e., climate models and emission scenarios) and the response GCMs ensemble has been confirmed in many studies, and the
variable is not a simple linear relationship. It is hard to explore ability to project future climate change is better than a single
their main and interactive effects on response variables. GCM. Perhaps the multiple GCMs ensemble can reduce the
Nevertheless, the application of factorial analysis can roughly systematic bias from the individual GCM, thereby improving
explore the main effects and interactions of various factors behind the ability to project future variables. In the current climate
complex nonlinear relationships. Therefore, GCMs with five change-related study, GCM is the only tool that can be used,
levels and SSPs with two levels are employed to trace the but due to its shortcomings, the projection of some climate
sources of uncertainty in projecting future precipitation and variables has a large deviation. In future research, reducing the
temperature, and the multi-factorial analysis method is used in systemic bias of the climate model itself will undoubtedly be the
this study. Results show that the major contributing factors in top priority (Chen et al., 2016; Wang et al., 2018).
projecting future precipitation are all GCM over seven sub-
regions and entire China. However, the major contributing
factors in projecting future temperature are all SSP over seven CONCLUSION
sub-regions and entire China (Chen et al., 2016; Manrique-Alba
et al., 2020). The effects explained by GCM and SSP interactions In this study, future annual precipitation and annual mean
are relatively small for both future precipitation and temperature temperature under two SSPs over China areas were projected
projection. To trace the different sources of uncertainty in through multiple global climate models. Meanwhile, to explore
projecting future climate change, multiple qualitative and the sources of uncertainty in projecting future climate change, the
quantitative methods have been employed in previous studies, multi-factorial analysis was conducted through GCMs (five
such as the ANOVA theory. levels) and SSPs (two levels). This study can help us
The different kinds of uncertainties sources of multiple climate understand the possible changes in precipitation, temperature,
models perhaps lie in the insufficient cognizing and and the potential extreme climate events over the China area. The
understanding on the natural earth change process of global results indicate that China would have more annual precipitation
Frontiers in Environmental Science | www.frontiersin.org 10 September 2021 | Volume 9 | Article 742326Duan et al. Climate Change
and higher annual mean temperature in the future. Compared climate model itself will undoubtedly be the top priority, and it
with the historical period, the annual mean temperature would will help improve the projection and evaluation effects of relevant
face a continuously increasing trend under SSPs. Regardless of climate variables.
SSP245 or SSP585, the growth rate of annual precipitation and
annual mean temperature increase in the northern region (e.g.,
Northeast China, North China, and Northwest China) are DATA AVAILABILITY STATEMENT
higher than those in the southern parts (e.g., East China,
South China, and Central China). The increase in The original contributions presented in the study are included in
precipitation is closely related to the rise in temperature. the article/Supplementary Material, further inquiries can be
Potential evapotranspiration would be increased with the directed to the corresponding author.
temperature rise, and it could cause large amounts of
moisture to converge. Eventually, this leads to a large
increase in precipitation. Changes in precipitation and AUTHOR CONTRIBUTIONS
temperature would affect many aspects of China. Such as
the agricultural output, human health, and infrastructure. RD: Conceptualization, Methodology, Software, Investigation,
The future temperature rise may increase the frequency of Writing—original draft, Visualization GH: Supervision,
heat-related extreme climate events, which needs to be focused Funding acquisition, Project administration YL: Data curation,
on in future research. Moreover, GCM was the main Software GW: review and editing BX: review and editing CT:
contributing factor to the source of uncertainty in Software JR: Software.
projecting future precipitation and SSP was the main factor
for future temperature. The interactive effects are relatively
unobvious on both projecting precipitation and temperature. FUNDING
Overall, climate change is an indisputable fact in China. The
annual precipitation and annual mean temperature will increase This research was supported by the National Key Research and
to varying degrees in the future. Reducing the systemic bias of the Development Plan (2016YFA0601502).
Du, L., Mikle, N., Zou, Z., Huang, Y., Shi, Z., Jiang, L., et al. (2018). Global Patterns
REFERENCES of Extreme Drought-Induced Loss in Land Primary Production: Identifying
Ecological Extremes from Rain-Use Efficiency. Sci. Total Environ. 628-629,
Asif, Z., Chen, Z., and Chen, Z. (2020). A Life Cycle Based Air Quality Modeling 611–620. doi:10.1016/j.scitotenv.2018.02.114
and Decision Support System (LCAQMS) for Sustainable Mining Management. Duan, R., Huang, G., Li, Y., Zhou, X., Ren, J., and Tian, C. (2021). Stepwise
J. Environ. Inform. 35 (2), 103–117. doi:10.3808/jei.201900406 Clustering Future Meteorological Drought Projection and Multi-Level Factorial
Ba, W., Du, P., Liu, T., Bao, A., Luo, M., Hassan, M., et al. (2018). Simulating Analysis under Climate Change: A Case Study of the Pearl River Basin, China.
Hydrological Responses to Climate Change Using Dynamic and Statistical Environ. Res. 196, 110368. doi:10.1016/j.envres.2020.110368
Downscaling Methods: a Case Study in the Kaidu River Basin, Xinjiang, China. Duan, R., Huang, G., Zhou, X., Li, Y., and Tian, C. (2021). Ensemble Drought
J. Arid Land. 10, 905–920. doi:10.1007/s40333-018-0068-0 Exposure Projection for Multifactorial Interactive Effects of Climate Change
Batibeniz, F., Ashfaq, M., Diffenbaugh, N. S., Key, K., Evans, K. J., Turuncoglu, U. and Population Dynamics: Application to the Pearl River Basin. Earth’s Future.
U., et al. (2020). Doubling of U.S. Population Exposure to Climate Extremes by 9, e2021EF002215. doi:10.1029/2021EF002215
2050. Earth’s Future 8. doi:10.1029/2019EF001421 Feng, J., and Hu, D. (2014). How Much Does Heat Content of the Western Tropical
Carrão, H., Naumann, G., and Barbosa, P. (2016). Mapping Global Patterns of Pacific Ocean Modulate the South China Sea Summer Monsoon Onset in the
Drought Risk: An Empirical Framework Based on Sub-national Estimates of Last Four Decades? J. Geophys. Res. Oceans. 119, 4029–4044. doi:10.1002/
hazard, Exposure and Vulnerability. Glob. Environ. Change. 39, 108–124. 2013JC009683
doi:10.1016/j.gloenvcha.2016.04.012 Ghosh, S., and Mujumdar, P. P. (2007). Nonparametric Methods for Modeling
Chaudhuri, S., Roy, M., Roy, M., and Jain, A. (2020). Appraisal of Wash (Water- GCM and Scenario Uncertainty in Drought Assessment. Water Resour. Res. 43.
sanitation-hygiene) Infrastructure Using a Composite index, Spatial doi:10.1029/2006WR005351
Algorithms and Sociodemographic Correlates in Rural India. J. Env Inform. Hou, Y.-k., He, Y.-f., Chen, H., Xu, C.-Y., Chen, J., Kim, J.-S., et al. (2019).
35 (1), 1–22. doi:10.3808/jei.201800398 Comparison of Multiple Downscaling Techniques for Climate Change
Chen, Y. D., Li, J., and Zhang, Q. (2016). Changes in Site-Scale Temperature Projections Given the Different Climatic Zones in China. Theor. Appl.
Extremes over China during 2071-2100 in CMIP5 Simulations. J. Geophys. Res. Climatol. 138, 27–45. doi:10.1007/s00704-019-02794-z
Atmos. 121, 2732–2749. doi:10.1002/2015JD024287 Huang, G. H., Baetz, B. W., Patry, G. G., and Terluk, V. (1997). Capacity Planning
Cheng, T. F., Lu, M., and Dai, L. (2019). The Zonal Oscillation and the Driving for an Integrated Waste Management System under Uncertainty: a North
Mechanisms of the Extreme Western North Pacific Subtropical High and its American Case Study. Waste Manag. Res. 15, 523–546. doi:10.1177/
Impacts on East Asian Summer Precipitation. J. Clim. 32, 3025–3050. 0734242x9701500507
doi:10.1175/JCLI-D-18-0076.1 Hui, P., Tang, J., Wang, S., Niu, X., Zong, P., and Dong, X. (2018). Climate Change
Cho, M.-H., Boo, K.-O., Martin, G. M., Lee, J., and Lim, G.-H. (2015). The Impact Projections over China Using Regional Climate Models Forced by Two CMIP5
of Land Cover Generated by a Dynamic Vegetation Model on Climate over East Global Models. Part II: Projections of Future Climate. Int. J. Climatol. 38,
Asia in Present and Possible Future Climate. Earth Syst. Dynam. 6, 147–160. e78–e94. doi:10.1002/joc.5409
doi:10.5194/esd-6-147-2015 Jacob, D., Kotova, L., Teichmann, C., Sobolowski, S. P., Vautard, R., Donnelly, C.,
Dan, L., Cao, F., and Gao, R. (2015). The Improvement of a Regional Climate et al. (2018). Climate Impacts in Europe under +1.5°C Global Warming. Earth’s
Model by Coupling a Land Surface Model with Eco-Physiological Processes: A Future. 6, 264–285. doi:10.1002/2017EF000710
Case Study in 1998. Climatic Change. 129, 457–470. doi:10.1007/s10584-013- Ji, D., Dong, W., Hong, T., Dai, T., Zheng, Z., Yang, S., et al. (2018). Assessing
0997-8 Parameter Importance of the Weather Research and Forecasting Model Based
Frontiers in Environmental Science | www.frontiersin.org 11 September 2021 | Volume 9 | Article 742326Duan et al. Climate Change
on Global Sensitivity Analysis Methods. J. Geophys. Res. Atmos. 123, Tan, Q., Huang, G. H., and Cai, Y. P. (2011). Radial Interval Chance-Constrained
4443–4460. doi:10.1002/2017JD027348 Programming for Agricultural Non-point Source Water Pollution Control
Kodinariya, T. M., and Makwana, P. R. (2013). Review on Determining Number of under Uncertainty. Agric. Water Manage. 98, 1595–1606. doi:10.1016/
Cluster in K-Means Clustering. Int. J. Adv. Res. Comput. Sci. Manag. Stud. 1 (6), j.agwat.2011.05.013
90–95. Thomas, D. S. K., Wilhelmi, O. V., Finnessey, T. N., and Deheza, V. (2013). A
Li, L., Lei, L., Lei, L., Zheng, M. S., Borthwick, A. G. L., and Ni, J. R. (2020). Comprehensive Framework for Tourism and Recreation Drought Vulnerability
Stochastic Evolutionary-Based Optimization for Rapid Diagnosis and Energy- Reduction. Environ. Res. Lett. 8, 044004. doi:10.1088/1748-9326/8/4/044004
Saving in Pilot- and Full-Scale Carrousel Oxidation Ditches. J. Env Inform. 35 Thompson, G., Tewari, M., Ikeda, K., Tessendorf, S., Weeks, C., Otkin, J., et al.
(1), 81–93. doi:10.3808/jei.201700377 (2016). Explicitly-coupled Cloud Physics and Radiation Parameterizations and
Li, Y. F., Li, Y. P., Huang, G. H., and Chen, X. (2010). Energy and Subsequent Evaluation in WRF High-Resolution Convective Forecasts. Atmos.
Environmental Systems Planning under Uncertainty-An Inexact Fuzzy- Res. 168, 92–104. doi:10.1016/j.atmosres.2015.09.005
Stochastic Programming Approach. Appl. Energ. 87, 3189–3211. Tisseuil, C., Vrac, M., Grenouillet, G., Wade, A. J., Gevrey, M., Oberdorff, T., et al.
doi:10.1016/j.apenergy.2010.02.030 (2012). Strengthening the Link between Climate, Hydrological and Species
Manrique-Alba, À., Beguería, S., Molina, A. J., González-Sanchis, M., Tomàs- Distribution Modeling to Assess the Impacts of Climate Change on Freshwater
Burguera, M., del Campo, A. D., et al. (2020). Long-term Thinning Effects on Biodiversity. Sci. Total Environ. 424, 193–201. doi:10.1016/
Tree Growth, Drought Response and Water Use Efficiency at Two Aleppo pine j.scitotenv.2012.02.035
Plantations in Spain. Sci. Total Environ. 728, 138536. doi:10.1016/ Trenberth, K. E., and Shea, D. J. (2005). Relationships between Precipitation and
j.scitotenv.2020.138536 Surface Temperature. Geophys. Res. Lett. 32. doi:10.1029/2005GL022760
Moore, J. K., Lindsay, K., Doney, S. C., Long, M. C., and Misumi, K. (2013). Marine Vogel, M. M., Hauser, M., and Seneviratne, S. I. (2020). Projected Changes in Hot,
Ecosystem Dynamics and Biogeochemical Cycling in the Community Earth Dry and Wet Extreme Events’ Clusters in CMIP6 Multi-Model Ensemble.
System Model [CESM1(BGC)]: Comparison of the 1990s with the 2090s under Environ. Res. Lett. 15, 094021. doi:10.1088/1748-9326/ab90a7
the RCP4.5 and RCP8.5 Scenarios. J. Clim. 26, 9291–9312. doi:10.1175/JCLI-D- Wang, B., LinHoZhang, Y., and Lu, M. M. (2004a). Definition of South China Sea
12-00566.1 Monsoon Onset and Commencement of the East Asia Summer Monsoon*.
Paeth, H., and Hense, A. (2004). SST versus Climate Change Signals in West J. Clim. 17, 699–710. doi:10.1175/2932.1
African Rainfall: 20th-century Variations and Future Projections. Climatic Wang, F., Huang, G. H., Fan, Y., and Li, Y. P. (2021). Development of Clustered
Change. 65, 179–208. doi:10.1023/B:CLIM.0000037508.88115.8a Polynomial Chaos Expansion Model for Stochastic Hydrological Prediction.
Park, C., Min, S.-K., Lee, D., Cha, D.-H., Suh, M.-S., Kang, H.-S., et al. (2016). J. Hydrol. 595, 126022. doi:10.1016/j.jhydrol.2021.126022
Evaluation of Multiple Regional Climate Models for Summer Climate Extremes Wang, H.-M., Chen, J., Xu, C.-Y., Chen, H., Guo, S., Xie, P., et al. (2019). Does the
over East Asia. Clim. Dyn. 46, 2469–2486. doi:10.1007/s00382-015-2713-z Weighting of Climate Simulations Result in a Better Quantification of
Peltier, W. R., d’Orgeville, M., Erler, A. R., and Xie, F. (2018). Uncertainty in Hydrological Impacts? Hydrol. Earth Syst. Sci. 23, 4033–4050. doi:10.5194/
Future Summer Precipitation in the Laurentian Great Lakes basin: hess-23-4033-2019
Dynamical Downscaling and the Influence of continental-scale Processes Wang, Y., Leung, L. R., McGregor, J. L., Lee, D.-K., Wang, W.-C., Ding, Y., et al.
on Regional Climate Change. J. Clim. 31, 2651–2673. doi:10.1175/JCLI-D- (2004b). Regional Climate Modeling: Progress, Challenges, and Prospects.
17-0416.1 J. Meteorol. Soc. Jpn. 82, 1599–1628. doi:10.2151/jmsj.82.1599
Poschlod, B., Hodnebrog, Ø., Wood, R. R., Alterskjær, K., Ludwig, R., Myhre, G., Wang, Z., Zhong, R., Lai, C., Zeng, Z., Lian, Y., and Bai, X. (2018). Climate Change
et al. (2018). Comparison and Evaluation of Statistical Rainfall Disaggregation Enhances the Severity and Variability of Drought in the Pearl River Basin in
and High-Resolution Dynamical Downscaling over Complex Terrain. South China in the 21st century. Agric. For. Meteorology 249, 149–162.
J. Hydrometeorol. 19, 1973–1982. doi:10.1175/JHM-D-18-0132.1 doi:10.1016/j.agrformet.2017.12.077
Ramil, A., Vázquez-Nion, D., Vázquez-Nion, D., Pozo-Antonio, J. S., Sanmartín, Ying, J., Huang, P., and Lian, T. (2019). Changes in the Sensitivity of Tropical
P., and Prieto, B. (2020). Using Hyperspectral Imaging to Quantify Rainfall Response to Local Sea Surface Temperature Anomalies under Global
Phototrophic Biofilms on Granite. J. Env Inform 35 (1), 34–44. doi:10.3808/ Warming. Int. J. Climatol. 39, 5801–5814. doi:10.1002/joc.6303
jei.201800401 Zhai, A. F., Ding, X. W., Ding, X. W., Zhao, Y., Xiao, W. H., and Lu, B. X. (2020).
Roberts, J. L., Tozer, C. R., Ho, M., Kiem, A. S., Vance, T. R., Jong, L. M., et al. Improvement of Instantaneous point Source Model for Simulating
(2019). Reconciling Unevenly Sampled Paleoclimate Proxies: A Gaussian Radionuclide Diffusion in Oceans under Nuclear Power Plant Accidents.
Kernel Correlation Multiproxy Reconstruction. J. Environ. Inform 35 (2), J. Environ. Inform 36 (2), 133–145. doi:10.3808/jei.201700380
1–10. doi:10.3808/jei.201900420 Zhou, X., Huang, G., Wang, X., and Cheng, G. (2018). Dynamically-downscaled
Sharafi, L., Zarafshani, K., Keshavarz, M., Azadi, H., and Van Passel, S. (2020). Temperature and Precipitation Changes over Saskatchewan Using the PRECIS
Drought Risk Assessment: Towards Drought Early Warning System and Model. Clim. Dyn. 50, 1321–1334. doi:10.1007/s00382-017-3687-9
Sustainable Environment in Western Iran. Ecol. Indicators. 114, 106276.
doi:10.1016/j.ecolind.2020.106276 Conflict of Interest: The authors declare that the research was conducted in the
Shivam, G., Goyal, M. K., Goyal, M. K., and Sarma, A. K. (2019). Index-based Study absence of any commercial or financial relationships that could be construed as a
of Future Precipitation Changes over Subansiri River Catchment under potential conflict of interest.
Changing Climate. J. Env Inform. 34 (1), 1–14. doi:10.3808/jei.201700376
Shrestha, N. K., Wang, J., and Wang, J. (2020). Water Quality Management of a Publisher’s Note: All claims expressed in this article are solely those of the authors
Cold Climate Region Watershed in Changing Climate. J. Environ. Inform 35 (1), and do not necessarily represent those of their affiliated organizations, or those of
56–80. doi:10.3808/jei.201900407 the publisher, the editors and the reviewers. Any product that may be evaluated in
Smalley, K. M., Glisan, J. M., and Gutowski, W. J. (2019). Alaska Daily Extreme this article, or claim that may be made by its manufacturer, is not guaranteed or
Precipitation Processes in a Subset of CMIP5 Global Climate Models. endorsed by the publisher.
J. Geophys. Res. Atmos. 124, 4584–4600. doi:10.1029/2018JD028643
Smirnov, O., Zhang, M., Xiao, T., Orbell, J., Lobben, A., and Gordon, J. (2016). The Copyright © 2021 Duan, Huang, Li, Zheng, Wang, Xin, Tian and Ren. This is an
Relative Importance of Climate Change and Population Growth for Exposure to open-access article distributed under the terms of the Creative Commons Attribution
Future Extreme Droughts. Climatic Change. 138, 41–53. doi:10.1007/s10584- License (CC BY). The use, distribution or reproduction in other forums is permitted,
016-1716-z provided the original author(s) and the copyright owner(s) are credited and that the
Spinoni, J., Barbosa, P., Bucchignani, E., Cassano, J., Cavazos, T., Christensen, J. H., original publication in this journal is cited, in accordance with accepted academic
et al. (2020). Future Global Meteorological Drought Hot Spots: A Study Based practice. No use, distribution or reproduction is permitted which does not comply
on CORDEX Data. J. Clim. 33, 3635–3661. doi:10.1175/jcli-d-19-0084.1 with these terms.
Frontiers in Environmental Science | www.frontiersin.org 12 September 2021 | Volume 9 | Article 742326You can also read