Environmental Justice
Mapping Tools
←
→
Page content transcription
If your browser does not render page correctly, please read the page content below

Environmental Justice Mapping Tools
EPA EJSCREEN Mapping Tool
The U.S. Environmental Protection Agency defines environmental justice (EJ) as the
fair treatment and meaningful involvement of all people regardless of race, color,
national origin, or income with respect to the development, implementation, and
enforcement of environmental laws, regulations, and policies. The EPA further
defines the term fair treatment to mean that “no group of people should bear a
disproportionate burden of environmental harms and risks, including those resulting
from the negative environmental consequences of industrial, governmental, and
commercial operations or programs and policies”
A preliminary screening analysis can be used to identify the extent to which a
policy action may raise potential EJ concerns that need further evaluation, and
what level of analysis is feasible and appropriate. Factors that can be used in
determining the appropriate level and type of analysis include proximity of
pollution sources to low-income populations, minority populations, and/or
indigenous peoples and whether there has been a history of cumulative concerns
associated with a pollutant.
EPA EJSCREEN is an environmental justice mapping and screening tool that provides
users with a nationally consistent dataset and approach for considering
environmental and demographic indicators: https://ejscreen.epa.gov/mapper/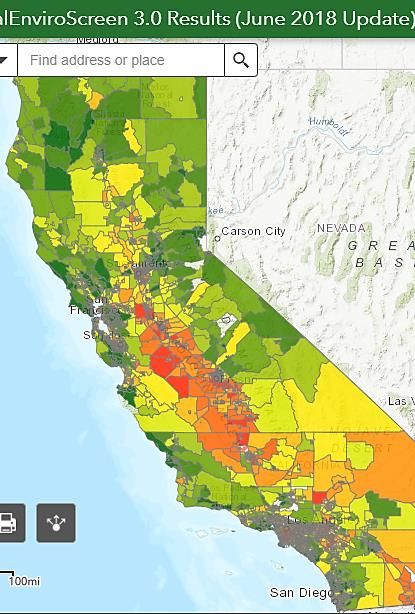
EPA EJSCREEN Mapping Tool (continued)
Originally developed to help EPA identify areas in need of further review,
analysis, or outreach to support cumulative impact strategies, including for
compliance, enforcement, Superfund program planning, and permitting programs
Tool provides information on environmental indicators and demographic
indicators
An EJ Index is a single environmental indicator with the demographic index, using
either national or state-level averages
Environmental indicators: Air toxics cancer risk, air toxics respiratory hazard index,
diesel particulate matter level in air, ozone level in air, particular matter level in air,
taffic proximity and volume, lead paint indicator, proximity to National Priority List
(NPL) sites, proximity to risk management plan (RMP) facilities, proximity to treatment
storage and disposal facilities (TSDF), and wastewater dischargers indicator
Demographic indicators: minority, low-income, have less than a high school education,
experience linguistic isolation, are 64 years old or older, and are 5 years old or younger
Summary Table of Environmental Indicators and Data Sources

                                                                                                                                                                                            Data
Key           Indicator                                 Details                                                                   Source
                                                                                                                                                                                            Year

              National-Scale Air Toxics Assessment
Air                                                     Lifetime cancer risk from inhalation of air toxics                        EPA NATA                                                  2014
              (NATA) air toxics cancer risk

                                                        Air toxics respiratory hazard index (ratio of exposure concentration to
Air           NATA respiratory hazard index                                                                                       EPA NATA                                                  2014
                                                        health-based reference concentration)

Air           NATA diesel PM                            Diesel particulate matter level in air, µg/m3                             EPA NATA                                                  2014

                                                                                                                                  EPA, Office of Air and Radiation (OAR) fusion of model and
Air           Particulate matter                        PM2.5 levels in air, µg/m3 annual avg.                                                                                               2017
                                                                                                                                  monitor data

                                                        Ozone summer seasonal avg. of daily maximum 8-hour concentration in
Air           Ozone                                                                                                         EPA, OAR fusion of model and monitor data                       2017
                                                        air in parts per billion

                                                        Count of vehicles (AADT, avg. annual daily traffic) at major roads within Calculated from 2017 U.S. Department of Transportation
Air/other     Traffic proximity and volume                                                                                                                                                  2017
                                                        500 meters, divided by distance in meters (not km)                        (DOT) traffic data, retrieved 2019

Dust/ lead                                              Percent of housing units built pre-1960, as indicator of potential lead   Calculated based on Census/American Community Survey      2014-
              Lead paint indicator
paint                                                   paint exposure                                                            (ACS) data, retrieved 2020                                2018

                                                        Count of RMP (potential chemical accident management plan) facilities
Waste/ air/   Proximity to Risk Management Plan
                                                        within 5 km (or nearest one beyond 5 km), each divided by distance in Calculated from EPA RMP database, retrieved 04/05/2020 2020
water         (RMP) sites
                                                        kilometers

Waste/ air/                                             Count of hazardous waste facilities (TSDFs and LQGs) within 5 km (or      TSDF data calculated from EPA RCRAInfo database,
              Proximity to Hazardous Waste Facilities                                                                                                                                       2020
water                                                   nearest beyond 5 km), each divided by distance in kilometers              retrieved 07/06/2020

                                                        Count of proposed or listed NPL - also known as superfund - sites within
Waste/ air/   Proximity to National Priorities List                                                                              Calculated from EPA CERCLIS database, retrieved
                                                        5 km (or nearest one beyond 5 km), each divided by distance in                                                                      2020
water         (NPL) sites                                                                                                        04/22/2020
                                                        kilometers

              Wastewater Discharge Indicator (Stream RSEI modeled Toxic Concentrations at stream segments within 500              Calculated from RSEI modeled toxic concentrations to
Water                                                                                                                                                                                       2020
              Proximity and Toxic Concentration)     meters, divided by distance in kilometers (km)                               stream reach segments, created 07/06/2020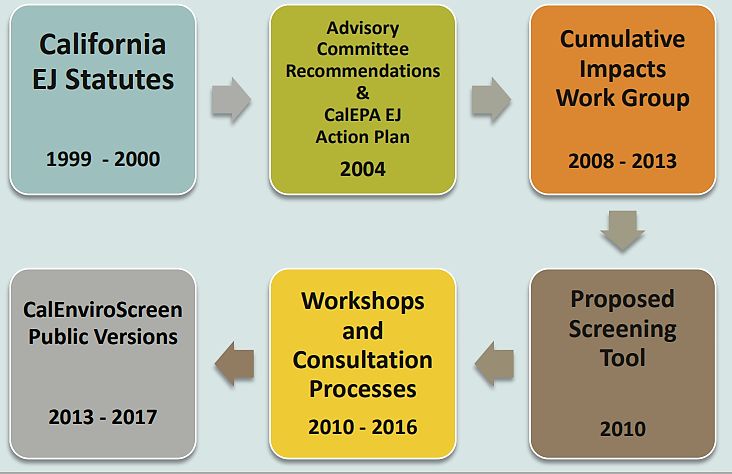
EPA EJ History and Mapping Tool Lessons
One 2020 study on EJ mapping tools concluded the following lessons:
(1) Addressing cumulative impacts is a core strategy for advancing EJ, and this is embodied in
EJ mapping tool development
(2) Guiding principles for developing an EJ mapping tool can be articulated
(3) EJ mapping tools can help facilitate resource investment to promote health and
sustainability in EJ communities
(4) Emerging EJ mapping efforts provide a useful, straightforward, and replicable model that
state and local governments can emulate
(5) Progress in advancing EJ at the state level, including mapping tool development, has come
from the combined efforts of communities, academia, and government.Pros:
•Macro-level view of EJ issues with a color-coded map that
allows for various uses, including:
•Identification of communities with EJ-related concerns and
can be used by governmental and non-governmental
organizations, including for community awareness,
Limitations
educational programs, and the facilitation of resource
investment
•Variety of options, like cell phone usage availability, various
base maps to choose from, report generation for a selected
and area, and a side-to-side maps tool
•Information is publicly available, and data is continually
updated
Highlights Cons
•Environmental indicators vary widely in what they indicate, and
non-technical users may find it difficult to interpret the
statistical language of the information
•EJSCREEN is not a detailed risk analysis and local EJ issues may
not be addressed by this tool or there may be uncertainty in
data if it is addressedCalifornia Mapping Tool
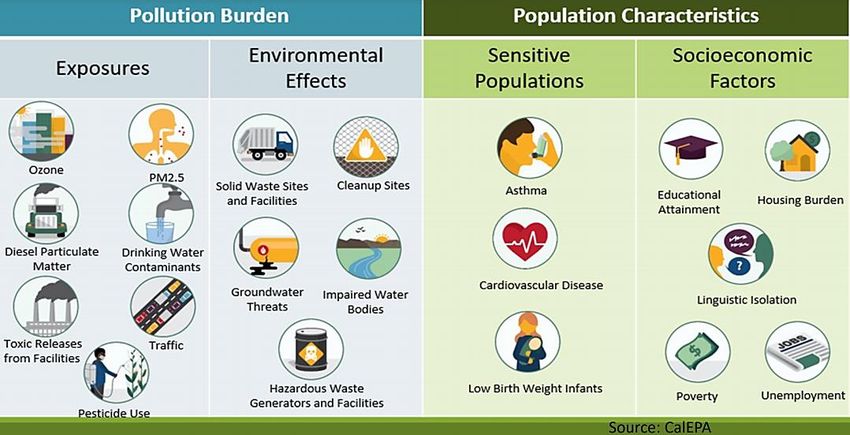
The CalEnviroScreen tool
considers an EJ Score with 20
different indicators for
pollution burdens and
population characteristics
Higher scores indicate higher
EJ issues in a particular census
tract and scores may be
compared between different
geographic areas
The latest CalEnviroScreen
mapping tool version was
released in June 2018 and
considers input received from
various stakeholders and
workshopsMaryland Mapping Tool
The University of Maryland’s School of Public Health has the Community
Engagement, Environmental Justice and Health (CEEJH) laboratory and
manages the Maryland EJScreen tool
Like the California tool, the Maryland EJScreen tool creates an EJ Score with
a higher number indicating a variety of potential environmental or social
factors associated with EJ
▪ Averages environmental exposure and environmental effects to create a
pollution burden
▪ Averages sensitive populations and socioeconomic factors to create population
characteristics
▪ Multiplies the pollution burden and population characteristics figure to create
an EJ Score
Considers sensitive populations in its EJ Score, including areas experiencing
high rates of asthma, myocardial infraction, and low birth rate infants
Maryland-specific information includes county boundaries, municipal
boundaries, supermarkets, public schools, EPA Superfund sites, railroads,
legislative districts, 200% federal poverty line, percent of people who are
Hispanic or Black, and public transit stops
Includes the Park Equity Mapper in partnership with the Maryland Department
of Natural Resources, which aims to identify areas in need of public park
space and expand access for underserved communitiesThank you!
CEJSC main site:
https://mde.maryland.gov/programs/CrossMedia/EnvironmentalJustice/Page
s/cejsc.aspx
Optional further reading:
U.S. Environmental Protection Agency. (2016, June). Technical Guidance for
Assessing Environmental Justice in Regulatory Analysis. Retrieved from:
https://www.epa.gov/sites/production/files/2016-
06/documents/ejtg_5_6_16_v5.1.pdfYou can also read