Establishment of the Quantitative Analysis of Multiindex in Euphorbia lathyris by the Single Marker Method for Euphorbia lathyris Based on the ...
←
→
Page content transcription
If your browser does not render page correctly, please read the page content below
Hindawi
Journal of Analytical Methods in Chemistry
Volume 2021, Article ID 4311934, 8 pages
https://doi.org/10.1155/2021/4311934

Research Article
Establishment of the Quantitative Analysis of Multiindex in
Euphorbia lathyris by the Single Marker Method for Euphorbia
lathyris Based on the Quality by Design Concept

          Feng Xuehua ,1 Zhou Guangjiao ,2 and Tao Ali                                 1

          1
              College of Pharmacy, Anhui Xinhua University, Hefei 230088, China
          2
              Bozhou Chinese Medicine Institute, Anhui Academy of Chinese Medicine, Bozhou 236800, China

          Correspondence should be addressed to Feng Xuehua; fengxuehua@axhu.edu.cn

          Received 27 July 2021; Revised 27 August 2021; Accepted 1 September 2021; Published 17 September 2021

          Academic Editor: Tien Duc Pham

          Copyright © 2021 Feng Xuehua et al. This is an open access article distributed under the Creative Commons Attribution License,
          which permits unrestricted use, distribution, and reproduction in any medium, provided the original work is properly cited.
          Methods. The influences of methanol proportion, flow rate, column temperature, and injection volume in the mobile phase on the
          chromatographic resolution of chromatographic peak of euphorbia factor L1 were experimentally studied via Plackett–Burman
          design, and the key analysis parameters were screened out; the key analysis parameters were optimized through the central
          composite design, and the chromatographic analysis conditions were established. Euphorbia factor L1 was taken as the internal
          reference to construct the relative correction factors for L3 and L4 relative to L1, and their contents were calculated, thus realizing
          the QAMS. Meanwhile, the euphorbia factor L3 and euphorbia factor L4 were determined using the external standard method,
          and the differences of values measured by the external standard method from the values predicted by the QAMS method were
          compared, in an effort to verify the accuracy and feasibility of the QAMS method. Results. The methanol proportion and column
          temperature in the mobile phase were the key analysis parameters (P < 0.05), and the chromatographic conditions were de-
          termined as follows. The methanol/water ratio, column temperature, detection wavelength, flow rate, and injection volume were
          60 : 40, 30°C, 275 nm, 1.0 mL/min, and 10 μL, respectively. A total of 20 batches of samples were determined by the QAMS method
          and external standard method; the relative standard deviations (RSDs) of L3 and L4 determination results were less than 2.0%,
          without any significant difference. Conclusion. The QbD-based QAMS method can be used to determine the contents of euphorbia
          factor L3 and euphorbia factor L4 in Euphorbia lathyris L., and it is accurate and feasible.

1. Introduction                                                           development, registration, and market production. In 2006,
                                                                          food and drug administration officially launched QbD [3, 4].
The quality by design (QbD) concept, which first appeared in               The high-performance liquid chromatography (HPLC) plays
Q8 released on the International Conference on the Har-                   a very important role in the pharmaceutical quality control
monization of Requirements for Registration of Pharma-                    by virtue of its fast, accurate, and reliable characteristics. By
ceuticals for Human Use (ICH), is defined as “a systematic                 applying the QbD concept to the field of HPLC develop-
research method with a predefined target, which highlights                 ment, the concepts such as key quality attributes and key
the understanding of products and processes and process                   analysis parameters are introduced, and a reasonable
control based on the reliable and scientific quality risk                  analysis design scheme is acquired via risk assessment,
management” [1, 2]. This method aims to strengthen the                    experimental design, and statistical analysis [5, 6].
drug development and reach the expected product perfor-                       When it comes to the quantitative analysis of multi-
mance through the active design. In short, it means the                   components by single marker (QAMS) method, one com-
pharmaceutical quality design. In 2005, the American                      ponent in the target sample is taken as the internal reference,
pharmaceutical industry began to talk about QbD. Pfizer,                   the relative correction factors between other components
Novartis, and Merck began to try to use QbD for drug                      and this component are established, and the contents of
2                                                                                  Journal of Analytical Methods in Chemistry

other components are calculated through the relative cor-              Preparation of test solution: took appropriate amount of
rection factors, so as to realize the multicomponents syn-         calamansi and pulverized it through No. 2 sieve to obtain
chronous determination [7–10]. Being able to effectively            medicinal powder. Took about 0.5 g of the powder, accu-
solve the problems of shortage of reference substances and         rately weighed it, added 50 mL of 70% methanol aqueous
high detection cost, this method is applicable to the mul-         solution, weighed, and ultrasonically extracted (power
ticomponents quality control of traditional Chinese me-            250 W, frequency 40 kHz) for 30 min. Then, placed it at
dicinal materials [11, 12].                                        room temperature, weighed it, made up the lost weight with
    As a traditional Chinese medicinal material, Euphorbia         70% methanol aqueous solution, shook well, filtered, and the
lathyris L. is the dry mature seed of Euphorbia lathyris L.        filtrate was the test product.
widely distributed or cultivated in Europe, North Africa,
Central Asia, East Asia, South America, and North America
[13]. Containing multiple chemical components such as              2.3. HPLC Chromatographic Conditions. Agilent ZORBAX
diterpenoids, coumarins, steroids, and flavonoids, Euphor-          SB-C18 (250 mm × 4.6 mm, 5 μm) was used; detection
bia lathyris L. is of extensive pharmacological activities, such   wavelength was 275 nm, column oven temperature was
as antitumor, antidiarrheic, and anti-inflammatory effects.          20–30°C, flow rate was 0.8–1.2 mL/min, and injection vol-
The diterpenoid compounds separated out of Euphorbia               ume was 5–15 μL. Mobile phase was composed of a certain
lathyris L. exceed 20 species, and its diterpenoids has two        proportion of methanol and water, the methanol ratio was
frameworks: lathyrane and ingenane [14, 15], where the             60–70% in the mobile phase, and other conditions were
former mainly contains euphorbia factors L1, L2, L3, L8, and       determined according to the experimental design [17–19].
L9, and the latter mainly contains L4, L5, and L6 [16].
    The QbD concept was applied to the HPLC method, the
key factors influencing the chromatographic resolution of           2.4. Plackett–Burman Design. According to the literature
chromatographic peak were screened out through the                 and preliminary experiments, taking the ratio of methanol in
Plackett–Burman design (PBD), the key analysis parameters          the mobile phase (A), flow rate (B), column temperature (C),
were further optimized via the central composite design            and sample injection volume (D) as the four factors to be
(CCD), and the QAMS method was established for the                 investigated, the chromatographic resolution (Y) of the
euphorbia factors L1, L3, and L4 in Euphorbia lathyris L.          chromatographic peak of euphorbia factor L1 and euphorbia
                                                                   factor L4 were the key attribute quality [20].
2. Materials and Methods
2.1. Materials. Agilent 1290 Infinity II HPLC (all-duties           2.5. PBD Experimental Program and Results. Screened the
pump; multisampler; diode array detector), Agilent UltiMate        factors with certain risks through PBD and used Minitab to
3000 HPLC (LPG-3400A quaternion pump; PDA-3000 de-                 analyze the data [21]. The experimental program and results
tector), Waters 2695 HPLC (2695 quaternary gradient pump;          are given in Table 1, and the factor screening Pareto analysis
Waters 2487 dual wavelength UV detector), chromatographic          is shown in Figure 1. The experimental results show that the
column (Agilent ZORBAX SB-C18, 250 mm × 4.6 mm, 5 μm;              methanol ratio (A) and column temperature (C) in the
GL InertSustain C18, 250 mm × 4.6 mm, 5 μm; Sagix Copsil           mobile phase are significant for the quality of key attributes
C18, 250 mm × 4.6 mm, 5 μm), TC-SY-1000 ultrasonic wave            (P < 0.05), which are key analysis parameters, and other
extractor (Beijing Tongde Venture Technology Co., Ltd.),           factors are noncritical analysis factors, so the flow rate and
CPA225D electronic scale (one hundred thousandth, Ger-             injection volume are set to 1.0 mL/min and 10 μL,
many Sartorius Stedim Biotech), and XPR analytical balance         respectively.
(ten thousandth, Sweden Mettler-Toledo) were used.
    Euphorbia factor L1, euphorbia factor L3, and euphorbia        3. Results and Discussion
factor L4 reference substances (purchased from Baoji
Herbest Biotech Co., Ltd., for the quantitative assay), and        3.1. Central Combination Design Optimization of Liquid
methanol (TCI AMERICA, chromatographic grade), ace-                Chromatography Conditions. Based on the PBD experiment,
tonitrile (TCI AMERICA, chromatographic grade) were                the two key analysis parameters of methanol ratio (X1) and
purchased, and the water used was ultrapure water.                 column temperature (X2) in the mobile phase are optimized
                                                                   by CCD, and a mathematical model between it and key
                                                                   quality attributes was established [22], the experimental
2.2. Solution Preparation. Preparation of reference solution:      scheme and results are given in Table 2, and the analysis of
accurately weighed the reference substances 10.08 mg eu-           variance is given in Table 3.
phorbia factor L1, 10.05 mg euphorbia factor L3, and                   The R2 of the Y model is 0.8102, and the regression
15.05 mg euphorbia factor L4 in the same 100 mL volumetric         equation is Y � +22.24149 − 0.54921X1 + 0.036763X2 −
flask, dissolved them with methanol and diluted to scale            0.018600X1X2 + 7.15500E−003 ∗ X12 + 0.0218553 ∗ X22.
mark, and shook well to obtain a mixed reference solution          From Table 3, it can be seen that the methanol ratio and
containing 0.1008 mg, 0.1005 mg, and 0.1505 mg of eu-              column temperature have significant effects on the resolu-
phorbia factor L1, euphorbia factor L3, and euphorbia factor       tion of euphorbia factor L1 (P < 0.05), which is consistent
L4 in every 1 mL of the sample solution.                           with the experimental results obtained by PBD.
Journal of Analytical Methods in Chemistry 3
Table 1: PBD experimental program and results.
Flow rate B
No. Methanol ratio A (%) Column temperature C (°C) Sample injection volume D (μL) Chromatographic resolution Y
(mL/min)
1 60 (−1) 1.2 (+1) 20 (−1) 5 (−1) 1.62
2 70 (+1) 1.2 (+1) 30 (+1) 5 (−1) 0.89
3 60 (−1) 0.8 (−1) 30 (+1) 15 (+1) 1.53
4 60 (−1) 1.2 (+1) 30 (+1) 15 (+1) 0.85
5 60 (−1) 0.8 (−1) 20 (−1) 15 (+1) 3.23
6 70 (+1) 0.8 (−1) 30 (+1) 15 (+1) 0.78
7 70 (+1) 1.2 (+1) 20 (−1) 15 (+1) 1.45
8 70 (+1) 0.8 (−1) 20 (−1) 5 (−1) 2.88
9 70 (+1) 0.8 (−1) 30 (+1) 5 (−1) 0.91
10 60 (−1) 0.8 (−1) 20 (−1) 5 (−1) 3.12
11 70 (+1) 1.2 (+1) 20 (−1) 15 (+1) 0.86
12 60 (−1) 1.2 (+1) 30 (+1) 5 (−1) 1.94
Pareto Chart of the Standardized Effects
(response is Y, α = 0.05)
2.365
C
A
Term
B
D
0.0 0.5 1.0 1.5 2.0 2.5 3.0 3.5
Standardized Effect
Factor Name
A A
B B
C C
D D
Figure 1: Analysis chart of factor screening Pareto.
Table 2: CCD experimental program and response value.
No. Methanol ratio X1 (%) Column temperature X2 (°C) Chromatographic resolution Y
1 65 (0) 25 (0) 1.56
2 65 (0) 25 (0) 1.12
3 65 (0) 25 (0) 0.98
4 72.07 (1.414) 25 (0) 1.33
5 65 (0) 17.93 (−1.414) 3.19
6 65 (0) 25 (0) 0.86
7 65 (0) 25 (0) 1.11
8 60 (−1) 20 (−1) 1.87
9 65 (0) 32.07 (1.414) 1.96
10 60 (−1) 30 (+1) 2.08
11 70 (+1) 20 (−1) 1.84
12 57.93 (−1.414) 25 (0) 2.35
13 70 (+1) 30 (+1) 0.19
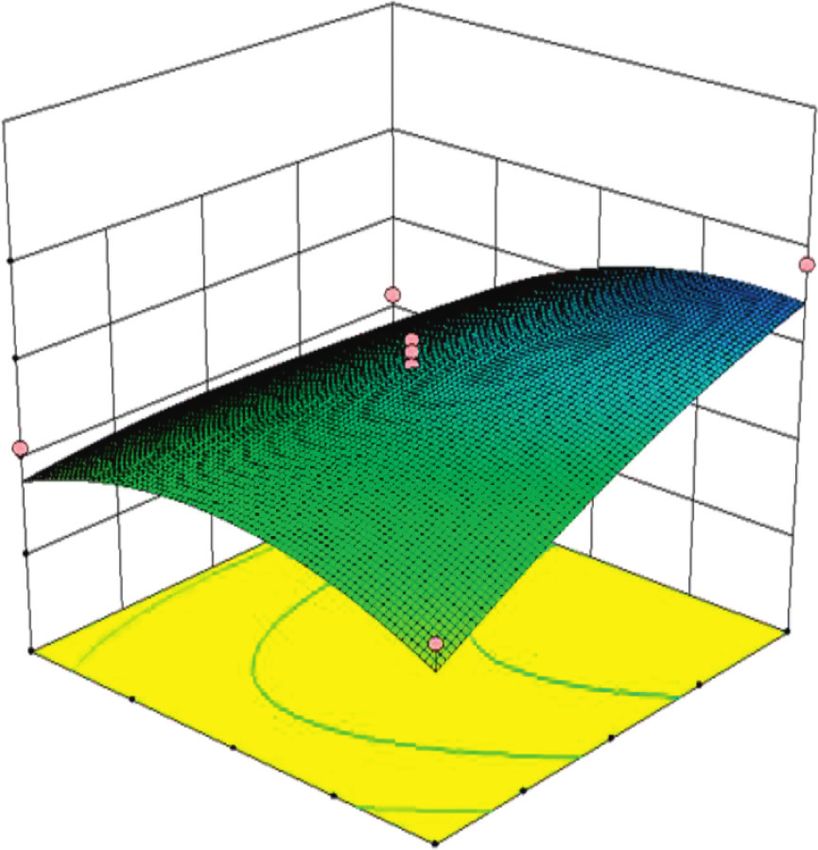
3.2. Condition Optimization and Prediction. The contour Using Design-Expert.8.0.6 software for derivation, it can
plots and response surface plots of each factor to the degree be obtained that when the methanol ratio is 60% and the
of separation are shown in Figures 2 and 3. column temperature is 30°C, the resolution can reach 2.33.4 Journal of Analytical Methods in Chemistry
Y
1.00
0.50
B: X2
0.00
-0.50
-1.00
-1.00 -0.50 0.00 0.50 1.00
A: X1
Figure 2: Contour plot of the effect of methanol ratio and column temperature on resolution.
Table 3: CCD Analysis of variance.
Type SS (sum of squares) MS (mean square) F value P value (prob > F) Df Significance
Model 5.7 1.14 5.97 0.0182 5 Remarkable
X1 1.41 1.41 7.41 0.0292 1 Remarkable
X2 1.26 1.26 6.62 0.0368 1 Remarkable
X1X2 0.86 0.86 4.53 0.0708 1
X12 0.22 0.22 1.17 0.3159 1
X22 2.08 2.08 10.88 0.0131 1
Residual 1.34 0.19 7
Degree of dissimilarity 1.06 0.35 5.01 0.0768 3 Not significant
Pure error 0.28 0.07 4
Total difference 7.04 12
3.3. Verification Experiment. According to the results of the
model analysis, the optimal chromatographic conditions were
obtained. The column was Agilent ZORBAX SB-C18, meth-
anol: water (60 : 40), the column temperature was 30°C, the
detection wavelength was 275 nm, the flow rate was 1.0 mL/
min, and the injection volume was 10 μL. Three samples were
0
tested in parallel, and the average chromatographic resolution
was 2.30. The measured value was compared with the value
1
predicted by the equation, and the deviation was calculated.
The average deviation was 1.30%, and the deviation was small,
2
indicating that the model was effective.
Y
3
3.4. Study on the Method of “QAMS”. According to the
4
chromatographic conditions determined under “3.2,” ac-
1.00
-1.00 curately drew 10 μL each of the mixed reference solution and
0.50
-0.50 test solution under “2.2” and injected them into the liquid
0.00 0.00
A: X1
chromatograph. The results are given in Figures 4 and 5.
B: X2 0.50 -0.50
1.00 -1.00 3.4.1. Investigation of Linear Relationship. Precisely drew 1,
Figure 3: Response surface diagram of the effect of methanol ratio 2, 5, 10, 15, and 20 μL of the mixed reference solution under
and column temperature on resolution. “2.2,” respectively, and performed regression processing onJournal of Analytical Methods in Chemistry 5
1 Table 4: Standard curve of euphorbia factor L1, L3, and L4.
Linear range
30.0 Compound Standard curve r
(μg)
Euphorbia factor
2 Y � 1244.6X + 10.218 0.9999 0.1008–2.016
20.0 L1
Euphorbia factor
Y � 1516.8X − 12.176 0.9998 0.1005–2.010
L3
10.0
Euphorbia factor
3 Y � 597.4X + 11.613 0.9999 0.1505–3.010
L4
-5.0 euphorbia factor L1, euphorbia factor L3, and euphorbia
0.0 5.0 10.0 15.0 20.0 25.0 30.0
factor L4 are 1.24%, 1.08%, and 1.15% , respectively; all were
Figure 4: HPLC chromatograms of reference substance. Note: 1, less than 2.0%, indicating that the precision of the instru-
euphorbia factor L3; 2, euphorbia factor L1; 3, euphorbia factor L4. ment is good.
3.4.5. Sample Recovery Test. Took an appropriate amount of
6 parts of calamansi powder with known content, each about
30.0
1
0.5 g, accurately weighed them, added the same amount of
mixed reference solution, respectively, and prepared the test
2 solution according to the method under “2.2,” determined
20.0
according to law, and the recovery rate was calculated. The
average recovery rates of euphorbia factor L1, euphorbia
10.0 factor L3, and euphorbia factor L4 were 100.14%, 99.97%,
3 and 99.68%, respectively, and the RSD values were 1.02%,
1.06%, and 0.98%, respectively; all were less than 2.0%,
indicating that the accuracy of this method is good.
-5.0
(A − B)
0.0 5.0 10.0 15.0 20.0 25.0 30.0
Recovery(%) � × 100%, (1)
C
Figure 5: HPLC chromatograms of sample. Note: 1, euphorbia
factor L3; 2, euphorbia factor L1; 3, euphorbia factor L4. where A is the measured value, B is the measured component
contained in the test sample, and C is the amount of control
the peak area integral value based on the injection volume. sample added.
The results show that each component was within the
corresponding range, and the linear relationship was good. 3.5. Determination of Relative Correction Factor
The results are given in Table 4.
3.5.1. Calculation of Relative Correction Factor.
According to the chromatographic conditions determined
3.4.2. Stability Test. Took the same test product solution under “3.2,” accurately drew the mixed reference solution
under “2.2,” injected samples after 0, 2, 8, 12, 24, and 36 hours, prepared under “2.2” and injected 1, 2, 5, 10, 15, and 20 μL to
respectively, recorded the peak area, and calculated the RSD determine the peak area of each component. Took the eu-
for each component. The RSD values of euphorbia factor L1, phorbia factor L1 as the internal standard to calculate the
euphorbia factor L3, and euphorbia factor L4 were 1.14%, relative correction factors between euphorbia factor L3,
0.92%, and 1.08%, respectively; all were less than 2.0%. The euphorbia factor L4, and euphorbia factor L1 according to
results showed that the test solution was basically stable after the relative correction factor calculation formula, namely,
being placed for 36 h under experimental conditions. fsi � fs/fi � (As/Cs)/(Ai/Ci) (where As is the peak area of the
internal reference, Ai is the peak area of other components,
3.4.3. Repeatability Test. Took the same batch of euphorbia Cs is the internal reference concentration, and Ci is the
factor medicinal materials to prepare 6 test product solutions concentration of other components) [23–25], as given in
according to the test product preparation method under Table 5.
“2.2,” determined according to law, and the RSD contents of
euphorbia factor L1, euphorbia factor L3, and euphorbia
3.5.2. Reproducibility Investigation of Relative Correction
factor L4 were 0.99%, 1.02%, and 1.13%; all were less than
Factor. Effect of different brands of chromatographic col-
2.0%, indicating that the method has good repeatability.
umns on f: according to the HPLC chromatographic con-
ditions determined under “3.2,” accurately drew the mixed
3.4.4. Precision Test. Took the mixed reference solution reference solution 10 μL prepared under “2.2” and investi-
under “2.2” to repeatedly inject for 6 times, measured the gated the effects of three different brands of chromato-
peak area, and calculated the RSD. The RSD values of graphic columns on the relative correction factors of each6 Journal of Analytical Methods in Chemistry
Table 5: Relative correction factor of two components.
Injection volume (μL) fL3/L1 fL4/L1
1 0.992 1.802
2 0.978 1.791
5 0.994 1.806
10 0.971 1.835
15 0.986 1.794
20 0.989 1.753
Average 0.985 1.797
RSD% 0.90 1.48
Table 6: Effect of different brands of chromatographic columns on f.
Chromatographic columns fL3/L1 fL4/L1
ZORBAX SB-C18 0.991 1.802
GL InertSustain C18 0.978 1.813
Sagix Copsil C18 0.984 1.798
Average 0.984 1.804
RSD% 0.66 0.43
Table 7: Effect of different brands of HPLC instrument on f.
Instrument fL3/L1 fL4/L1
UltiMate 3000 0.980 1.807
Waters 2695 0.979 1.818
Agilent 1290 Infinity II 0.992 1.810
Average 0.984 1.812
RSD% 0.74 0.31
component by Agilent HPLC [26]. The results are given in solution 10 μL prepared under “2.2” and determined the
Table 6, which shows that the relative correction factors relative retention time of the internal reference euphorbia
obtained by different chromatographic columns are basically factor L1. According to the relative retention time, the ac-
the same. curate peak positions of the target peak euphorbia factor L3
Effect of different brands of HPLC instrument on f: and euphorbia factor L4 can be correctly judged, the relative
according to the HPLC chromatographic conditions de- retention time error is controlled within 5%, and the results
termined under “3.2,” accurately drew the mixed reference are given in Table 8. It can be seen from Table 8 that the RSD
solution 10 μL prepared under “2.2” and investigated the values were all less than 2%, indicating that the relative
effects of 3 different brands HPLC instrument of UltiMate retention time is used to locate the chromatographic peak
3000, Waters 2695, and Agilent 1290 Infinity II on the and the method is feasible.
relative correction factor. The results are given in Table 7. It
shows that the relative correction factors obtained by using
different brands of HPLC instrument are basically the 3.6. Comparison of the Results of the QAMS and the External
same. Standard. Took different batches of medicinal materials,
used the external standard method and the QAMS method
to calculate the amount of euphorbia factor L1, euphorbia
3.5.3. Positioning of Chromatographic Peaks. It is a problem factor L3, and euphorbia factor L4 in Euphorbia lathyris L.,
that must be solved in this method to quickly and accurately and the results obtained by the two methods were compared
identify the other two components in medicinal materials to verify the accuracy of the QAMS method for the content
when only one reference substance is used [27,28]. Introduce evaluation of multiindex ingredients in Euphorbia lathyris
the relative retention value of each component to be tested as L. The results are given in Table 9, which suggested that the
the positioning parameter and investigate the repeatability results measured by the QAMS method and the external
under the conditions of different brands of instruments and standard method of the euphorbia factor L1, euphorbia
different specifications of chromatographic columns [29]. factor L3, and euphorbia factor L4 were basically the same,
According to the HPLC chromatographic conditions de- and the SD value of QAMS is small, indicating that the
termined under “3.2,” accurately drew the mixed reference established QAMS method was credible.Journal of Analytical Methods in Chemistry 7
Table 8: Relative retention time measured by different brands of instruments and chromatographic columns.
Relative retention time
Instrument Chromatographic columns
Euphorbia factor L3/euphorbia factor L1 Euphorbia factor L4/euphorbia factor L1
UltiMate 3000 Sagix Copsil C18 0.5591 1.1251
UltiMate 3000 ZORBAX SB-C18 0.5671 1.1302
Waters 2695 Sagix Copsil C18 0.5904 1.1260
Waters 2695 GL InertSustain C18 0.5681 1.1311
Agilent 1290 Infinity II ZORBAX SB-C18 0.5802 1.1265
Agilent 1290 Infinity II GL InertSustain C18 0.5719 1.1235
Average 0.5728 1.1271
RSD% 1.92 0.26
Table 9: Determination of euphorbia factor L1, euphorbia factor L3, and euphorbia factor L4 in Euphorbia lathyris L.
Euphorbia factor L3 (%) Euphorbia factor L4 (%)
Euphorbia factor L1 (%)
Batches QAMS External standard method QAMS External standard method
(mean ± SD)
(mean ± SD) (mean ± SD) (mean ± SD) (mean ± SD)
20200405 (n � 3) 0.2021 ± 0.0079 0.2901 ± 0.0056 0.2899 ± 0.0109 0.1675 ± 0.0083 0.1676 ± 0.0107
20200419 (n � 3) 0.3232 ± 0.0102 0.2684 ± 0.0067 0.2687 ± 0.0070 0.1743 ± 0.0068 0.1743 ± 0.0078
20200602 (n � 3) 0.2682 ± 0.0072 0.2767 ± 0.0085 0.2768 ± 0.0089 0.1834 ± 0.0087 0.1835 ± 0.0093
20200617 (n � 3) 0.1355 ± 0.0087 0.1897 ± 0.0086 0.1899 ± 0.0088 0.1737 ± 0.0102 0.1738 ± 0.0098
20200912 (n � 3) 0.2682 ± 0.0110 0.3322 ± 0.0104 0.3320 ± 0.0097 0.2011 ± 0.0096 0.2009 ± 0.0106
20200926 (n � 3) 0.3127 ± 0.0067 0.2798 ± 0.0113 0.2797 ± 0.0109 0.1932 ± 0.0078 0.1930 ± 0.0093
20201218 (n � 3) 0.2356 ± 0.0093 0.2669 ± 0.0098 0.2667 ± 0.0111 0.1736 ± 0.0069 0.1735 ± 0.0076
10101222 (n � 3) 0.3823 ± 0.0095 0.2638 ± 0.0087 0.2637 ± 0.0094 0.1865 ± 0.0109 0.1866 ± 0.0099
4. Discussion Conflicts of Interest
The content of euphorbia factor L1, euphorbia factor L3, and The authors declare that there are no conflicts of interest.
euphorbia factor L4 is relatively high in Euphorbia lathyris
L., and its anticancer biological activity is strong, so it is of Acknowledgments
great significance to select diterpenoids as the internal
quality evaluation indexes for the quality control of Eu- This research was funded by the Natural Science Research
phorbia lathyris L. In this experiment, based on the QbD to Foundation of the Department of Education of Anhui
design and screening key analysis parameters, a QAMS Province (No. KJ2020A0789), Anhui provincial-level
method for diterpenoids was established. At the same time, quality engineering project: (2020jyxm0790, 2020zyrc077,
the durability of the instrument and chromatographic col- 2011rcpys01, gxbjZD2021089); school-level grassroots
umn was investigated [30–32]. The results show that the teaching and research office demonstration project of
experimentally established relative correction factor f has Anhui Xinhua University (2019jyssfx02).
good reproducibility, and there is no significant difference
between the results obtained by the QAMS method and the
external standard method. The QAMS method established in
References
this experiment has high reproducibility, stability, and re- [1] R. Mehta, J. Teckoe, C. Schoener, S. Workentine, D. Ferrizzi,
liability when determining the amount of euphorbia factor and A. Rajabi-Siahboomi, “Uncovering interaction by QbD in
L1, euphorbia factor L3, and euphorbia factor L4, which optimization of stability-indicating HPLC method for si-
enriches the quality evaluation method of the content of multaneous estimation of low-dose aspirin and lansoprazole,”
Euphorbia lathyris L., and has provided a more sufficient AAPS Pharmscitech, vol. 17, no. 6, pp. 1366–1375, 2016.
reference and basis for the promotion and application of [2] I. Harbi, B. Aljaeid, K. M. El-Say, and A. S. Zidan, “Inves-
QAMS technology in the quality control of traditional tigation of the effects of materials and dry granulation process
on the mirabegron tablet by integrated QbD approach with
Chinese medicine. QAMS is expected to solve the problems
multivariate analysis,” AAPS Pharmscitech, vol. 17, no. 6,
of shortage of reference materials and high testing costs in pp. 1404–1420, 2016.
the multiindex quality evaluation of traditional Chinese [3] K. Bhise, S. K. Kashaw, S. Sau, and A. K. Iyer, “Nanostructured
medicine [33,34]. lipid carriers employing polyphenols as promising anticancer
agents: quality by design (QbD) approach,” International
Data Availability Journal of Pharmaceutics, vol. 526, no. 1-2, pp. 506–515, 2017.
[4] J. T. Ning, J. M. Sun, Z. M. Wang, X. W. Zhang, and
The data used to support the findings of this study are W. Y. Zhang, “Design and in vitro release study of valsartan
available from the corresponding author upon request. bilayer tablets based on quality by design (QbD) concept,”8 Journal of Analytical Methods in Chemistry
Chinese Pharmaceutical Journal, vol. 56, no. 03, pp. 210–217, [20] J. L. Jiang, X. X. Shan, and L. Sun, “Application of a quality by
2021. design approach to optimize separation of alkaloids in
[5] X. M. Wang, Z. Y. Zhao, H. Wang, and H. J. Tian, “Deter- Sophora flavescens,” Journal of Tianjin University (Science and
mination of five heavy metals in soil by inductively coupled Technology), vol. 53, no. 11, pp. 1204–1210, 2020.
plasma atomic emission spectrometry based on analytical [21] Z. Q. Chen, F. Zhao, W. Yuan et al., “Multi-index optimi-
method quality source design,” Physical Testing and Chemical zation of alcohol extraction and water precipitation processes
Analysis (Part B:Chemical Analysis), vol. 56, no. 12, of shenmai injection based on quality by design concept,”
pp. 1313–1319, 2020. Chinese Traditional and Herbal Drugs, vol. 51, no. 17,
[6] Y. Tang, A. J. Zhang, S. Li, H. M. Zhu, J. Z. Mao, and L. Y. Yu, pp. 4433–4441, 2020.
“Study on preparation technology and physical fingerprint of [22] Y. H. He, H. X. Shi, B. S. Diao, and L. Yang, “Extraction
qiwei chanshen granules based on QbD,” Journal of Chinese process of shanshenyin based on QbD concept,” China
Medicinal Materials, vol. 44, no. 01, pp. 146–152, 2021. Pharmaceuticals, vol. 29, no. 15, pp. 28–32, 2020.
[7] Y. K. Bao, Y. Guo, S. S. Kang et al., “Simultaneous deter- [23] H. Y. Xu, C. X. He, S. X. Luo, Z. Q. Yang, H. B. He, and
mination of 4 chemical constituents in garidi-5 pill by QAMS Y. M. He, “Determination of five triterpenes in centellae herba
method,” Environmental Chemistry, vol. 39, no. 12, by a combinative method of HPLC fingerprint and quanti-
pp. 3585–3587, 2020. tative analysis of multi-components by single marker,” Chi-
[8] G. Kuang, J. Zhou, M. Yao et al., “Systematic study on QAMS nese Pharmaceutical Journal, vol. 56, no. 03, pp. 181–188, 2021.
method for simultaneous determination of triterpenoid sa- [24] Y. X. Liu, C. P. Feng, L. L. Liu, Q. F. Mao, Y. M. Qiu, and
ponins in ilex pubescens by HPLC and UPLC,” Analytical L. Y. Peng, “Simultaneous determination of 8 components in
Methods, vol. 7, no. 16, pp. 6579–6587, 2015. erzhi pills by QAMS method,” Chinese Journal of Pharma-
[9] D. W. Li, M. Zhu, Y. D. Shao, Z. Shen, C. C. Weng, and ceutical Analysis, vol. 41, no. 02, pp. 210–218, 2021.
W. D. Yan, “Determination and quality evaluation of green [25] J. Feng, L. Chai, M. S. Chen, J. T. Yuvan, and B. M. Liu,
tea extracts through qualitative and quantitative analysis of “Application of fingerprint combined with QAMS in quality
multi-components by single marker (QAMS),” Food Chem- evaluation of amomum paratsao-ko,” Chinese Traditional and
istry, vol. 197, pp. 1112–1120, 2016. Herbal Drugs, vol. 52, no. 03, pp. 852–856, 2021.
[10] L. Cui, Y. Zhang, W. Shao, and D. Gao, “Analysis of the HPLC [26] L. G. Tong, Y. Y. Liu, R. Y. Wang et al., “Simultaneous de-
fingerprint and QAMS from Pyrrosia species,” Industrial termination of the contents of 6 components in fuzheng
Crops and Products, vol. 85, pp. 29–37, 2016. guben granules by QAMS,” China Pharmacy, vol. 32, no. 02,
[11] Y. T. Ouyang, Z. B. Tan, and L. M. Chen, “Simultaneous pp. 225–230, 2021.
determination of three phenolic acids in Artemisia Japonica [27] Y. Huang, F. Y. Dong, C. Y. Li, and D. Q. Wang, “Simul-
by QAMS,” Pharmacy Today, vol. 31, no. 01, pp. 23–26, 2021. taneous quantitative determination of 10 chemical constitu-
[12] J. Yao, X. G. Sun, R. Dong, J. H. Xie, Y. L. Wang, and ents in radix isatidis by QAMS method,” Chinese Traditional
X. N. Yang, “Simultaneous quantitative analyses of six and Herbal Drugs, vol. 52, no. 03, pp. 845–851, 2021.
components in Astragalus membranaceus based on HPLC- [28] L. Huang, C. Y. Yao, Y. Liang et al., “Determination of three
CAD and quantitative analysis of multi-components with a non-alkaloids from sophorae tonkinensis radix et rhizoma
single-marker,” Acta Pharmaceutica Sinica, vol. 56, no. 02, with quantitative analysis of multi-components by single
pp. 557–564, 2021. marker,” Modern Chinese Medicine, vol. 22, no. 12,
[13] P. H. Niao, L. J. Weng, S. L. Liu, and D. Geng, “Research pp. 2015–2020, 2020.
progress on chemical constituents of Euphorbia Lathylris and [29] L. Duan, Q. C. Zhu, E. Wang, and Y. C. Sun, “Determination
its phamacological activities,” Modern Chinese Medicine, of the contents of 5 components in Psoralea corylifolia by
vol. 22, no. 2, pp. 296–304, 2020. QAMS,” Northwest Pharmaceutical Journal, vol. 36, no. 01,
[14] S. S. Yang, Separation of Anticancer Compounds from the pp. 10–14, 2021.
Euphorbia Lathyris and its Pharmacological Research, Tianjin [30] Z. G. Zhao, J. H. Yao, J. N. Wang, and Y. Y. Zhai, “Imul-
University, Tianjin, China, 2016. taneous determination of the contents of 7 components in
[15] J. S. Dong, J. F. Zhao, R. T. Chen et al., “Effects of semen zhishushi lotion by QAMS,” Northwest Pharmaceutical
Euphorbiae Lathyridis on the expression of livinprotein and Journal, vol. 36, no. 01, pp. 14–19, 2021.
TNF-α in cancer tissues of nude mouse model of renal [31] B. F. Zhang, J. Wang, and H. Y. Chen, “Determination of 7
components in buxiqi oral liquid by QAMS,” Northwest
cancer,” Oncology Progress, vol. 15, no. 6, pp. 631–633, 2017.
Pharmaceutical Journal, vol. 36, no. 01, pp. 29–34, 2021.
[16] Q. Tian, Active Ingredient Analysis and Extraction Process
[32] X. M. Xu, X. Y. Wu, H. Yi et al., “Determination of 6
Optimization in Euphorbia Lathyris L, Shanxi University,
components in tibetan medicine berberis cortex with quan-
Taiyuan, China, 2015.
titative analysis of multi-components by single marker,”
[17] Y. H. Li, Y. M. Peng, Z. Q. Wang et al., “Alcohol extraction
Chinese Journal of New Drugs, vol. 29, no. 24, pp. 2852–2858,
process for feifufang granules based on the quality-by-design
2020.
concept,” Hunan Journal of Traditional Chinese Medicine,
[33] D. J. Liu, L. He, M. M. Fan, H. W. Tao, and Y. N. Mu,
vol. 37, no. 01, pp. 155–159, 2021.
“Quantitative determination of seven components in qian-
[18] M. T. Lu, J. M. Sun, and C. C. Fang, “Design and optimization
lieping capsule by HPLC-QAMS,” Practical Pharmacy And
of preparation process of paracetamol bi-release bilayer
Clinical Remedies, vol. 23, no. 12, pp. 1119–1125, 2020.
tablets based on QbD concept,” Chinese Journal of Hospital
[34] Y. H. Huang, Y. F. Yang, and Y. Chen, “Qulity control for 7
Pharmacy, vol. 40, no. 24, pp. 2535–2539, 2020.
components in bushen fangchuan tablets by QAMS,”
[19] M. T. Li, Q. Liu, Y. Q. Zhang, M. D. Ye, and W. X. Wang,
Northwest Pharmaceutical Journal, vol. 35, no. 05, pp. 653–
“Preparation and characterization of ternary indomethacin
658, 2020.
solid dispersion based on quality by design (QbD) concept,”
Chinese Pharmaceutical Journal, vol. 55, no. 17, pp. 1450–
1455, 2020.You can also read