ESTIMATION OF SUBSURFACE STRUCTURES AND GROUND MOTION CHARACTERISTICS IN THE AREAS DAMAGED IN THE 2016 CENTRAL TOTTORI PREFECTURE EARTHQUAKE IN ...
←
→
Page content transcription
If your browser does not render page correctly, please read the page content below
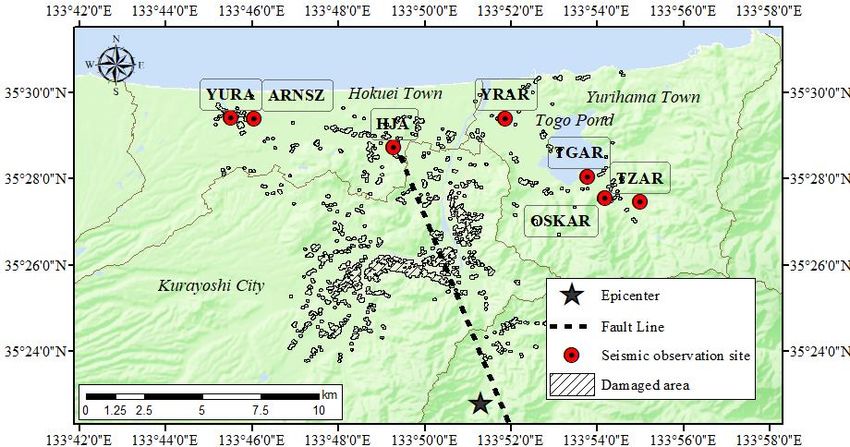
International Journal of GEOMATE, June., 2021, Vol.20, Issue 82, pp.15-21
 ISSN: 2186-2982 (P), 2186-2990 (O), Japan, DOI: https://doi.org/10.21660/2021.82.Gx185
 Geotechnique, Construction Materials and Environment

 ESTIMATION OF SUBSURFACE STRUCTURES AND GROUND
 MOTION CHARACTERISTICS IN THE AREAS DAMAGED IN THE
 2016 CENTRAL TOTTORI PREFECTURE EARTHQUAKE IN
 JAPAN

 *Isamu Nishimura1, Tatsuya Noguchi1 and Takao Kagawa1
 1
 Graduate school of Engineering, Tottori University, Japan

 *Corresponding Author, Received: 30 Nov. 2020, Revised: 10 Feb. 2021, Accepted: 23 Feb. 2021

ABSTRACT: On 21 October 2016, an earthquake with a magnitude of 6.6 (determined using the Japan
Meteorological Agency’s [JMA] seismic network) occurred in the center of Japan’s Tottori Prefecture. In the city
of Kurayoshi and in the towns of Yurihama and Hokuei, JMA seismic intensities of lower 6.0 were observed, and
structural damage to housing was concentrated in a limited number of areas. This research conducted microtremor
observations around damaged areas and used previous studies to estimate subsurface structures and ground motion
characteristics. Low-velocity layers with an S-wave velocity of between 80 and 200 m/s were estimated at all
observation sites and a tendency is present for the thickness to increase towards the coastal plains and decrease
inland. In an evaluation of the relationship between ground motion characteristics and earthquake damage,
researchers found that the occurrence of damage correlated to significant changes in layer thickness. Researchers
believed that the damage correlates to the 2-D or 3-D effects of subsurface structures.

Keywords: Microtremor observation, Seismic observation, Subsurface structure, the 2016 central Tottori
prefecture Earthquake

1. INTRODUCTION maximum slip extends from the hypocenter to the
 shallower area, while in the second, smaller slips are
 An earthquake with a magnitude of 6.6 (according located NNW of the hypocenter.
to the Japan Meteorological Agency’s [JMA] seismic A detailed understanding of the subsurface
network) occurred in central Tottori Prefecture, Japan, structure and ground motion characteristics is
on 21 October 2016. As Fig. 1 reveals, JMA seismic required to enable an evaluation of strong ground
intensities of lower 6 were recorded in the city of motions, nonlinear soil responses and the relationship
Kurayoshi and in the towns of Yurihama and Hokuei between ground motion and damage. This study
[1]. In Hokuei, the damage to housing was conducted microtremor observations around the
concentrated in the town’s flat areas, while in strong motion observation sites and the earthquake-
Yurihama, most damage occurred in the area at the affected areas and estimated the subsurface structures
mountain’s edge [2,3]. This study suggests that the and ground motion characteristics. The aftershock
damage could be attributed to site amplification due records were used to inform estimations of the deeper
to subsurface structures. ground structures.
 The earthquake’s mainshock and its subsequent
aftershocks were observed by NIED’s K-NET and 2. OBSERVATION
KiK-net strong motion seismograph networks, and at
local government observation sites in Tottori 2.1 Damage to Housing and Previous Study of The
Prefecture and at temporary sites at Tottori University. Target Area
The analysis of those strong motion records suggests
that the observed differences in site amplifications The mainshock of the 2016 earthquake caused
could be due to variations in subsurface structures. damage that was concentrated in areas within the
Furthermore, nonlinear soil responses due to strong flatlands of the town of Hokuei and around the
ground motions were suspected at the Ryuto (TGAR) mountainside in the town of Yurihama. Figure 1
and Hisadome (YRAR) observation sites in the town shows the affected areas; damage to roof tiles was
of Yurihama and at the Hashita (HJA) site in Hokuei initially determined based on blue sheet coverage
[3]. identified from satellite images [5] and was
 Data obtained from strong motion waveforms confirmed by site visits and interviews. This study
informed an estimation of the earthquake’s source deems the damaged housing area to extend to a radius
rupture process. Kubo et al. [4] show that the source
model contains two major slip regions; in the first, the

 15

International Journal of GEOMATE, June., 2021, Vol.20, Issue 82, pp.15-21

Fig.1 Epicenter and fault line [1], damaged area and seismic observation sites

of 50 m from the affected houses. array was established between 0.6 to 30 m.
 According to the previous studies [3,6], the Aftershock observations were recorded at the
predominant periods of the microtremors in OSK and TZAR sites, where major damage to roof
Yurihama and Hokuei were between about 0.5 and tiles occurred. The OSK observation site was in
2.0 s and between 0.8 and 1.5 s, respectively. This operation between 24 July 2017 and 2 July 2018,
study considers that these periods correspond to the while the TZAR site has been operating continually
thickness of soft layers with S-wave velocities below since 20 October 2015. A CV-374A sensor-integrated
400 m/s. recorder was used for the observation at a sampling
 frequency of 100 Hz. The seismometers were
2.2 Summary of Observation installed indoors on solid bases where power was
 available, such as at the entrances to buildings.
 Single-point observations were conducted mainly
in residential areas and strong motion observation 3. ANALYSIS
sites at 294 locations in the town of Yurihama and at
162 sites in the town of Hokuei. Data were recorded 3.1 Microtremor Records
using a JU410 three-component accelerometer with a
24-bit recorder at intervals of 50 m in areas of Fourier spectra were calculated from a single-
concentrated roof-tile damage. A wave amplification point observation record and were smoothed using a
factor of 100, a sampling frequency of 100 or 200 Hz, log window with a coefficient of 20 [7]. Average
and a recording time between 10–15 minutes were spectra were determined from at least 10 stable
used. sections of 20.48 s. Horizontal to vertical (H/V)
 As shown in Fig. 2, the study conducted array spectral ratios were calculated from the Fourier
observations at four strong motion observation sites spectra, and the predominant periods were visually
(YRAR, TGAR, HJA, and YURA) and three estimated. Many H/Vs were identified as unimodal
temporary aftershock observation sites (Oshikadani with a single distinct peak. In cases where multiple
[OSK], Takatsuji [TZAR], and ARNSZ). The peaks were observed in some areas, e.g. on
measurements were obtained using four JU410s mountainsides, the main areas were estimated with
synchronized by GPS clocks. One seismometer was respect to continuity with adjacent unimodal sites.
placed at the center of a circle, and the other three The entire predominant period distribution in the
were positioned around the circumference to form an prefecture of central Tottori is detailed in Fig. 2.
equilateral triangle. A 200-Hz sampling frequency To unify the velocity structure of the lowermost
was used, the amplification factor was identical to surface, an analysis of the array observations,
that of the single-point observation, and the recording including the re-analysis of past research data, was
duration was around 15 minutes. According to the conducted [3,6], in accordance with the following
observation site, to evaluate the S-wave velocity procedure: the phase velocity dispersion curves of the
structures of Quaternary sediments, the radius of the array observation records were estimated based on the

 16
International Journal of GEOMATE, June., 2021, Vol.20, Issue 82, pp.15-21

CCA method [9]. Using the open analysis tool [8], at The duration of the analysis record was extended to
least five sections were selected by automatic 20.48 s with the addition of zero data, and the Fourier
extraction using the root mean square values of spectrum was calculated and smoothed with a 0.2-Hz
microtremor recordings with 10.24-s segments. Then, bandwidth Parzen window. The H/V spectral ratio
the power spectra within those sections were (strong ground motion H/V) was evaluated based on
smoothed with a 0.3-Hz bandwidth Parzen window, the Fourier spectrum of each component. To obtain
and the average was obtained. Finally, the phase the H/V values at each site, around 10 aftershocks
velocity dispersion curves were determined, and were analyzed and averaged.
those obtained at each radius were integrated at each Models of the subsurface structure were first
observation site, with respect to their continuity. estimated by forward modeling; the model was
 Both these curves and the microtremor H/Vs adjusted by comparing the observed and theoretical
obtained from single-point microtremor recordings at H/Vs based on the diffuse wave field theory [12] of
the center of the array were used to inform the strong ground motion H/Vs. To estimate shallow
estimation of subsurface structure models from structures, the initial model employed the array
forward modeling based on the fundamental mode of observation models described above, while deep
Rayleigh waves. S-wave velocities were determined structures were assumed from previous research [6].
with reference both to previous studies [3,6] and The final structure model was estimated from an
borehole data surrounding the site [10]. Then, inversion analysis by a hybrid heuristic search
modeling was performed by modifying the method [13] with a genetic algorithm (GA) and
thicknesses of the layers. The densities were simulated annealing (SA). The damping constant, h,
established according to previous studies, and P-wave was assumed to be 0.03 for S-wave velocities of 100
velocities were established based on the S-wave m/s or less, 0.02 for velocities of 100 to 400 m/s, and
velocities [11]. The resulting subsurface structure 0.01 for those of 400 m/s or more. In this study, it was
model is presented in Table 1. used the inversion code created by Yasui et al. [14].
 The additional inversion parameters were as
3.2 Aftershock Records follows: the GA involved 10 trials, 30 samples, and
 300 generations; the crossover probability was 0.7,
 To ensure analytical consistency, the evaluation the mutation probability was 0.01, and both dynamic
of aftershock records involved the use of data from mutation and elite selections were considered. For the
both previous research [3,6] and from more recent SA, the temperature drop function was provided by
observations. The analysis followed this procedure: Eq. (1), the coefficients were a = 0.5 and c = 1.0, the
time windows of 10.24 s with cosine tapers of 5% at initial temperature was T0 = 100, and 10 temperature
both ends were applied from the arrival of the S-wave.

Fig.2 Predominant period distribution map in the prefecture of central Tottori

 17
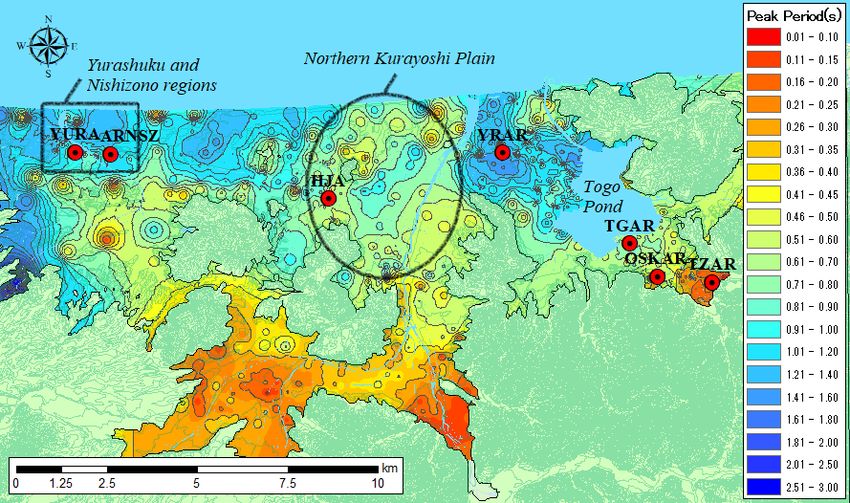
International Journal of GEOMATE, June., 2021, Vol.20, Issue 82, pp.15-21 Table 1 Subsurface structures based on array observations Yurihama Town Hokuei Town Thickness Thickness Site ρ(t/m3) Vp(m/s) Vs(m/s) Site ρ(t/m3) Vp(m/s) Vs(m/s) (m) (m) 33 1.6 1430 140 9 1.6 1380 80 YRAR 75 1.8 1730 400 5 1.7 1460 150 (Hisado HJA me) 100 2.1 2070 700 10 1.8 1510 200 (Hashita) ∞ 2.2 2620 1200 12 1.9 1730 400 9 1.6 1390 90 ∞ 2.2 2620 1200 8 1.7 1510 200 10 1.7 1430 130 TGAR 50 1.8 1730 400 ARNSZ 10 1.7 1510 200 (Ryuto) 100 2.1 2070 700 (Nishizo 70 1.8 1730 400 ∞ 2.2 2620 1200 no) 60 2.1 2070 700 8 1.6 1400 100 ∞ 2.2 2620 1200 OSKAR 3 1.7 1510 200 11 1.7 1490 180 (Oshika 30 1.8 1730 400 YURA 65 1.8 1730 400 dani) (Yura 100 2.1 2070 700 80 2.1 2070 700 shuku) ∞ 2.2 2620 1200 ∞ 2.2 2620 1200 4 1.6 1390 100 TZAR 4 1.7 1510 200 (Taka 100 2.1 2070 700 tsuji) ∞ 2.2 2620 1200 Yurihama Hokuei Fig.3 S-wave velocity structure column diagrams updates occurred. 4.1 Major Periods of The Horizontal to Vertical Spectral Ratios of Microtremors = 0 exp(− ) (1) Figure 2 shows that the predominant periods The S-wave velocity and the thicknesses of the around the YRAR site were 0.8 to 1.6 s, while around first and bottom layers were fixed, and the values of the TGAR, OSKAR, and TZAR sites, they were the other layers were searched within a range of ± between 0.4 and 0.8 s. Around the ARNSZ and 25% from the initial value. The search targets were YURA sites, the main periods were 1.0 to 1.6 s, while the velocities and layer thicknesses of the S and P those at HJA in the N Kurayoshi Plain were between waves. The densities were established using an 0.4 and 1.0 s. Many single-peak microtremor H/Vs empirical formula [15] from the S-wave velocity. were observed on the N Kurayoshi Plain and around Figure 3 contains the resulting S-wave velocity Togo Pond, and many multiple-peak H/Vs were column diagrams from the shallow to the deep layers. recorded in the regions of Nishizono and Yurashuku (Fig. 4). It is likely that this distribution reflects 4. DISCUSSIONS variations in velocity structures in the surface layers. 18
International Journal of GEOMATE, June., 2021, Vol.20, Issue 82, pp.15-21

4.2 Estimation of Subsurface Structures ARNSZ sites, which suffered widespread damage,
 ARV values of around 2.0 are evident. However, no
 Based on the borehole data from around the clear relationship is identified between structural
observation sites [9], the S-wave velocities of 100 m/s damage and ARV.
or less given in Table 1 are considered to have
occurred in clay or silt layers, while an S-wave = 1.83 − 0.66 30 (2)
velocity of 200 m/s is considered to have occurred in
a sand layer. It is evident from Table 1 that the soft Table 2 AVS30 and ARV at array sites
layer with an S-wave velocity of between 80 and 200
m/s is between 6 and 33 m thick at each site; a Yurihama YRAR TGAR OSKAR TZAR
tendency is present for the thickness to increase AVS30 140 174 220 328
towards the coastal plains and decrease inland. Silt
layers with S-wave velocities between 80 and 140 m/s ARV 2.59 2.25 1.98 1.48
in the surface layer were identified at the YRAR,
 Hokuei HJA ARNSZ YURA
TGAR, and HJA observation sites. Researchers
suggested that the nonlinear responses reported in AVS30 142 197 276
these areas were caused by dominant layers of silt. ARV 2.56 2.07 1.65
 Aftershock observation records informed the
estimation of deeper subsurface structures in this
 Surface layer thicknesses were estimated, and
study. In Fig. 3, the numbers indicate the depth from
 specific changes were examined in the areas of
the surface layer to the engineering seismic base layer.
 concentrated structural damage in the Nishizono and
The depth tends to be deeper towards the coastal plain
 Yurashuku regions. Next, the S-wave velocities and
in the subsurface structure model, which is consistent
 the predominant periods (Tp) were used to estimate
with the tendency for the predominant periods to
 the layer thicknesses (H) from Eq. (3). In both areas,
elongate towards the plains. The thicknesses of the
 a short predominant period, Tp1, and a long
deeper subsurface structures with S-wave velocities
 predominant period, Tp2, were estimated, and the
exceeding 700 m/s differ between the towns of
 layer thicknesses were estimated using the peaks from
Yurihama and Hokuei.
 Eq. (3).
 ∙
 = (3)
 4

Fig.4 Microtremor horizontal to vertical spectral
ratios at the center of the array observation sites

4.3 Consideration of Housing Damage

 At each site, the amplification was evaluated
using AVS30 and ARV ground amplification
indicators [16]. Equation (2) was used to calculate the
ARV. The average S-wave velocity at underground
depths down to 30 m is represented by the AVS30
indicator, and Table 2 presents the AVS30 and ARV
values at each site. At the YRAR and HJA sites, Fig.5 Layer thicknesses in the Nishizono and
where major structural damage was not observed, the Yurashuku regions (upper map: Tp1, lower map:
ARV value is around 2.5, while at the OSKAR and Tp2)

 19
International Journal of GEOMATE, June., 2021, Vol.20, Issue 82, pp.15-21

 It is evident from Fig. 5 that the layer thicknesses University, assisted in establishing observation sites
from Tp1 are deeper from the S to the NW and the at Oshikadani and Takatsuji as well as collecting data
layer thicknesses from Tp2 are deep in only limited and reporting local damage. The authors would like
areas. A comparison between the affected areas and to thank Enago (www.enago.jp) for the English
the layer thicknesses reveals an overlap along the language review. We appreciate to everybody who
boundary where the layer thickness of Tp2 changes. supported our study.
This intersection indicates the impacts of 2-D or 3-D
shapes on structural damage within the engineering 7. REFERENCES
seismic base.
 [1] Japan Meteorological Agency, Evaluation of the
5. CONCLUSION earthquake on October 21, 2016 in central Tottori
 Prefecture,,[Viewed
earthquake observations in the areas damaged by the on 11 June 2020].
2016 earthquake in the Japanese prefecture of central [2] Kagawa T., 2016 Central Tottori Earthquake
Tottori. The relationship between subsurface (M6.6), Earthquake Journal, No.63, 2017, pp.14-
structures, ground motion characteristics, and 22. (in Japanese)
earthquake damage was considered via estimations [3] Kagawa T., Noguchi T., Yoshida S. and
and evaluations. Consequently, the following Yamamoto S., Effect of the surface geology on
findings are noted. strong ground motions due to the 2016 Central
 A tendency is evident for H/Vs obtained from a Tottori Earthquake, Japan, Earth, Planets and
single-point microtremor observation to possess Space, 69:106 DOI 10.1186/s40623-017-0689-0,
longer predominant periods in coastal plains than in 2017.
inland areas. [4] Kubo H., Suzuki W., Aoi S. and Sekiguchi H.,
 Phase velocity dispersion curves were obtained Source rupture process of the 2016 central Tottori,
from microtremor array observation data, and they Japan, earthquake (MJMA 6.6) inferred from
were used to inform the estimates of S-wave velocity strong motion waveforms, Earth, Planets and
structures. At the YRAR, TGAR, and HJA Space 69:127 DOI 10.1186/s40623-017-0714-3,
observation sites, where nonlinear responses were 2017.
observed, the surface layers were found to contain [5] Honda Y., Mochizuki K., Shimomura H. and
low-velocity silt layers; it is highly likely that these Monma N., Automatic extraction of blue sheet-
layers are related to the nonlinear responses at the covered housing from satellite images of 2016
study locations. Central Tottori Earthquake, Japan Society for
 The aftershock observation records informed the Disaster Information Studies, Proceedings of the
estimations of deeper subsurface structures. 19th conference, 2017, pp.244-245. (in Japanese)
Consequently, variations were identified between the [6] Noguchi T., Nishikawa H., Yoshida S. and
depths of the deeper subsurface structures, with S- Kagawa T., Estimation of subsurface structure
wave velocities exceeding 700 m/s in the towns of and characteristics of ground vibration based on
Yurihama and Hokuei. microtremor and seismic observation in the
 A comparison between the observed structural central Tottori Prefecture, Japan, Journal of Japan
damage and the ground amplification indices Association for Earthquake Engineering, Vol. 19,
estimated from this study’s models was found to be Issue 6, 2019, pp 258-271. (in Japanese with
weak in relevance. However, from the layer English abstract)
thicknesses estimated from the predominant periods [7] Konno K. and Ohmachi T., A smoothing function
and the surface S-wave velocities, researchers suitable for estimation of amplification factor of
discovered that damage occurred at those sites where the surface ground from microtremor and its
the layer thickness changed dramatically. Therefore, application, Transactions of the Japan Society of
researchers suspected that the earthquake damage Civil Engineers, No525/I-33, 1995, pp247-259.
resulted from the 2-D or 3-D effects of irregular (in Japanese with English abstract)
subsurface structures. This finding will be further [8] Cho I., Tada T. and Shinozaki Y., Possibility of
explored in future research. microtremor array opened up by general theory:
 Release of analysis tool BIDO, Seismological
6. ACKNOWLEDGMENTS Society of Japan Fall Meeting in 2009. (in
 Japanese)
 This study used the code developed by Dr Yuzuru [9] Cho I., Tada T. and Shinozaki Y., Centerless
Yasui for the inversion analysis. Mr Ichihashi, a circular array method: Inferring phase velocities
member of the local government volunteer fire of Rayleigh waves in broad wavelength ranges
department, and Mr Yamamoto, a technical staff using microtremor records, J. Geophys. Res., 111,
member of the Faculty of Engineering at Tottori B09315, 2006.

 20
International Journal of GEOMATE, June., 2021, Vol.20, Issue 82, pp.15-21

[10] National Research Institute for Earth Science and [14] Yasui Y., Nishikawa H., Maeda T., Cho I.,
 DisasterResilience:GeoStation,, [Viewed on 9 October 2019]. Applicability of an inversion of earthquake H/V
[11] Kitsunezaki C., Goto N., Kobayashi Y., Ikawa, T. spectral ratios for soil structures – a case study
 Horike M., Saito T., Kurota T., Yamane K. and using records in Fukui Prefecture, JSCE Journal
 Okuzumi K., Estimation of P- and S- wave of Earthquake Engineering, Vol.70, Issue 4, 2014,
 velocities in deep soil deposits for evaluating pp.628-643. (in Japanese with English abstract)
 ground vibrations in earthquake, Natural disaster [15] Ota T., Emori K. and Kasai Y., Building
 science, 9-3, 1-17, 1990. (in Japanese with foundation earthquake resistance / vibration /
 English abstract) control, Kyoritsu Shuppan, 2001, pp-339.
[12] Kawase H. Sanchez-Seama F.J. and Matsushima [16] Midorikawa S., Matsuoka M. and Sakugawa K.,
 S., The optimal use of horizontal-to-vertiacal Site Effect of Strong- Motion Records Observed
 spectral ratios of earthquake motions for plane during the 1987-Chiba-kentoho-oki, Japan
 waves, Bull. Seism. Soc. Am. Vol.101, No.5, Earthq. Eng. Sympo, Vol.3, 1994, pp.85-90.
 2011, pp.2001-2014.
[13] Yamanaka H., Inversion of surface-wave phase Copyright © Int. J. of GEOMATE. All rights reserved,
 velocity using hybrid heuristic search method, including the making of copies unless permission is
 Geophysical Exploration, Vol. 60, Issue 3, 2007, obtained from the copyright proprietors.
 pp-265-275. (in Japanese with English abstract).

 21
You can also read