Expresso and Chips: Creating a Next Generation Microarray Experiment Management System
←
→
Page content transcription
If your browser does not render page correctly, please read the page content below
Expresso and Chips: Creating a Next Generation
                          Microarray Experiment Management System

          Allan Sioson∗ , Jonathan I. Watkinson† , Cecilia Vasquez-Robinet† , Margaret Ellis∗ ,
        Maulik Shukla∗ , Deept Kumar∗ , Naren Ramakrishnan∗ , Lenwood S. Heath∗ , Ruth Grene† ,
                        Boris I. Chevone† , Karen Kafadar] , and Layne T. Watson∗
                                    ∗
                                      Department of Computer Science
                   †
                     Department of Plant Pathology, Physiology, and Weed Science
                                         ]
                                           Department of Statistics
                               Virginia Tech, Blacksburg, VA 24061, USA

                        Abstract                                a fertile ground for computer science research in application
                                                                composition systems and dynamic data-driven application
Expresso is an experiment management system that is de-         systems (DDDAS) [4], as envisioned by the CADSS (Com-
signed to assist biologists in planning, executing, and in-     plex Application Design and Support Systems) component
terpreting microarray experiments. It serves as a unify-        of the National Science Foundation’s Next Generation Soft-
ing framework to study data-driven application composi-         ware (NGS) program.
tion systems, as envisaged under the NSF Next Generation            Our microarray experiment management system (Ex-
Software (NGS) program. Physical and analytical stages of       presso) is designed with the above considerations in mind
the microarray process are mirrored in Expresso with com-       and aims to assist biologists in planning, executing, and in-
putational models from biophysics, molecular biology, bio-      terpreting microarray experiments. From an NGS perspec-
chemistry, robotics, image processing, statistics, and knowl-   tive, Expresso is a data-driven application composition sys-
edge representation. These models are pushed deeper (ear-       tem that integrates models of varying fidelity to support,
lier) into the design process to help avoid costly design er-   inform, and optimize the microarray design and analysis
rors and to provide, as needed, surrogate functions for the     process. In this paper, we describe the motivations for Ex-
traditional stages of microarray experiments. In this paper,    presso, the architectural design of the system, and prelimi-
we describe ongoing work in the design of Expresso, with        nary results from a biological study to elucidate the drought
specific reference to application composition, application      stress response of loblolly pine trees [14]. We assume basic
optimization, experiment protocol design, and ‘closing the      knowledge of genomic analysis and bioinformatics termi-
loop.’                                                          nology (e.g., see [9, 11]).

                                                                2. Microarray Technology
1. Introduction
                                                                    Two main approaches to preparing microarrays are based
    Microarrays (sometimes referred to as DNA chips) have       on complementary DNA (cDNA) technology and oligonu-
emerged as a promising approach to studying all the genes       cleotide synthesis. In the first, DNA templates (probes) are
in a given organism simultaneously [12]; originally inspired    printed onto a high-density 2D array in a very small area
by miniaturization trends in microelectronics, they have        on a solid surface. Typically the probes are chosen to cor-
become an important technique in the bioinformatician’s         respond to all available genes that can be expressed in a
toolchest, and are constantly evolving to achieve higher        given organism. The goal then is to determine the genes
value and to fit new uses. Applications using microarrays       that are expressed when cells are exposed to experimen-
are characterized by the need to couple experimental design     tal conditions, such as drought, stress, or toxic chemicals.
with data-driven analyses, to computationally model the         To accomplish this, RNA molecules (targets) are extracted
many physical stages of the process, and to track and iden-     from the exposed cells and reverse transcribed to form com-
tify data and physical entities as they proceed through the     plementary DNA (cDNA) molecules. These molecules are
laboratory and computational pipeline. They thus constitute     then allowed to bind (hybridize) with the probes on the mi-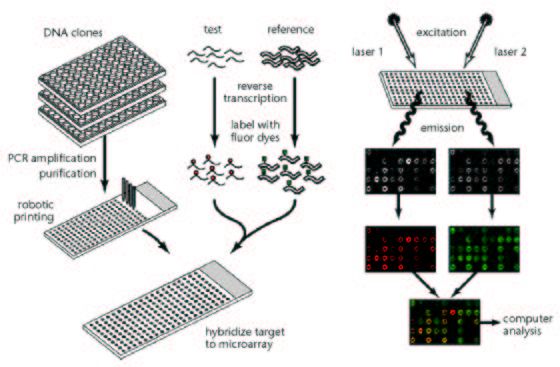
croarray, which will adhere only with the locations on the       ation and analysis. Some of these steps are specific to our
array corresponding to their DNA templates. The cDNA             current experimental process but the overall flow is indica-
target molecules are tagged with fluorescent dyes, so their      tive of almost all microarray experiments. Where appropri-
binding to probes on the glass surface can be assessed by        ate, we identify sources of error, suggesting opportunities
measuring the signal intensity using a laser. Intensity dif-     for modeling.
ferences in spots will correspond to differential expression
levels for particular genes. Using this approach, one can        Probe Generation and Microarray Design
‘measure transcripts from thousands of genes in a single af-
ternoon’ [12].                                                   Clone Library Creation
    In the oligonucleotide synthesis approach, a masking         cDNA clones (typically obtained from pools of messenger
protocol synthesizes the probes in situ directly on the ar-      RNA) are housed in plasmid vectors, suitable for replica-
ray, nucleotide by nucleotide. Oligo lengths are typically       tion within a bacterial host. Extensive use of recombinant
short (25–50 bases) which allows a higher packing den-           DNA technology facilitates the replication, after which the
sity than with cDNA microarrays. The probe set consti-           clones are extracted and archived as a plasmid cDNA li-
tuting an oligonucleotide array involves selected sequences      brary. These clones are then sequenced and annotated using
that identify particular genes. The design and manufacture       tBLASTx similarity search [1]. The plasmid DNA is then
of an oligonucleotide microarray is thus appropriate when        housed in 96-well archive plates (8 rows by 12 columns) at
a great deal of information is known about the expressed         −20◦ C. Sources of error at this stage include carryover of
sequences in the studied organism. The array fabrication         extraneous bacterial DNA into the library, missequencing,
process is also very controlled and can be configured for        and mislabeling (e.g., incorrect annotation).
high sensitivity, specificity, and repeatability. In contrast,
cDNA microarrays have to contend with nonspecific hy-            Clone Selection and Preparation
bridization, variation in number of molecules deposited per      Given a set of clones to be studied in an experiment, the
spot, and hybridization dependent on the length of the clone     material is physically transferred from the clone library to
seuqence. When using cDNA arrays, the accepted practice          working archive plates (of the same configuration). This is a
then is to contrast the amount of hybridization observed to      manual process; sources of error are typically due to faulty
that experienced under ‘control conditions.’ For this rea-       material handling.
son, two types of mRNA target molecules are obtained —
one from a control population and one from a treated pop-        Dilution Transfers
ulation — and tagged with different dyes, that fluoresce at      The next step is to amplify the genetic material into quan-
different frequencies. After hybridizing a mixture of these      tities suitable for microarray experiments. Before this is
two populations onto the array (see Fig. 1), lasers of appro-    effected, it is often important to dilute the working archive
priate frequencies are used to read the signal intensity aris-   (100ng/µL) to usable concentrations (0.1ng/µL); typically
ing from the different populations — allowing the relative       one to four dilution transfers are made. Manual pipetting
level of gene expression to be assessed.                         poses another source of material handling errors.
   The approach in Expresso is to mirror the physical and
analytical stages of microarray experiment management us-        PCR Amplification
ing computational models from biophysics, molecular bi-          Plasmid DNA is transferred into a PCR plate (8 rows by 12
ology, biochemistry, robotics, image processing, statistics,     columns), which poses its attendant errors. In vitro tech-
and knowledge representation. These models are pushed            niques (as opposed to the endogenous bacterial machin-
deeper (earlier) into the design process to help avoid costly    ery) amplify the quantity of the target cDNA. PCR stands
errors and to provide, as needed, surrogate functions for        for polymerase chain reaction and is a technique to am-
the traditional stages of microarray experiments. Our cur-       plify short stretches of DNA by specially designed ‘primers’
rent emphasis is on cDNA microarrays, though some of the         and the Taq polymerase enzyme (akin to a DNA Xerox).
models extend and apply to oligonucleotide arrays. Before        PCR errors involve amplifying portions of bacterial chro-
we motivate the usefulness of such modeling in the next          mosomes (if present) and improper portions of the plasmid.
section, it will be instructive to more carefully outline the    The amplification efficiency is also related to the reaction
sequence of steps involved in cDNA microarray prepara-           conditions such as length of primer, annealing temperature,
tion, experiment design, data gathering, and analysis (see       and number of cycles.
Fig. 1), especially with an eye towards how errors are in-
troduced and propagated. We discuss these steps under the        Cleaning Transfers
categories of (a) probe generation and microarray design,
                                                                 One to two cleaning transfers are made; this step uses vac-
(b) target preparation and hybridization, and (c) data gener-
                                                                 uum wash stations to minimize carry over.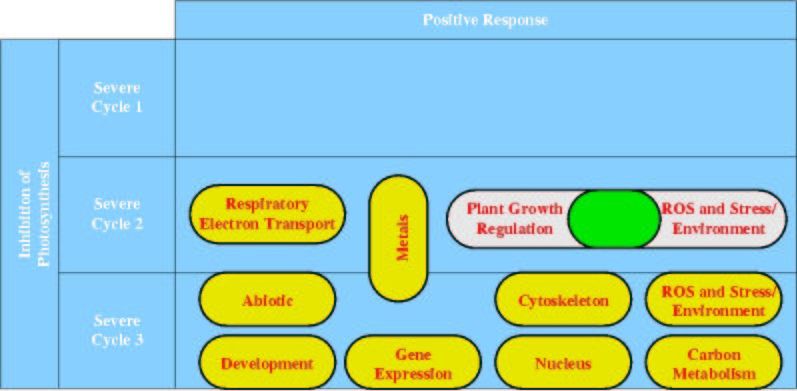
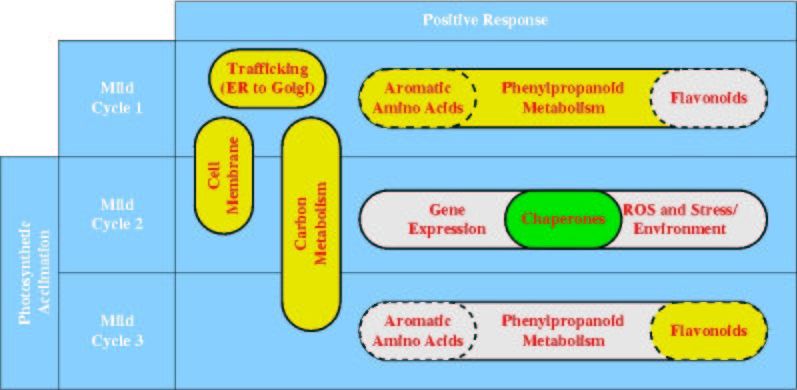
(a)                   (b)                      (c)

   Figure 1. Schematic outline of a microarray design and analysis experiment. The three main steps
   are (a) probe generation and microarray design, (b) target preparation and hybridization, and (c) data
   generation and analysis. Figure courtesy J.M. Trent (National Institutes of Health) and reproduced
   with permission of Nature Genetics.

Transfer to Printing Plates                                      maintains optimal conditions for RNA isolation (i.e., having
We now transfer the genetic material into 16 × 24 geome-         the right pH, and being ribonuclease-free). The solution is
try plates (from four of the original 8 × 12 wells); this step   extracted with chloroform and centrifuged (these two steps
involves a pipetting robot that does four rounds of 96 simul-    are repeated at least three times), in order to remove cellular
taneous transfers, providing as much as 10µL per well. An        debris, proteins, carbohydrates, and lipids. The protocols
example of a pipetting robot is the TECAN GENESIS robot          for these steps are available in [2]. We then precipitate the
that can process multiple 96-well plates simultaneously. In      RNA overnight using a high salt solution (lithium chloride)
the context of microarray experiments, the resulting print-      at a low temperature (−20◦C). After precipitation, we pellet
ing plates provide for archival storage of cDNAs that go to      the RNA with a centrifuge, rinse with an Ethanol solution,
the spotting robot (next step).                                  and resuspend in water. This typically produces 200–400
                                                                 µgrams of RNA per sample.
Transfer to Microarray
This is the last step of the array preparation process and       Validation
uses a spotting robot such as the Affymetrix 417 arrayer;        We use spectrophotometric techniques and agarose gel anal-
this robot features four pins that each takes material from      ysis to ensure good RNA quality and quantity, primarily
different wells of a source microtitre plate and deposits one    checking to see that it is intact and not degraded. In both
spot on a glass slide (typically 1nL/deposit). The geometri-     this step and the previous one, all instruments, glassware,
cal configuration is often a transfer from six 16 × 24 plates    buffers, and solutions are treated in an autoclave to be
to one 48 × 48 ‘subarray.’ In our experiments, twelve such       RNase-free.
source plates contain enough material to create a hundred
arrays (slides) with four 48x48 subarrays. In this and the       Reverse Transcription and Labeling
previous step, detailed operations of the robots are avail-      At this stage, the total RNA contains mRNA, tRNA and ri-
able in the form of a programming language unique to the         bosomal RNA. Typically only 1-2% (!) is messenger RNA,
robot.                                                           the type important for hybridization. Reverse transcrip-
                                                                 tion occurs with in vitro techniques using MMLV (Moloney
                                                                 Murine Leukemia Virus) reverse transcriptase, random hex-
Target Preparation and Hybridization
                                                                 amer primers, free deoxyribonucleotides, and amino al-
RNA Isolation                                                    lyl labeled deoxyuridine, to produce complementary DNA
The goal here is to isolate RNA from control and treated         (cDNA). The amino allyl is a side group that reacts with
plant tissues. In this step, plant tissues are ground (pow-      free amines. After reverse transcription Cy esters, which
dered) under liquid nitrogen and placed in a buffer that         couple with the reactive amino allyl group, are added to the
cDNA. The cDNAs are thus labeled with fluorescent dyes. 3. Model-Based Design and Management of
Control and treated samples are labeled with different dyes Experiments
such that each sample will fluoresce at a different wave-
length. This allows us to measure the differential level of
gene expression after hybridization. Each comparison is of- In contrast to the variety of software tools for cataloging
ten subjected to reciprocal labeling, to measure the effect of and analyzing microarray data, Expresso is designed to sup-
the dye. port modeling and control of the entire microarray exper-
imental process. Model libraries in Expresso are meant
Hybridization for application composition (creating a model of multiple
We now pool the labeled control and treated samples, dry stages from models of individual stages), application op-
them down, and resuspend in a hybridization buffer. Essen- timization (configuring a process to satisfy desired perfor-
tially this ensures that conditions are right for hybridization; mance constraints on model outputs), experiment protocol
nonlabeled RNA and DNA is used to prevent nonspecific design (e.g., running a set of virtual experiments using the
binding of target cDNA to the glass slide. The samples in incorporated models to gather performance metrics about
the hybridization buffer are applied to the arrays, covered the ultimate set of real experiments, and using these met-
with a cover slip (another glass slide), sealed in chambers, rics to refine the experimental protocol), and closing the
and placed in a waterbath at 42◦ C overnight. loop (using information from later stages to better inform
and suggest configurations for earlier stages in later exper-
Washing
iments). All of these capabilities are becoming integral as-
On the next day, arrays are washed in a series of post-
pects of bioinformatics software systems [13]; in our dis-
hybridization wash buffers to remove nonspecific hybridiza-
cussion below, we present different stages of the microarray
tions.
process that can benefit from such facilities.
Data Generation and Analysis
3.1 Application Composition and Optimization
Image Generation
The slides are now ready to be scanned for assessing gene
expression. Two lasers, one specific for each dye, excite Successful microarray system design and execution re-
the dye and the resulting fluorescence is measured using a quires mathematical modeling, and models at various levels
scanner. The images are cataloged and the two images from of fidelity are available (e.g., for material selection, PCR
a slide are superimposed for further analysis (see Fig. 1). amplification [27], spotting, hybridization [21], and image
Intensity levels from the two frequencies are processed to processing). However, due to the relative paucity of infor-
make a determination of differential gene expression (typi- mation available to drive these models and the disconnect
cally a ratio [3] or a log ratio). between model builders (who study the behavior of biolog-
ical models and understand the details of instrumentation)
Statistical Analysis and biologists (who assemble the arrays), microarray design
Due to the multitude of factors that can (and do) play a role
and management is still an imperfectly understood process.
in differential gene expression, the assessments made above
The typical approach to designing a process (experi-
must be substantiated by statistical analysis. The numerous
ment) comprised of a sequence of operations is to inde-
models available at this stage attempt to quantify measure-
pendently optimize each operation, and then modify these
ment error [22], correct for background noise [10], account
process component optimal solutions to achieve compati-
for different types of interactions [31], assess any system-
bility between consecutive components of the process. For
atic variation across different regions of the array [15] and,
example, quality control has been investigated primarily
more generally, aim to improve the robustness of gene ex-
from this perspective for the chemical synthesis of target
pression estimates. Gene replicates and control genes for
molecules and PCR amplification (in the context of the en-
capturing the contributions due to many of these effects are
tire microarray design process). The implicit belief is that
often used in microarray experiments.
the overall process design achieved in this way cannot be
Data Mining far from optimal, since each of its constituent components
Since a given microarray experiment produces the expres- is (nearly) optimal. Unfortunately, this is rarely true, and the
sion level of hundreds or thousands of genes, data mining more complex the process the more likely this component-
techniques such as clustering [6] and inductive logic pro- wise optimal design is to be far from a global optimum for
gramming [14] are employed for summarization and de- the overall process. This fundamental fact is well known,
scriptive characterization of the results. Often prior biologi- and has led to engineering design methodologies known
cal knowledge is used to reconstruct metabolic networks [5] over the years as system engineering, integrated design, and
underlying the processes that are being studied. most recently, multidisciplinary design optimization.Historically, because of the computational cost, inte- of replication. If we assume that the extension process is
grated systems design has used low fidelity, relatively cheap Markovian and occurs independently on each primer (e.g.,
models for all the components of a process or system. Af- see [27]), we can derive a mathematical expression for the
ter an approximately optimal global system design has been distribution of length of the growing strand as a function of
found, the individual components are then reoptimized us- reaction conditions (temperature, rate coefficients, number
ing expensive, high fidelity models, subject to the con- of cycles, and the activation energy for dNTP addition).
straints imposed by the overall global system design. Some- Since amplification factors in excess of a million can be
times this process fails – the accurately reoptimized process achieved, PCR is an extremely sensitive technology and the
components are found to be incompatible with the imposed process must be carefully modeled to control the kinetics
constraints – owing to the inaccuracies of the low fidelity of the reaction. For instance, Velikanov and Kapral [27]
models used in the global system design. Thus, in practice, describe how to capture aspects such as the ‘flattening’ of
integrated design becomes an iteration, alternating between the yield of the target sequence with increasing number of
global system optimization involving low fidelity models cycles and sensitivity to the initial reaction conditions. Nu-
and component optimization involving high fidelity models. merical optimization is hence necessary to determine an op-
While the stringency of design requirements for high timal schedule (cycle durations) for PCR, given factors such
throughput microarray systems is acknowledged, the use as the template length, primer length, and binding site off-
of mathematical models to optimize the experimental pro- sets.
cess (including analysis) is not widespread (and sometimes Beyond suggesting suitable duration sequences, such an
not even acknowledged). Challenging algorithmic research optimized model can actually play a larger part in Expresso,
questions include the management of models of varying fi- namely, to serve as a surrogate model for gene quantifica-
delity, the effective combination of global with local opti- tion and help validate gene expression inferred at the end
mization, and building functional approximations to sparse of the analysis pipeline (e.g., in the sense of quantitative,
data in high dimensions (surrogates for the data, so to real-time PCR [18]). Here the approach is to use the PCR
speak). The latter is especially important, since functional reaction dynamics to arrive at an estimate of the initial state
relationships, expressed mathematically, are more useful in of the system, namely the amount of nucleic acids.
many contexts than the raw data.
Our operative principle is that the cost of correcting de- 3.2 Experimental Protocol Design
sign errors is directly related to how early they occur in the
design cycle. The earlier decisions are made, the more ex- Tuning and optimizing experimental protocols is an im-
pensive they are to modify later. The goal is then clearly to portant endeavor in laboratory-based biology. Expresso’s
move high fidelity models and analysis earlier in the design design is intended to support the refinement of experimen-
cycle, or in the context of microarray experiments, deeper tal protocols by using the incorporated models to conduct
into the design. For instance, using a sophisticated titration virtual experiments and gather important performance met-
model or selecting sequences based on a molecular dynam- rics. We outline this idea in the context of the hybridization
ics energy minimization (e.g., as recently proposed by La- step.
fontaine and Lavery [17] and by Shchyolkina et al. [23]) is There are many factors that affect the performance
likely to be more effective than compensating for bad mi- of hybridization, where fluorescently labeled targets are
croarray output data, or redoing the experiment with dif- brought together with immobilized DNA probes for a
ferent sequences. The challenge is not only to move high limited time under thermally controlled conditions. A key
fidelity modeling deeper into the experimental design pro- factor is whether oligonucleotide or cDNA microarray
cess, but to judiciously combine data of varying fidelity, technology is employed [16]. Each DNA probe (oligo)
balancing accuracy requirements with computational time on an oligonucleotide microarray is manufactured to
constraints. have a specific nucleotide sequence and has a typical
length of about 25 nucleotides (e.g., in Affymetrix chips
One area that can benefit from such an approach in-
http://www.affymetrix.com/technology/design/index.affx).
volves modeling the PCR amplification of targeted DNA
On the other hand, each DNA probe (clone) on a cDNA
sequences. All ingredients necessary for DNA duplica-
microarray is an actual expressed sequence selected from
tion are placed together in a vial; different temperatures are
a library of clones and amplified via PCR. A clone is
then successively applied to first separate the DNA strands,
hundreds of nucleotides long, and typically only a portion
cool them down (so that a primer can bind), and then use a
of its sequence is known. The lengths of clones on a cDNA
polymerase enzyme to extend the primer and create a com-
microarray vary greatly, as do the lengths of expressed
plementary copy of the DNA strand. All these steps can
sequences (mRNA) among the targets.
be completed in at most two minutes; the sequence is ac-
tually then repeated multiple times to achieve high levelsFigure 2. Functional categories mined by inductive logic programming corresponding to genes exhibiting (left) positive expression in mild stress condition (characterized by photosynthetic ac- climation) and (right) positive expression in severe stress condition (characterized by inhibition of photosynthesis). Other factors affecting hybridization include probe at- perimental results. Combining models such as these can tachment method, probe purity, probe and target lengths, predict the range of results and noise that should be obtained probe and target sequences, and concentrations. Rele- from a particular microarray experiment before it is imple- vant physical characteristics of the hybridization include the mented. An examination of the predictions can reveal de- electrostatic potential and thermodynamic equilibrium [26]. ficiencies in the characteristics of the experimental design. The general phenomenon of hybridization of strands of nu- The predicted deficiencies can be used to refine the experi- cleic acids is a longstudied process in biochemistry and mental protocol computationally, and hence produce an im- related fields. The technique of subtractive hybridization, proved protocol, without the need for chemical reagents. whose purpose is to isolate and amplify sequences ex- pressed in small quantities, is more recent and has yielded 3.3 Closing the Loop some additional insights and models [8]. The phenomenon of hybridization in microarrays is different in that one of An important hallmark of Expresso is its support for the strands (the probe) is immobilized by attachment to a closing-the-loop in microarray experiments. One complete surface; this leads to other empirical and theoretical re- cycle of all the stages in a microarray experiment results sults [20]. A particular phenomenon of critical concern in both qualitative and quantitative assessments of gene for the analysis of microarray results is cross-hybridization, expression, and these results can be used to design the where a target with a sequence that is a slight mismatch to next cycle of microarray experiments. For instance, Fig. 2 the sequence of a given probe may hybridize to the probe shows the results of a data mining algorithm (inductive logic anyway [7]. programming [19]) applied to gene expression data from Of special interest in Expresso are existing empirical, loblolly pine clones exposed to two different stress levels mathematical, simulation, and statistical models of hy- (mild and severe). The purpose of this data mining step is to bridization that can be adapted to our modeling of hy- redescribe clusters of gene expression values into functional bridization in oligonucleotide or cDNA microarrays. Tu, categories (signifying gene membership). The two stress Stolovitzky, and Klein [25] have analyzed factors that in- levels studied are physiologically characterized by photo- fluence noise in the results of microarray experiments and synthetic acclimation and inhibition, respectively. Hence have obtained equations for noise distributions. Vainrub summarizing the data in terms of functional categories re- and Pettitt [26] have developed a physical model of elec- veals insight into the nature of the different pathways in- trostatic forces that explains observations on the efficiency volved. The goal now is to use these results to influence the of hybridization between immobilized and free DNA as a design of the future experiments, by configuring the probe function of probe surface density. Gadgil, et al., [8] de- set to reflect the genes of interest. velop a mathematical model for the kinetics of subtractive This probe selection problem [24] can be posed as a dis- hybridization that includes relevant factors such as strand crete optimization problem having constraints such as mini- length and hybridization temperature. Peterson, Wolf, and mizing cross-hybridization, accounting for alternative splic- Georgiadis [21] study the kinetics of hybridization with an ing sites, and increasing the specificity of results (as com- immobilized probe and suggest the use of one of two mod- pared to the previous cycle of experiments). More gener- els, one for perfectly matched sequences and a second for ally, there are conflicting objectives in terms of increasing mismatched sequences. Walton, et al., [29] apply a mathe- the coverage of the library and also deliberately introduc- matical model to the prediction of the thermodynamics and ing redundancy to account for the many experimental errors kinetics of hybridization and compare the predictions to ex- that occur in the microarray process.
Model      Bioinformatics       Analysis           Optimization   experiments using the incorporated models to obtain an in-
         Libraries     Databases           Tools              Software
                                                                            dication of the complexity of the ultimate set of real experi-
                                                                            ments. When results of the desired fidelity are achieved, the
                                         Experiment
                                          Definition
                                                                            biologist can choose to physically realize the microarray ex-
                                                MEL Description
                                                                            periment and use any collected data to improve or optimize
                                          Iterative                         any aspect of the modeling (ranging from reorganizing the
                                        System Design
                                                                            categorical assignment of clones to updating the random-
                                           Iterative
                                         Randomized
                                                                            ized layouts).
                                            Design
                                                                                One design feature of Expresso that aids in such reac-
                                                                            tive execution of compositional modeling steps is the use of
                                        Physical Layout
                                        of Microarrays                      active database elements such as triggers and rule systems.
                                                                            Triggers are already accepted in scheduling and workflow
                                      Image, Data Analysis,                 management where they perform functions ranging from
                                          Data Mining
                                                                            integrity maintenance to audit trails for system administra-
                                                Biological                  tion [30]. In Expresso, we are investigating an intermedi-
                                                 Results
                                                                            ate approach between fully automatic trigger generation and
   Figure 3. Execution and flows in Expresso.
                                                                            completely handcrafted trigger sets. The declarative spec-
   The solid lines indicate computational flows;
                                                                            ifications of MEL provide one starting point for encoding
   the dashed lines indicate physical and ma-
                                                                            triggers and can thus model strategies for closing the loop.
   terial flows. The shaded regions highlight
   opportunities for automated optimization of
   composed models, currently being pursued.                                5. Discussion and Ongoing Work
4. Software Design of Expresso
                                                                               Two cycles of preliminary microarray experiments are
   Since the Expresso design underscores the importance                     complete with Pinus taeda (loblolly pine) as our model
of modeling both physical and computational flows, it is                    plant for stress studies (see, for instance [14]). We are
important that the software architecture provide for a con-                 now in the process of populating our model library with
stantly changing scenario (in terms of data, schema, and                    many relevant codes and models (both descriptive and pre-
the nature of experiments conducted). The ability to pro-                   dictive), which will then be used for optimizing various as-
vide expressive and high performance access to objects and                  pects of the microarray process. In the coming year, we
streams (for experiment management) with minimal over-                      will adapt Expresso functionality to study systems based on
head (in terms of traditional database functionality such as                Picea abies (Norway spruce), Solanum Tuberosum (potato),
transaction processing and integrity maintenance) is thus                   and Homo Sapiens, besides loblolly pine.
paramount in Expresso [28].                                                    One of our long-term goals is to use Expresso to de-
   Fig. 3 describes the characteristics of physical and com-                sign multipurpose microarrays; current use of microarrays
putational flows in Expresso. Programs written in our in-                   is almost entirely restricted to probes and targets from the
house microarray experiment markup language (MEL) di-                       same species. By using sequences that are conserved among
rect the automatic synthesis of fragments from a model li-                  genes with identical function in different species, it may be
brary and the creation of suitable database tables. There is a              possible to construct a heterologous chip, a microarray of
one-to-one mapping between MEL’s specifications and the                     probes that hybridize to cDNAs obtained from closely re-
basic entities in the database schema. MEL supports basic                   lated species. Thus one microarray design would be capa-
validation, although in a form less restrictive to languages                ble of yielding useful information about gene expression in
like XML Schema. For instance, it does not support refer-                   numerous species. Such a multipurpose microarray would
ential integrity constraints or type derivation by extension                be ideal for studies on grass species of agronomic impor-
– features that are heavy bottlenecks for memory consump-                   tance (e.g., rice, tall fescue, Kentucky bluegrass), only some
tion and speed of access.                                                   of which have been completely sequenced. To design ar-
   One MEL description is typically employed for each in-                   rays of such broad functionality, it is imperative that model-
dividual microarray experiment. As shown in Fig. 3, multi-                  based design be employed, to predict and compare the ef-
ple iterations involving system design and randomized lay-                  fects of various sequences on different aspects of the mi-
out design (designing placement of cDNAs in microtitre                      croarray process. Such computational capabilities do not
plates, and ultimately on slides) might be required before                  exist presently; Expresso’s approach to microarray experi-
consigning the description to a physical experiment. These                  ment management promises to support such modes of in-
early stages can thus be configured to run as a set of virtual              quiry.
Acknowledgements [16] W. Kuo, T. Jenssen, A. Butte, L. Ohno-Machado, and I. Ko-
hane. Analysis of Matched mRNA measurements from Two
This work is supported by US NSF grant EIA-0103660 en- Different Microarray Technologies. Bioinformatics, Vol.
tited ‘A Microarray Experiment Management System.’ 18(3):pages 405–412, March 2002.
[17] I. Lafontaine and R. Lavery. Optimization of Nucleic Acid
References Sequences. Biophysical Journal, Vol. 79:pages 680–685,
August 2000.
[1] S. Altschul, W. Gish, W. Miller, E. Myers, and D. Lipman. [18] J. Larrick (Ed.). The PCR Technique: Quantitative PCR.
Basic Local Alignment Search Tool. Journal of Molecular Eaton Publishers, June 1997.
Biology, Vol. 215:pages 403–410, 1990. [19] S. Muggleton. Scientific Knowledge Discovery using Induc-
[2] S. Chang, J. Puryear, and J. Cairney. A Simple and Efficient tive Logic Programming. Communications of the ACM, Vol.
Method for Isolating RNA from Pine Trees. Plant Molecular 42(11):pages 42–46, November 1999.
Biology Reporter, Vol. 11:pages 113–116, 1993. [20] A. Peterson, R. Heaton, and R. Georgiadis. The Effect
[3] Y. Chen, E. Dougerty, and M. Bittner. Ratio-Based Deci- of Surface Probe Density on DNA Hybridization. Nucleic
sions and the Quantitative Analysis of cDNA Microarray Acids Research, Vol. 29(24):pages 5163–5168, Dec 2001.
Images. Journal of Biomedical Optics, Vol. 2:pages 367– [21] A. Peterson, L. Wolf, and R. Georgiadis. Hybridization of
374, 1997. Mismatched or Partially Matched DNA at Surfaces. Jour-
[4] F. Darema. Dynamic Data-Driven Application Systems. In nal of the American Chemical Society, Vol. 124(49):pages
D. Marinescu and C. Lee, editors, Process Coordination and 14601–14607, Dec 2002.
Ubiquitous Computing. CRC Press, 2002. [22] D. Rocke and B. Durbin. A Model for Measurement Er-
[5] J. DeRisi, V. Iyer, and P. Brown. Exploring the Metabolic ror for Gene Expression Arrays. Journal of Computational
and Genetic Control of Gene Expression on a Genomic Biology, Vol. 8(6):pages 557–569, 2001.
Scale. Science, Vol. 278:pages 680–686, 1997. [23] A. Shchyolkina, O. Borisova, M. Livshits, G. Pozmogova,
[6] M. Eisen, P. Spellman, P. Brown, and D. Botstein. Cluster B. Chernov, R. Klement, and T. Jovin. Parallel-Stranded
Analysis and Display of Genome-Wide Expression Patterns. DNA with Mixed AT/GC Composition: Role of Trans G-C
Proceedings of the National Academy of Sciences, USA, Vol. Base Pairs in Sequence Dependent Helical Stability. Bio-
95:pages 14863–14868, 1998. chemistry, Vol. 39:pages 10034–10044, 2000.
[7] E. Evertsz, J. Au-Young, M. Ruvolo, A. Lim, and [24] S. Tomiuk and K. Hofmann. Microarray Probe Selection
M. Reynolds. Hybridization Cross-Reactivity within Ho- Strategies. Briefings in Bioinformatics, Vol. 2(4):pages 329–
mologous Gene Families on Glass cDNA Microarrays. 340, Dec 2001.
Biotechniques, Vol. 31(5):pages 1182,1184,1186, Novem- [25] Y. Tu, G. Stolovitzky, and U. Klein. Quantitative Noise
ber 2001. Analysis for Gene Expression Microarray Experiments.
[8] C. Gadgil, A. Rink, C. Beattie, and W. Hu. A Mathematical Proceedings of the National Academy of Sciences, USA, Vol.
Model for Suppression Subtractive Hybridization. Compar- 99(22):pages 14031–14036, Oct 2002.
ative and Functional Genomics, Vol. 3(5):pages 405–422, [26] A. Vainrub and B. Pettitt. Coulomb Blockage of Hybridiza-
Oct 2002. tion in Two-Dimensional DNA Arrays. Physical Review E.,
[9] G. Gibson and S. Muse. A Primer of Genome Science. Sin- Vol. 66(4), Oct 2002.
auer Associates, Inc., Dec 2001. [27] M. Velikanov and R. Kapral. Polymerase Chain Reaction: A
[10] A. Goryachev, P. Macgregor, and A. Edwards. Unfolding of Markov Process Approach. Journal of Theoretical Biology,
Microarray Data. Journal of Computational Biology, Vol. Vol. 201:pages 239–249, 1999.
8(4):pages 443–461, 2001. [28] A. Verstak, N. Ramakrishnan, L. Watson, J. He, C. Shaf-
[11] A. Griffiths, J. Miller, D. Suzuki, R. Lewontin, and W. Gel- fer, K. Bae, J. Jiang, W. Tranter, and T. Rappaport. BSML:
bart. Introduction to Genetic Analysis. W.H. Freeman and A Binding Schema Markup Language for Data Interchange
Company, New York, 1999. in Problem Solving Environments. Scientific Programming,
[12] H. Hamadeh and C. Afshari. Gene Chips and Functional Ge- Vol. 11(1), 2003. to appear.
nomics. American Scientist, Vol. 88:pages 508–515, Nov- [29] S. Walton, G. Stephanopoulos, M. Yarmush, and C. Roth.
Dec 2000. Thermodynamic and Kinetic Characterization of Antisense
[13] L. Heath and N. Ramakrishnan. The Emerging Landscape Oligodeoxynucleotide Binding to a Structured mRNA. Bio-
of Bioinformatics Software Systems. IEEE Computer, Vol. physical Journal, Vol. 82(1):pages 366–377, Jan 2002.
35(7):pages 41–45, July 2002. [30] J. Widom and S. Ceri. Active Database Systems: Trig-
[14] L. Heath, N. Ramakrishnan, R. Sederoff, R. Whetten, gers and Rules for Advanced Database Processing. Morgan
B. Chevone, C. Struble, V. Jouenne, D. Chen, L. van Zyl, Kaufmann, 1996.
and R. Grene. Studying the Functional Genomics of Stress [31] R. Wolfinger, G. Gibson, E. Wolfinger, L. Bennett,
Responses in Loblolly Pine with the Expresso Microarray H. Hamadeh, P. Bushel, C. Afshari, and R. Paules. Assess-
Experiment Management System. Comparative and Func- ing Gene Significance from cDNA Microarray Expression
tional Genomics, Vol. 3(3):pages 226–243, June 2002. Data via Mixed Models. Journal of Computational Biology,
[15] M. Kerr, M. Martin, and G. Churchill. Analysis of Variance Vol. 8(6):pages 625–637, 2001.
for Gene Expression Microarray Data. Journal of Computa-
tional Biology, Vol. 7(6):pages 819–837, 2000.You can also read