Extreme mobility of the world's largest flying mammals creates key challenges for management and conservation - BMC Biology
←
→
Page content transcription
If your browser does not render page correctly, please read the page content below
Welbergen et al. BMC Biology      (2020) 18:101
https://doi.org/10.1186/s12915-020-00829-w

 RESEARCH ARTICLE                                                                                                                                   Open Access

Extreme mobility of the world’s largest
flying mammals creates key challenges for
management and conservation
Justin A. Welbergen1* , Jessica Meade1, Hume E. Field2,3,4, Daniel Edson2,5, Lee McMichael2,4, Luke P. Shoo6,
Jenny Praszczalek7, Craig Smith2 and John M. Martin7,8

  Abstract
  Background: Effective conservation management of highly mobile species depends upon detailed knowledge of
  movements of individuals across their range; yet, data are rarely available at appropriate spatiotemporal scales.
  Flying-foxes (Pteropus spp.) are large bats that forage by night on floral resources and rest by day in arboreal roosts
  that may contain colonies of many thousands of individuals. They are the largest mammals capable of powered
  flight, and are highly mobile, which makes them key seed and pollen dispersers in forest ecosystems. However,
  their mobility also facilitates transmission of zoonotic diseases and brings them in conflict with humans, and so
  they require a precarious balancing of conservation and management concerns throughout their Old World range.
  Here, we analyze the Australia-wide movements of 201 satellite-tracked individuals, providing unprecedented detail
  on the inter-roost movements of three flying-fox species: Pteropus alecto, P. poliocephalus, and P. scapulatus across
  jurisdictions over up to 5 years.
  Results: Individuals were estimated to travel long distances annually among a network of 755 roosts (P. alecto,
  1427–1887 km; P. poliocephalus, 2268–2564 km; and P. scapulatus, 3782–6073 km), but with little uniformity among
  their directions of travel. This indicates that flying-fox populations are composed of extremely mobile individuals
  that move nomadically and at species-specific rates. Individuals of all three species exhibited very low fidelity to
  roosts locally, resulting in very high estimated daily colony turnover rates (P. alecto, 11.9 ± 1.3%; P. poliocephalus,
  17.5 ± 1.3%; and P. scapulatus, 36.4 ± 6.5%). This indicates that flying-fox roosts form nodes in a vast continental
  network of highly dynamic “staging posts” through which extremely mobile individuals travel far and wide across
  their species ranges.
  (Continued on next page)

* Correspondence: J.Welbergen@westernsydney.edu.au
1
 Hawkesbury Institute for the Environment, Western Sydney University,
Richmond, NSW 2753, Australia
Full list of author information is available at the end of the article

                                        © The Author(s). 2020 Open Access This article is licensed under a Creative Commons Attribution 4.0 International License,
                                        which permits use, sharing, adaptation, distribution and reproduction in any medium or format, as long as you give
                                        appropriate credit to the original author(s) and the source, provide a link to the Creative Commons licence, and indicate if
                                        changes were made. The images or other third party material in this article are included in the article's Creative Commons
                                        licence, unless indicated otherwise in a credit line to the material. If material is not included in the article's Creative Commons
                                        licence and your intended use is not permitted by statutory regulation or exceeds the permitted use, you will need to obtain
                                        permission directly from the copyright holder. To view a copy of this licence, visit http://creativecommons.org/licenses/by/4.0/.
                                        The Creative Commons Public Domain Dedication waiver (http://creativecommons.org/publicdomain/zero/1.0/) applies to the
                                        data made available in this article, unless otherwise stated in a credit line to the data.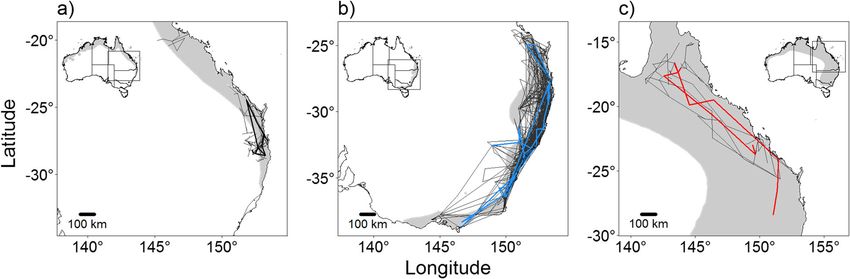
Welbergen et al. BMC Biology      (2020) 18:101                                                                 Page 2 of 13

 (Continued from previous page)
 Conclusions: The extreme inter-roost mobility reported here demonstrates the extent of the ecological linkages
 that nomadic flying-foxes provide across Australia’s contemporary fragmented landscape, with profound
 implications for the ecosystem services and zoonotic dynamics of flying-fox populations. In addition, the extreme
 mobility means that impacts from local management actions can readily reverberate across jurisdictions throughout
 the species ranges; therefore, local management actions need to be assessed with reference to actions elsewhere
 and hence require national coordination. These findings underscore the need for sound understanding of animal
 movement dynamics to support evidence-based, transboundary conservation and management policy, tailored to
 the unique movement ecologies of species.
 Keywords: Bats, Ecosystem services, Human-wildlife conflict, Movement ecology, Nomadic, Zoonosis

Background                                                     for the other large pteropodids elsewhere (e.g., [15–22]),
Conventional conservation approaches, which typically          movement studies of Australian flying-foxes are limited
view species as organized around discrete local popula-        to small samples of radio- [23, 27–29] and satellite-
tions, are inadequate for highly mobile species [1], par-      tracked [21, 25, 26] individuals, so the extent and sea-
ticularly in the context of environmental change [2].          sonal dynamics of movements among roosts have never
Highly mobile species often require multiple habitats to       been formally assessed, hampering effective conservation
obtain different resources at different stages of their life   and management of these ecologically important species.
cycles, and their persistence depends on the availability         The mobility of flying-foxes is thought to enable them
and accessibility of the requisite suite of habitats [3, 4].   to exploit Australia’s ephemeral floral resources [30] and
The unpredictable movements of nomadic species make            makes them key long-distance pollen and seed dispersers
it particularly difficult to decide where and how to act to    [31–33]. Long-distance seed and pollen dispersal by all
mitigate threatening processes [5]. This can be further        four Australian mainland Pteropus species (Pteropus
complicated when such species cross jurisdictional             alecto, P. poliocephalus, P. scapulatus, and P. conspicilla-
boundaries within or between countries [6], making a           tus) would be of crucial conservation significance as it
unified program of conservation management much                promotes gene flow between impoverished forest
more difficult to achieve. For effective conservation          patches and facilitates range shifts of forage trees under
management, it is essential to have a robust understand-       climate change [34, 35]. Knowledge on the extent and
ing of the movement ecology of highly mobile species,          seasonal dynamics of movements among roosts is thus
but this can only be accomplished by following numer-          key for understanding the linkages that flying-foxes pro-
ous individuals within a population, across multiple hab-      vide in Australia’s contemporary fragmented landscape.
itats within the species’ range [7, 8].                           The mobility of flying-foxes is also thought to under-
   Australian flying-foxes (Pteropus spp.) are large bats      pin their role in the ecology of several emerging infec-
that forage by night on floral resources and rest by day       tious diseases. In Australia, flying-foxes are the
in arboreal roosts that may contain colonies of many           recognized natural hosts for various viral agents that
thousands of individuals [9] with a complex social archi-      threaten livestock and/or human health, including Aus-
tecture [10, 11]. Roost locations can be stable for de-        tralian bat lyssavirus (ABLV) [36], Hendra virus [37, 38],
cades [12], and while “traditional” sites are mostly           and Menangle virus [39]. The maintenance of infection
occupied seasonally, more recent, urban roosts are occu-       in natural host populations depends on a source of in-
pied permanently [13], albeit with great seasonal vari-        fection, a continuous supply of susceptible individuals,
ation in local numbers [14]. The prevailing assumption         and adequate contact between infected and susceptible
is that flying-foxes are organized around local “resident”     individuals. Thus, the extent and seasonal dynamics of
populations that show (seasonal) fidelity to a particular      flying-fox movements are expected to shape infection
site [13]. However, like other large pteropodids else-         and transmission dynamics at the roost and metapopula-
where (e.g., [15–22]), Australian flying-fox individuals       tion level; further, they define the spatiotemporal scales
can be highly mobile, with movements ranging from              of exposure and infection potential for susceptible live-
small relocations within roosts and foraging sites [10] to     stock species and humans [40].
nightly foraging trips of up to 80 km [23, 24] and long-          The mobility of flying-foxes further puts them in fre-
distance movements of several thousand kilometers [25,         quent conflict with humans. Over the last 20 years, Aus-
26]. Therefore, how flying-fox populations are locally or-     tralian flying-foxes have increasingly exploited urban
ganized is critically dependent on the extent and sea-         foraging and roosting resources [23, 41, 42]. Many urban
sonal dynamics of movements among roosts. To date, as          areas in eastern Australia now have permanent flying-
Welbergen et al. BMC Biology (2020) 18:101 Page 3 of 13
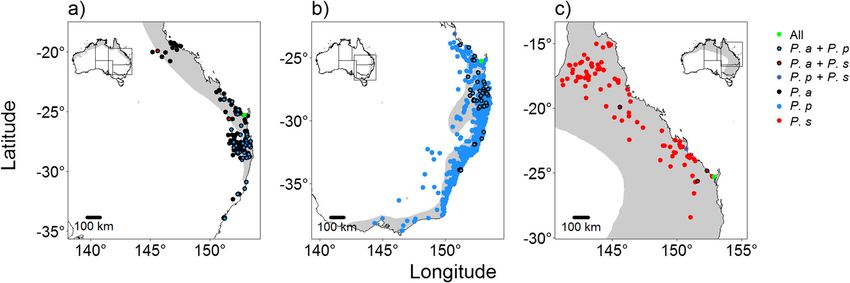
fox colonies [13], and this increased urban presence were previously unrecorded. Of these new sites, 123
translates to increased interaction with humans, and can (26%) were used by multiple tracked individuals and we
provoke negative community sentiment due to objec- thus considered them to accommodate previously un-
tionable noise, soiling and smell, and impacts on human identified flying-fox “colonies” (see the “Methods” sec-
health [43–45]. The result is often public demands to tion). Roost sites spanned a north-south distance of
local councils and elected members of state and federal 2698 km (23.7 degrees of latitude) and an east-west dis-
electorates for aggressive management of urban flying- tance of 1099 km. P. alecto was identified roosting at 173
fox populations, ranging from roost vegetation modifica- sites, P. poliocephalus at 546 sites, and P. scapulatus at
tion to colony dispersal. Dispersals in particular are 89 sites. One roost site (Hervey Bay Botanic Gardens)
predicated on the notion that resident individuals can was used by tracked individuals of all three species; 47
learn to avoid locations where they are not wanted; how- roost sites were used by only P. alecto and P. poliocepha-
ever, if colonies are in fact composed of highly mobile lus, one roost site was used by only P. poliocephalus and
individuals that turnover at high rates, this could explain P. scapulatus, and three roost sites were used by only
why dispersal actions are commonly met with very lim- P. alecto and P. scapulatus (Fig. 1).
ited success [46].
In summary, despite their key importance for Austra- Jurisdictions
lia’s fragmented forest ecosystems, flying-foxes are con- Tracked flying-foxes roosted in a total of 101 local gov-
tentious in terms of zoonosis and human-wildlife ernment areas (LGAs; also known as “councils”) within
conflict and so require a precarious balancing of conser- 131 state electorates and 74 federal electorates. P. alecto
vation, animal welfare, and human health and amenity individuals roosted in a total of 36 LGAs (average 12.2
concerns. However, the conservation and management year−1, range 1–9) within 57 (average 13.2 year−1, range
of flying-foxes is complicated by their trans- 1–9) state electorates and 33 (average 12.0 year−1, range
jurisdictional distributions and by conventional notions 1–8) federal electorates; P. poliocephalus individuals
that they are organized around discrete local populations roosted in a total of 85 LGAs (average 8.1 year−1, range
(colonies). A comprehensive understanding of the extent 1–37) within 109 (average 8.2 year−1, range 1–32) state
and seasonal dynamics of flying-fox movements is thus electorates and 68 (average 6.7 year−1, range 1–24) fed-
vital for effective trans-jurisdictional conservation and eral electorates; P. scapulatus individuals roosted in a
management of the species. total of 21 LGAs (average 23.8 year−1, range 1–9) within
In this study, we capitalize on recent advances in satel- 16 (average 21.1 year−1, range 1–9) state electorates and
lite tracking technology to investigate the broad-scale 6 (average 16.2 year−1, range 1–4) federal electorates
inter-roost movement patterns of an unprecedented 201 (Fig. 2).
flying-foxes in eastern Australia. We describe in detail the
nature of the continental-scale movements of P. alecto, P. Movements among roost sites
poliocephalus, and P. scapulatus and the differences be- There was a significant difference in site fidelity (i.e., the
tween these species in terms of local site fidelity and the inverse of the probability of moving between roosts) be-
spatiotemporal extents of their movements among roosts tween the three species (P. alecto vs. P. poliocephalus:
and local jurisdictions. We discuss the implications of our p = 0.002; P. alecto vs. P. scapulatus: p < 0.001; P. polioce-
findings for the ecosystem services and zoonotic dynamics phalus vs. P. scapulatus: p < 0.001), with the best fitting
of flying-fox populations and for current practices in model including the additive effect of species and days
flying-fox conservation and management. since last daytime fix (Additional file 6: Table S2). P. sca-
pulatus had the highest daily propensity (and thus the
Results lowest daily site fidelity) for moving between roost sites
A total of 201 transmitters was deployed on 80 P. alecto, (0.364 ± 0.065 SE), followed by P. poliocephalus (0.175 ±
109 P. poliocephalus, and 12 P. scapulatus, and tagged 0.013) and P. alecto (0.119 ± 0.013) (Fig. 3).
individuals were tracked over a maximum period of 60
months (Additional file 1: Table S1; see Additional file 2: Distances moved between roost sites
Video S1 for the animated movements of all 201 tracked The mean estimated distance moved between roost sites
individuals, and for each species separately (Add- was greatest for P. scapulatus at 13.57 ± 1.79 km day−1
itional file 3: Video S2, Additional file 4: Video S3, Add- SE (range 0–162 km day−1), followed by 4.26 ± 0.14 km
itional file 5: Video S4)). day−1 for P. poliocephalus (range 0–270 km day−1), and
1.68 ± 0.14 km day−1 for P. alecto (range 0–92 km day−1)
Roost sites (Additional file 7: Fig. S1), suggesting that the species
Following release from eight colonies, tracked flying- travel 4956, 1554, and 612 km on average among roost
foxes used a total of 755 roost sites, of which 458 (61%) sites annually, respectively.Welbergen et al. BMC Biology (2020) 18:101 Page 4 of 13 Fig. 1 Daytime roost sites used by satellite-tracked individuals. a Pteropus alecto. b P. poliocephalus. c P. scapulatus. Dots are colored to indicate which species of tracked animal used the roost sites. See legend for more details. Insets: Maps with shaded areas indicating the IUCN species range in Australia; lines indicate state boundaries Nevertheless, some individuals are clearly capable of P. poliocephalus individual (#114111) covered 13.78 degrees traveling much greater annual distances among roosts. For of latitude between 182 roosts (within 25 LGAs, 24 state example (representing the maximum distances traveled by electorates, and 17 federal electorates) across 2093 tracking each species), P. alecto (#112209) covered 1551 km be- days (Fig. 4b); and one P. scapulatus individual (#112212) tween 38 roosts (within 2 LGAs, 2 state electorates, and 2 covered 11.77 degrees of latitude between 36 roosts (within federal electorates) across 289 tracking days (5.36 km 9 LGAs, 9 state electorates, and 4 federal electorates) across day−1, and could be scaled up to 1959 km year−1); P. polio- 197 tracking days (Fig. 4c). cephalus (#114099) covered 12,337 km between 123 roosts (within 37 LGAs, 30 state electorates, and 21 federal elec- Directional movements torates) across 1629 tracking days (7.57 km day−1; 2764 km Evidence of concerted directional movements of animals year−1); and P. scapulatus (#112212) covered 3255 km be- of each species was mixed. When monthly directional tween 36 roosts (within 9 LGAs, 9 state electorates, and 4 movements among roosts were examined within species, federal electorates) across 194 tracking days (16.78 km we found that P. alecto individuals were significantly ori- day−1, and could be scaled up to 6124 km year−1). ented (in a single direction) in 1 of 10 months; P. polio- In reality, flying-foxes likely traveled much greater dis- cephalus were significantly oriented in 19 of 41 months, tances between roosts than the straight-line distances in- with a single preferred direction occurring in 9 of those ferred from tracking data suggest, because fixes were months. P. scapulatus were significantly oriented (in a only obtained once every 3–10 days and any roosts visited single direction) in both of the months where the sample on these “off days” were missed. To account for such size exceeded 5 (Additional file 9: Fig. S3). missed intervening roost visits, we modeled the expected Despite the lack of uniformity of monthly inter-roost daily distances moved between roost sites by taking ad- movement directions (see above), P. poliocephalus exhib- vantage of the variation in the time elapsed between fixes ited a significant seasonal north-south signal in their (see the “Methods” section). From this, we derived daily movements overall (dev = 47.1; df = 12, P < 0.001). No inter-roost movement distances of 13.50 ± 3.138 km (x ± significant seasonal movement was detected for P. alecto 95% CI) for P. scapulatus (= 311–499 km/month; 3782– (dev = 0; df = 0, P = 1). As data for P. scapulatus were 6073 km year−1), 6.62 ± 0.405 km day−1 for P. poliocepha- limited to a single year, no test for seasonality could be lus (= 186–211 km/month; 2268–2564 km year−1), and performed; however, like P. poliocephalus, P. scapulatus 4.54 ± 0.630 km day−1 for P. alecto (= 117–155 km/month; tended to spend more time further north on average in 1427–1887 km year−1) (Additional file 8: Fig. S2). winter than in summer (Additional file 10: Fig. S4). While much of the travel distances represent movements among nearby roosts, some individuals covered extensive Discussion latitudinal distances, (repeatedly) traversing substantial pro- Fundamentally, movement creates challenges for the portions of their entire species range. For example, one P. conservation and management of species, in part be- alecto individual (#117723) covered 4.13 degrees of latitude cause animal movements may transcend the jurisdic- between 23 roosts (within 8 LGAs, 6 state electorates, and tional boundaries of single agencies or countries [47, 7 federal electorates) across 260 tracking days (Fig. 4a); one 48]. The extreme mobility of flying-foxes vividly
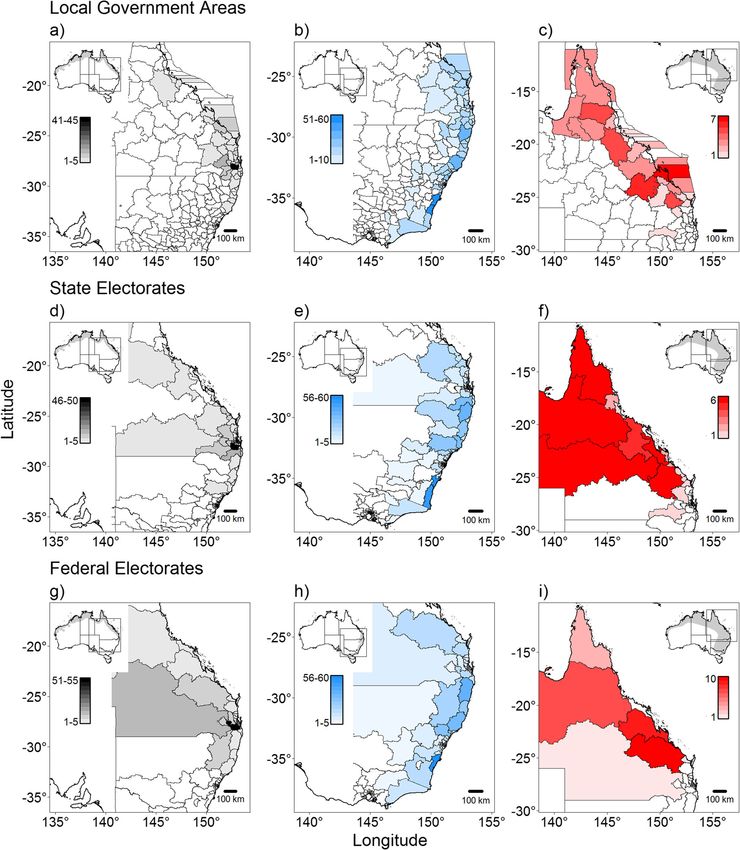
Welbergen et al. BMC Biology       (2020) 18:101                                                                                          Page 5 of 13

 Fig. 2 The numbers of satellite-tracked individuals found within Australian jurisdictions. a–c Local government areas. d–f State electorates. g–i
 Federal electorates. Colors denote species: black: Pteropus alecto; blue: P. poliocephalus; red: P. scapulatus. Insets: Maps with shaded areas
 indicating the IUCN species range in Australia; lines indicate state boundaries

illustrates these challenges and highlights the need for                     mitigation [49]. Further, we identified a clear spatio-
a sound understanding of the mechanisms underpin-                            temporal component of movement, roost occupancy
ning movement dynamics to support evidence-based                             and by extension, resource utilization, requiring con-
wildlife management policy and infectious disease risk                       servation management and potential disease risk
Welbergen et al. BMC Biology          (2020) 18:101                                                                                           Page 6 of 13

                                                                                frequent inter-roost movements at a regional level as
                                                                                well as longer-range, and at times seasonal, movements.
                                                                                The annual inter-roost distances reported in our study
                                                                                rank all three Pteropus among the most mobile mam-
                                                                                mals on earth, above large-bodied ungulates and most
                                                                                cetaceans, and in the same range as migratory birds [50],
                                                                                despite our results necessarily underestimating flying-fox
                                                                                movement distances.
                                                                                  Our findings further show that the three Pteropus spe-
                                                                                cies are composed of highly dynamic populations of in-
                                                                                dividuals moving among roosts in different directions, at
                                                                                different rates (see Electronic SI 1–4). This extreme
                                                                                inter-roost mobility is consistent with genetic work that
                                                                                shows that the species are panmictic across their ranges
                                                                                [51, 52], and has important implications for the ecosys-
                                                                                tem services and zoonotic dynamics of flying-fox popu-
                                                                                lations and for current management practices in flying-
                                                                                fox conservation and human-wildlife conflict mitigation.
 Fig. 3 The probability that an individual changes roost location after
 1 day (± 1 SE) for each species (this provides an estimate of the
 average daily colony turnover rate for each species, assuming the              Implications for the role of flying-foxes in Australia’s
 behavior of tracked individuals was representative of that of all              fragmented landscape
 individuals within the species). There was a significant difference in         Flying-foxes are thought to be pivotal to forest ecosys-
 the probability that an individual changed roost location after 1 day          tems as pollinators and seed dispersers [31, 53], provid-
 between the species (P. alecto vs. P. poliocephalus: p = 0.002; P. alecto
                                                                                ing linkages between habitat fragments across
 vs. P. scapulatus: p < 0.001; P. poliocephalus vs. P. scapulatus: p < 0.001)
                                                                                anthropogenic [32] and natural barriers [21, 54].
                                                                                Australia has lost approximately 38% of native forests
mitigation to be tailored to the unique movement                                since European settlement [33], and the number and
ecology of each species.                                                        geographic span of roosts identified in this study, to-
  The scale and scope of our study provides unprece-                            gether with the scale of movement among them, graph-
dented detail on the mobility of P. alecto, P. poliocepha-                      ically illustrates the extent of the linkages that flying-
lus, and P. scapulatus in eastern Australia over more                           foxes provide in Australia’s contemporary fragmented
than 23 degrees of latitude and up to 5 years. These                            landscape.
findings extend those of previous, smaller studies [21,                           In Australia, the spatiotemporal distribution of re-
25, 26] by demonstrating that flying-foxes undertake                            sources is often unpredictable and animals must either

 Fig. 4 Straight-line connections between successive roost fixes of satellite-tracked individuals. a Pteropus alecto. b P. poliocephalus. c P. scapulatus.
 Paths highlighted by thick lines indicate the tracks of the single individual of each species covering the greatest latitudinal range: black Pteropus
 alecto individual (#117723), tracked for 7 months from 25 June 2013 to 12 March 2014; blue P. poliocephalus individual (#114111), tracked for 21
 months from 11 May 2012 to 12 November 2014; and red P. scapulatus individual (#112212), tracked for 6.5 months from 03 May 2012 to 16
 November 2012. Insets: Maps with shaded areas indicating the IUCN species range in Australia; lines indicate state boundaries
Welbergen et al. BMC Biology (2020) 18:101 Page 7 of 13
be generalists and survive scarcity without relocating or alecto [65] suggests the likelihood of higher Hendra
be highly mobile and track resource availability across virus risk roosts further south in coming years.
large spatial scales [30]. Our finding of no (P. alecto) or Roost fidelity of P. alecto was relatively higher com-
weakly (P. poliocephalus and P. scapulatus) concerted pared to the other species, which initially appears incon-
monthly movement directions suggests that at least at sistent with its Hendra virus reservoir role; however, P.
these large spatial scales flying-foxes do not track re- alecto colonies were still expected to turnover at ap-
sources using environmental cues or memory; rather, in- proximately 12% per day (Fig. 3), providing enormous
dividuals appear to move in a quasi-random, or Lévy potential for transmission between roosts. Thus, the po-
flight-like fashion, which is thought to be optimal for tential for infection to disseminate across the geographic
searching sparsely and randomly distributed targets in range of the species is clear and underscored by the geo-
the absence of memory [55]. In this view, individuals graphic occurrence of equine cases [58].
wander freely across the species range but slowdown in
more attractive or “sticky” areas where foraging re- Implications for conservation management
sources are temporarily plentiful. Here, they combine We found that roosting at unknown sites was common
with other individuals that encounter the resources from (458 out of a total of 755 sites used), and we identified
elsewhere, and when local resources are depleted, indi- 123 previously unknown sites that hosted multiple
viduals again diffuse nomadically across the range. While tracked individuals (and so were classified as “colonies”
largely speculative at this stage, this scenario could ac- by our definition). Currently, changes in the abundance
count for the local build-up of individuals during mass and distribution of P. alecto, P. poliocephalus, and P. sca-
flowering events [56] and for the recent increase in the pulatus are estimated through Australia’s National
stability of urban roosts [41], phenomena for which the Flying-Fox Monitoring Program [66], and roosting away
mechanisms are currently unexplained (but see, [57]). from known roosts is identified as the major contributor
to uncertainty around flying-fox population trend esti-
mates [67, 68]. We suggest that the accuracy of the
Implications for infection and transmission dynamics of monitoring could thus be substantially improved by the
zoonotic agents annual inclusion of tracked individuals to help reveal
The differential movement behavior among species is previously unidentified roosts.
important for better understanding Hendra virus infec- Our findings have particular relevance for the conser-
tion and transmission dynamics, and spillover risk. Hen- vation management of P. poliocephalus as this species
dra virus, associated with around 100 fatal equine cases used 30% of new roosts and 70% of all roosts. P. polioce-
[58] and four fatal human cases in QLD and NSW, ap- phalus is classified as “vulnerable to extinction” in The
pears to be primarily excreted by P. alecto and P. conspi- Action Plan for Australian Bats [69] and listed as “vul-
cillatus [59–62]. Virus excretion has not been detected nerable” on the IUCN Red List of Threatened Species.
in P. poliocephalus or P. scapulatus to date, although Threats include loss of foraging habitat [70], extreme
anti-Hendra virus antibodies have been reported in both temperature events [71], and human persecution [41].
species [62, 63]. One explanation for this is that infec- None of these threats have abated and have recently
tion is not maintained in P. poliocephalus or P. scapula- been compounded by the unprecedented bush fires dur-
tus, but that they are periodically exposed to the virus. ing 2019–2020 that burnt an estimated 5.8 Mha of tem-
Urine is the primary route of Hendra virus excretion in perate broadleaf forest within P. poliocephalus’ range
P. alecto [43, 64], and co-roosting P. poliocephalus or P. [72]. It is clear from the vast spatial extent of inter-roost
scapulatus will have repeated exposure to P. alecto movements reported here (e.g., Fig. 4b) that successful
urine. Thus, our findings of extensive movements by P. conservation management of P. poliocephalus (and other
poliocephalus and P. scapulatus and the co-roosting of flying-foxes) must be enacted across the entire species
both with P. alecto suggest a mechanism for interspecies range.
viral exposure. Further, given the lack of evident Hen-
dra virus excretion in P. poliocephalus and P. scapulatus, Implications for human-wildlife conflict mitigation
our findings illustrate the potential for high risk roosts Our findings show that a flying-fox colony comprises a
(in terms of virus excretion and equine exposure risk) highly fluid subset of highly nomadic individuals from
where P. alecto are present and low risk roosts where across the species range, and the size of a colony at any
only P. scapulatus or P. poliocephalus are present (Fig. 1). given time would thus reflect the net outcome of oppos-
However, such roost risk profiles are not static and are ing influx and outflux of such mobile individuals. This
likely determined by roost species composition and contrasts with the conventional portrayal of a roost as
modulated by geographic location or latitudinal factors. being inhabited by flying-foxes with a “strong fidelity” to
Indeed, the reported southern range expansion of P. a roost, and our findings require a reappraisal of theWelbergen et al. BMC Biology (2020) 18:101 Page 8 of 13 concept of a “local population” in a “single locality” that Conclusions is used, for example, in the assessment of impacts of Our work shows that a flying-fox roost forms a “node” management actions on the species [73]. in a network of “staging posts” through which highly no- Flying-fox roost management actions range from roost madic individuals travel far and wide across their species vegetation modification to colony dispersal [74, 75], but range, which has profound implications for the ecosys- these actions often inadvertently exacerbate the human- tem services and zoonotic dynamics of flying-fox popu- wildlife conflict they aim to resolve [46]. “Dispersal” ac- lations. In addition, the extreme inter-roost mobility tions implicitly assume that the individuals that are reported here also means that impacts from local man- present at the time of active management are those that agement actions can readily reverberate across jurisdic- are “dispersed.” However, our results indicate that lo- tions; hence, local management actions should be cally, individuals in fact turnover at extremely high rates formally assessed in light of the impacts of actions (Fig. 3). This explains why repeat “maintenance dis- undertaken elsewhere, urgently necessitating more holis- persals” are required in the majority of actions [76] be- tic coordination at the national scale. As such, our study cause naïve individuals continue to arrive at a site provides a warning of how management at inappropriate without knowledge of previous dispersal activities. Fur- scales can potentially have unforeseen widespread conse- ther, flying-foxes tend to arrive at a roost around dawn quences for population processes and ecological func- and are extremely reluctant to cover great distances dur- tioning in mobile species. ing daylight hours possibly due to increased risk of pre- dation [77] and thermophysiological limitations [78]; Methods therefore, they have no choice but to attempt to roost in Capture and transmitter deployment the nearest available site where they provide a “seed” We deployed transmitters at eight roosts in the Austra- around which a new “splinter colony” can form. This lian states of Queensland (QLD) and New South Wales can explain the local proliferation of human-wildlife (NSW) between January 2012 and May 2015, as a com- conflict that is commonly observed following dispersal ponent of three discrete studies. In QLD, we caught and actions [76]. It is thus essential that the extreme mobility released in situ flying-foxes at Boonah (− 28.0° S,152.7° of flying-foxes and the highly dynamic nature of their E; n = 56 P. alecto), Charters Towers (− 20.1° S, 146.3° E; colonies now become integral components of the local n = 4 P. alecto), Duaringa (− 23.7° S, 149.7° E; n = 4 P. management of the species. scapulatus), Gayndah (− 25.6° S, 151.7° E; n = 4 P. alecto, In Australia, flying-fox management actions are cur- 8 P. scapulatus), Loders Creek (− 28.0° S, 153.4° E; n = 4 rently implemented locally at the level of councils P. alecto), Parkinson (− 27.6° S, 153.0° E; n = 10 P. polio- without adequate coordination at both state and fed- cephalus) and Toowoomba (− 27.6° S, 151.9° E; n = 10 P. eral levels. Yet, the extreme mobility of tracked alecto), and in NSW at the Royal Botanic Garden, Syd- flying-foxes among the large number of councils (101; ney (− 33.9° S, 151.2° E; n = 2 P. alecto, 100 P. Fig. 2) clearly indicates that local management actions poliocephalus). are likely to affect, and complicate, the management We caught flying-foxes returning to roost pre-dawn of flying-foxes by councils elsewhere. Furthermore, using mist-nets (12–18 m wide and 2.4–4.8 m deep) councils often enact dispersals in response to top- hoisted between two 15–20 m masts situated adjacent to down pressure from members from state and federal the target roost. We continuously attended nets and im- electorates. Yet, the extreme mobility of tracked mediately lowered them when a bat became entangled. flying-foxes among the large number of state (131) The bat was physically restrained and placed in an indi- and federal electorates (74) (Fig. 2) clearly indicates vidual cotton bag [79]. that such pressure can have negative implications for The criteria for recruitment for transmitter deploy- flying-fox management across other jurisdictions and ment were health (no evident injury or illness) and body so is not without political cost. Moreover, current mass (> 550 g for P. alecto and P. poliocephalus; > 350 g lack of coordinated state and federal oversight means for P. scapulatus). The accepted proportion of body- that management actions can be implemented locally weight of the device is 5% or less [80], and we aimed to by councils without reference to the impacts on the minimize the proportion of bodyweight where possible. species from management actions elsewhere. Yet, in In NSW, deployment was limited to P. poliocephalus in- the case of vulnerable P. poliocephalus, tracked indi- dividuals ≥ 650 g. We sequentially anesthetized all cap- viduals on average visited 8.1 council areas, and 8.2 tured bats using the inhalation agent isoflurane [81] and state and 6.7 federal electorates per year, clearly dem- estimated age (juvenile or adult) from dentition [82] and onstrating the high potential for cumulative impacts the presence or absence of secondary sexual characteris- from local management actions on the conservation tics [43, 83, 84]. Bats meeting the criteria were fitted of this species. with collar-mounted transmitters immediately prior to
Welbergen et al. BMC Biology   (2020) 18:101                                                                   Page 9 of 13

recovery from anesthetic. All bats were recovered from        making bodies and responsibilities [88], and each with
anesthesia, offered fruit juice, and released at their cap-   different implications for flying-fox management (see
ture location within 5 h of capture.                          Discussion). The local level of government is usually
                                                              called the city council or shire council (local council)
Platform terminal transmitter specifications, application,    headed by a Mayor or Shire President. The state level of
and operation                                                 government is subdivided in “state electorates” with
Microwave Telemetry 9.5 g (n = 150) and GeoTrak 12 g          elected representatives known as “Members” of the Le-
(n = 52) solar platform terminal transmitter (PTT) units      gislative Assembly; the federal level of government is
were mounted on lightweight flexible collars. The QLD         subdivided in “federal electorates” with elected represen-
collar was a modified nylon webbing proprietary small         tatives known as “Members” of the House of Represen-
dog collar whose overlapping ends were secured with an        tatives. To examine the movements of tracked flying-
absorbable suture material, allowing the collar to drop       foxes among local councils, and state and federal elec-
off after an estimated 4–6 months. The NSW collar was         torates, we used roost locations to extract jurisdictional
neoprene–lined leather whose overlapping ends were se-        boundary data from shapefiles representing local govern-
cured by a ferrous rivet, providing extended deployment       ment areas (LGAs), and state and federal electorates,
time. The combined transmitter/collar weight was < 20         using the R package “sp” [89]. Shapefiles were down-
g, translating to < 3.7% of the minimum recruited body        loaded from the Australian Bureau of Statistics website
mass for P. alecto and P. poliocephalus, and < 5.7% for P.    (https://data.gov.au/dataset/ds-dga-bdcf5b09-89bc-47ec-
scapulatus. The majority of PTTs had a duty cycle of 72       9281-6b8e9ee147aa/details?q).
h off and 10 h on, providing multiple positional fixes
every fourth day. Initial QLD deployments also trialed        Movements between roost sites
48 h off, 10 h on, and 96 h off, 10 h on. The PTTs fitted     To test whether there were differences in roost site fidel-
to male P. poliocephalus in NSW had the longest duty          ity (i.e., the inverse of the probability of moving between
cycle of 254 h off, 10 h on. A sparse duty cycle was          roosts) between species, we constructed candidate gen-
chosen to maximize battery recharge and transmitter           eralized linear mixed effects models [90], including indi-
functionality based on the outcomes of previous studies       vidual identity as a random effect. The global model had
[26, 85]. During on periods, the PTTs transmitted loca-       a binary response variable of 1 if an animal switched
tional data to orbiting NOAA satellites, which relayed        roosts between successive positional fixes and included
the data via ARGOS.                                           the interaction between species and time between day-
                                                              time fixes (in days) as explanatory variables. The vari-
Data handling and analysis                                    ation in time between fixes was caused by differences in
We analyzed all data in the R environment for statistical     duty cycle, missed fixes, or a lack of positional fixes dur-
computing [86]. We managed data from deployed PTTs            ing daylight hours. The best fitting model was selected
in a standardized format in Movebank (http://www.             on the basis of AICc [91].
movebank.org/node/2). Prior to analysis, we examined
the datasets for inconsistencies, and fixes with ARGOS        Distance moved between roost sites
code Z, along with fixes with longitudes > 140 or lati-       To test whether there were differences in the distance
tudes < 0, were removed. We used daytime fixes (be-           moved between roosts for the different species, we con-
tween 10 am and 4 pm) to assign animals to a “roost           structed candidate linear mixed effects models [90] with
site” (as mainland Australian flying-foxes do not forage      individual identity as a random factor. The global model
during the day). If high resolution (ARGOS location           had the natural log of the distance between fixes as the
code 3) daytime fixes occurred within 3.5 km of a             response variable and the interaction between species
“known colony” [66, 87], we assumed animals were              and the natural log of time (in days) between daytime
roosting at that site. Where accurate daytime fixes were      fixes as explanatory variables. The best fitting model was
more than 3.5 km from a known roost location, we              selected on the basis of AICc and included a significant
manually assigned animals to a new “roost site” located       interaction between species and time between daytime
at the center of the cluster of fixes. If multiple tracked    fixes (days) (Additional file 11: Table S3). We took the
individuals roosted at the same location, this new roost      coefficient “p” from the best fitting model for each spe-
site was confidently considered to be a previously un-        cies separately and used this to estimate the constant “a”
identified “colony” of flying-foxes.                          to model the distance moved between daytime fixes
                                                              using a power function [f(x) = axp]. This was necessary
Jurisdictions                                                 as when time between successive daytime fixes was lon-
There are three levels of government in Australia: local,     ger, it was more likely that roost locations were missed
state, and federal, each with their own elected decision-     and therefore that the observed straight-line distance
Welbergen et al. BMC Biology (2020) 18:101 Page 10 of 13
between fixes was shorter than the actual straight-line Additional file 8: Figure S2. The relationships between the cumulative
distance moved between roost locations. We used this to distance traveled between roosts and the total number of days over
model the expected average distance between roosts that which individuals were tracked, for each species.
individuals from each species would be likely to move in Additional file 9: Figure S3. Rose diagrams showing the direction
animals moved between roosts each month for P. alecto, P. poliocephalus
a single day. and P. scapulatus separately. The species is indicated at the top of each
panel. Each plot is labeled for year and month (YYMM). YYMM labels
printed in red and marked with an asterisk indicate that the movement
Directional movements directions are aggregated into one or more preferred directions
To test whether animals coincided in the direction of (Hermans-Rasson test). Plots that also include red arrows are those where
a Raleigh test indicates a single preferred direction. Red arrows indicate
their movement on a monthly basis, the bearing between the mean direction, and length of arrows the extent to which the
each individual’s first and last monthly location was de- individuals coincided in direction of movement. An arrow of length 1
termined. These monthly bearings were plotted for each (radius of plot circle = 1) indicates all individuals that moved, moved in
the same direction. “n” is the number of individuals of each species
species separately. These data were used to examine tracked each month. “prop” is the proportion of tracked individuals that
whether they fell into one or more “preferred directions” moved. Black dots indicate the direction in which individuals moved.
using the Hermans-Rasson test [92]. The Bonferroni Rose diagrams shaded in gray indicate that < 6 individuals moved in a
given month and therefore the data were not statistically analyzed.
correction was used to account for the number of indi-
Additional file 10: Figure S4. Annual patterns of latitudinal
vidual tests performed (i.e., by dividing the standard 0.05 displacement of satellite-tracked flying-foxes relative to their location of
significance level α by the number of tests performed for capture. The mean latitudinal movement, calculated per day over a 5-day
each species [93]). In months when a departure from moving window, is shown by thick colored lines. Black indicates move-
ment patterns of P. alecto, blue indicates movements of P. poliocephalus
uniformity was detected by the Hermans-Rasson test, a and red indicates movements of P. scapulatus. Gray polygons represent
Rayleigh test [94] was also applied to examine whether 50 and 95% confidence intervals. The horizontal dashed line indicates no
the departure from uniformity consisted of a single peak, relative latitudinal displacement.
i.e., whether individuals of each species were significantly Additional file 11: Table S3. Candidate linear mixed effects models
explaining the distance traveled between successive daytime fixes.
oriented (in the same direction) each month.
To test whether the three species performed seasonal
Acknowledgements
north-south movements, a daily mean latitude (relative This study would not have been possible without the dedication of
to capture location) was calculated, and a rolling average numerous staff and volunteers of the Royal Botanic Gardens Sydney, who
was calculated over a 30-day window for each species assisted with capturing, assessing, and monitoring flying-foxes in New South
Wales. Fieldwork in Queensland was facilitated by colleagues at the (then)
separately. Where animals were tracked for multiple Queensland Centre for Emerging Infectious Diseases/Department of Agricul-
years (P. alecto and P. poliocephalus), we calculated the ture, Forestry and Fisheries, particularly Lauren Goldspink, Joanne Kristoffer-
mean monthly relative latitude of roosting locations and son, Debra Melville, Alice Broos, Carol de Jong, Amanda McLaughlin, and
Nina Kung. We thank Janine Barrett and Anastasia Dalziell for valuable com-
used the “ets” function of the R package forecast [95] to ments on the manuscript.
test whether seasonality was present in the dataset.
Authors’ contributions
JAW, HF, and DE conceived the ideas; JMM, CS, HF, DE, JAW, and JP
Supplementary information administered the project; DE, LM, and LPS curated the data; JM and
Supplementary information accompanies this paper at https://doi.org/10. JAW analyzed the data; JM visualized the data; JMM and HF were
1186/s12915-020-00829-w. responsible for funding acquisition; JAW, JM, and HF led the writing of the
manuscript; all authors contributed critically to the drafts and gave final
approval for publication.
Additional file 1: Table S1. Details of study subjects.
Additional file 2: Video S1. Movements of all satellite-tracked (n = 201) Funding
individuals, color-coded by species. Straight-line movements between re- This work was supported by funding from the Australian Research Council
corded fixes are interpolated. The box in the top right shows the month (DP170104272: JAW, JM; DP110104186: JAW, LPS), the State of Queensland,
and the year; whereas the box in the top left shows the number of indi- the State of New South Wales and the Commonwealth of Australia under
viduals being tracked concurrently for each species. the National Hendra Virus Research Program (HF, DE, LM), and the Royal
Additional file 3: Video S2. Movements of all satellite-tracked P. alecto Botanic Gardens Sydney (JP, JMM). The publication benefited from
(n = 80) individuals only. intellectual developments or contributions (HF) from both the PREDICT
project of the United States Agency for International Development (USAID)
Additional file 4: Video S3. Movements of all satellite-tracked P. polio- “Emerging Pandemic Threats” program (Cooperative Agreement No. AID-
cephalus (n = 109) individuals only. OAA-A-14-00102) and the “Understanding the Risk of Bat Coronavirus Emer-
Additional file 5: Video S4. Movements of all satellite-tracked P. scapu- gence” project of the National Institute of Allergy and Infectious Diseases of
latus (n = 12) individuals only. the National Institutes of Health (Award No. R01AI110964).
Additional file 6: Table S2. Candidate generalized linear mixed effects
models explaining the probabilities of switching roosts between Availability of data and materials
successive daytime fixes. The datasets analyzed during the current study are available in the Dryad
database; https://doi.org/10.5061/dryad.mcvdncjz2 [96].
Additional file 7: Figure S1. The relationships between the number of
days between fixes and distance traveled between roosts, for the three
Ethics approval and consent to participate
different species. Black dots represent the means for each time step
(days), ± 1 SE and lines are generated from the power function. All aspects of the QLD fieldwork were approved and conducted under the
(then) Department of Employment, Economic Development and InnovationWelbergen et al. BMC Biology (2020) 18:101 Page 11 of 13
Animal Ethics Committee Permit SA 2011/12/375, the QLD Environmental 14. Meade J, van der Ree R, Stepanian PM, Westcott DA, Welbergen JA. Using
Protection Agency Scientific Purposes Permit WISP05810609, and the QLD weather radar to monitor the number, timing and directions of flying-foxes
Department of Environment and Resource Management Scientific Purposes emerging from their roosts. Sci Rep. 2019;9(1):10222.
Permit WISP05810609. NSW fieldwork was approved and conducted under 15. Fahr J, Abedi-Lartey M, Esch T, Machwitz M, Suu-Ire R, Wikelski M,
the Office of Environment and Heritage Animal Ethics Committee permit Dechmann DK. Pronounced seasonal changes in the movement ecology of
110620/05 and Scientific License 100268. a highly gregarious central-place forager, the African straw-coloured fruit
bat (Eidolon helvum). PloS one. 2015;10(10):e0138985.
16. Weber N, Duengkae P, Fahr J, Dechmann DK, Phengsakul P, Khumbucha W,
Consent for publication Siriaroonrat B, Wacharapluesadee S, Maneeorn P, Wikelski M. High-resolution
Not applicable. GPS tracking of Lyle’s flying-fox between temples and orchards in central
Thailand. J Wildl Manag. 2015;79(6):957–68.
17. Nakamoto A, Kinjo K, Izawa M. Ranging patterns and habitat use of a
Competing interests solitary flying-fox (Pteropus dasymallus) on Okinawa-jima Island, Japan. Acta
The authors declare no competing interests. Chiropterologica. 2012;14(2):387–99.
18. Oleksy R, Racey PA, Jones G. High-resolution GPS tracking reveals habitat
Author details selection and the potential for long-distance seed dispersal by Madagascan
1
Hawkesbury Institute for the Environment, Western Sydney University, flying-foxes Pteropus rufus. Global Ecol Conserv. 2015;3:678–92.
Richmond, NSW 2753, Australia. 2Department of Agriculture and Fisheries, 19. Banack SA, Grant GS. Spatial and temporal movement patterns of the flying-
Queensland Centre for Emerging Infectious Diseases, Brisbane, QLD 4001, fox, Pteropus tonganus, in American Samoa. J Wildl Manag. 2002;66(4):1154–63.
Australia. 3Ecohealth Alliance, New York, NY 10001, USA. 4School of 20. Mildenstein TL, Stier SC, Nuevo-Diego C, Mills LS. Habitat selection of
Veterinary Science, The University of Queensland, Gatton, QLD 4343, endangered and endemic large flying-foxes in Subic Bay, Philippines. Biol
Australia. 5Department of Agriculture, Water and the Environment, Canberra, Conserv. 2005;126(1):93–102.
ACT 2601, Australia. 6School of Biological Sciences, The University of 21. Breed AC, Field HE, Smith CS, Edmonston J, Meers J. Bats without borders:
Queensland, St Lucia, QLD 4072, Australia. 7Royal Botanic Gardens and long-distance movements and implications for disease risk management.
Domain Trust, Sydney, NSW 2000, Australia. 8Institute for Science and EcoHealth. 2010;7(2):204–12.
Learning, Taronga Conservation Society Australia, Mosman, NSW 2088,
22. Sugita N, Inaba M, Ueda K. Roosting pattern and reproductive cycle of
Australia.
Bonin flying-foxes (Pteropus pselaphon). J Mammal. 2009;90(1):195–202.
23. Eby P. Seasonal movements of grey-headed flying-foxes, Pteropus
Received: 20 January 2020 Accepted: 13 July 2020
poliocephalus (Chiroptera: Pteropodidae), from two maternity camps in
northern New South Wales. Wildl Res. 1991;18(5):547–59.
24. Field HE, Smith CS, de Jong CE, Melville D, Broos A, Kung N, Thompson J,
References Dechmann DK. Landscape utilisation, animal behaviour and Hendra virus
1. Runge CA, Martin TG, Possingham HP, Willis SG, Fuller RA. Conserving risk. EcoHealth. 2016;13(1):26–38.
mobile species. Front Ecol Environ. 2014;12(7):395–402. 25. Tidemann CR, Nelson JE. Long-distance movements of the grey-headed
2. Robinson RA, Crick HQ, Learmonth JA, Maclean IM, Thomas CD, Bairlein F, flying-fox (Pteropus poliocephalus). J Zool. 2004;263(2):141–6.
Forchhammer MC, Francis CM, Gill JA, Godley BJ. Travelling through a 26. Roberts BJ, Catterall CP, Eby P, Kanowski J. Long-distance and frequent
warming world: climate change and migratory species. Endanger Species movements of the flying-fox Pteropus poliocephalus: implications for
Res. 2009;7(2):87–99. management. PLoS One. 2012;7(8):e42532.
3. Iwamura T, Possingham HP, Chadès I, Minton C, Murray NJ, Rogers DI, Treml 27. Palmer C, Woinarski J. Seasonal roosts and foraging movements of the
EA, Fuller RA. Migratory connectivity magnifies the consequences of habitat black flying-fox (Pteropus alecto) in the Northern Territory: resource tracking
loss from sea-level rise for shorebird populations. Proc R Soc Lond B Biol in a landscape mosaic. Wildl Res. 1999;26(6):823–38.
Sci. 2013;280(1761):20130325. 28. Spencer H, Palmer C, Parry-Jones K. Movements of fruit-bats in eastern
4. Law B, Dickman C. The use of habitat mosaics by terrestrial vertebrate Australia, determined by using radio-tracking. Wildl Res. 1991;18(4):463–7.
fauna: implications for conservation and management. Biodivers Conserv. 29. Markus N, Hall L. Foraging behaviour of the black flying-fox (Pteropus alecto)
1998;7(3):323–33. in the urban landscape of Brisbane, Queensland. Wildlife Res. 2004;31(3):
5. Runge C, Tulloch AI. Solving problems of conservation inadequacy for 345–55.
nomadic birds. Aust Zool. 2017;39(2):280–95. 30. Westcott DA, McKeown A. Flying-foxes and drifting continents. Invasion
6. Jodice PG, Suryan RM. The transboundary nature of seabird ecology. In: Biology and Ecological Theory: Insights from a Continent in Transformation.
Landscape-scale conservation planning. Dordrecht: Springer; 2010. p. 139–65. 2014;23:138–58.
7. Priede IG, French J. Tracking of marine animals by satellite. Int J Remote 31. Fujita MS, Tuttle MD. Flying-foxes (Chiroptera: Pteropodidae): threatened
Sens. 1991;12(4):667–80. animals of key ecological and economic importance. Conserv Biol. 1991;5(4):
8. Schofield G, Dimadi A, Fossette S, Katselidis KA, Koutsoubas D, Lilley MK, 455–63.
Luckman A, Pantis JD, Karagouni AD, Hays GC. Satellite tracking large 32. Shilton LA, Altringham JD, Compton SG, Whittaker RJ. Old World fruit bats
numbers of individuals to infer population level dispersal and core areas for can be long–distance seed dispersers through extended retention of viable
the protection of an endangered species. Divers Distrib. 2013;19(7):834–44. seeds in the gut. Proc R Soc Lond B Biol Sci. 1999;266(1416):219–23.
9. Hall LS, Richards G. Flying-foxes: fruit and blossom bats of Australia. Sydney: 33. Bradshaw CJ. Little left to lose: deforestation and forest degradation in
UNSW Press; 2000. Australia since European colonization. J Plant Ecol. 2012;5(1):109–20.
10. Welbergen JA. The social organisation of the grey-headed flying-fox, 34. Nathan R, Schurr FM, Spiegel O, Steinitz O, Trakhtenbrot A, Tsoar A.
Pteropus poliocephalus. PhD thesis. Cambridge: University of Cambridge; Mechanisms of long-distance seed dispersal. Trends Ecol Evol. 2008;23(11):
2005. 638–47.
11. Klose SM, Welbergen JA, Goldizen AW, Kalko EK. Spatio-temporal vigilance 35. Trakhtenbrot A, Nathan R, Perry G, Richardson DM. The importance of long-
architecture of an Australian flying-fox colony. Behav Ecol Sociobiol. 2009; distance dispersal in biodiversity conservation. Divers Distrib. 2005;11(2):
63(3):371–80. 173–81.
12. Lunney D, Moon C. Flying-foxes and their camps in the remnant rainforests 36. Fraser GC, Hooper PT, Lunt RA, Gould AR, Gleeson LJ, Hyatt AD, Russell GM,
of north-east New South Wales. Australia’s Everchanging Forests III Centre Kattenbelt JA. Encephalitis caused by a lyssavirus in fruit bats in Australia.
for Resource and Environmental Studies. Canberra: Australian National Emerg Infect Dis. 1996;2(4):327.
University; 1997. p. 247–77. 37. Halpin K, Young PL, Field H, Mackenzie J. Isolation of Hendra virus from
13. Plowright RK, Foley P, Field HE, Dobson AP, Foley JE, Eby P, Daszak P. Urban pteropid bats: a natural reservoir of Hendra virus. J Gen Virol. 2000;81(8):
habituation, ecological connectivity and epidemic dampening: the 1927–32.
emergence of Hendra virus from flying-foxes (Pteropus spp.). Proc R Soc 38. Field H, Jordan D, Edson D, Morris S, Melville D, Parry-Jones K, Broos A,
Lond B Biol Sci. 2011;278(1725):3703–12. Divljan A, McMichael L, Davis R. Spatiotemporal aspects of Hendra virusWelbergen et al. BMC Biology (2020) 18:101 Page 12 of 13
infection in pteropid bats (flying-foxes) in eastern Australia. PLoS One. 2015; flying-fox (Pteropus poliocephalus) at the southern-most extent of its range:
10(12):e0144055. further evidence this species does not readily transmit the virus to horses.
39. Philbey A, Kirkland P, Ross A, Field H, Srivastava M, Davis R, Love R. Infection PLoS One. 2016;11(6):e0155252.
with Menangle virus in flying-foxes (Pteropus spp.) in Australia. Aust Vet J. 62. Field H. The ecology of Hendra virus and Australian bat lyssavirus; 2004.
2008;86(11):449–54. 63. Plowright RK, Field HE, Smith C, Divljan A, Palmer C, Tabor G, Daszak P,
40. Becker DJ, Washburne AD, Faust CL, Mordecai EA, Plowright RK. The Foley JE. Reproduction and nutritional stress are risk factors for Hendra virus
problem of scale in the prediction and management of pathogen spillover. infection in little red flying-foxes (Pteropus scapulatus). Proc R Soc Lond B
Philos Trans R Soc B. 2019;374(1782):20190224. Biol Sci. 2008;275(1636):861–9.
41. Tait J, Perotto-Baldivieso HL, McKeown A, Westcott DA. Are flying-foxes 64. Edson D, Peel A, Huth L, Mayer D, Vidgen M, McMichael L, Broos A, Melville
coming to town? Urbanisation of the spectacled flying-fox (Pteropus D, Kristoffersen J, de Jong C. Time of year, age class and body condition
conspicillatus) in Australia. PLoS One. 2014;9(10):e109810. predict Hendra virus infection in Australian black flying-foxes (Pteropus
42. Eby P, Richards G, Collins L, Parry-Jones K. The distribution, abundance and alecto). Epidemiol Infect. 2019;147:e240 1–10.
vulnerability to population reduction of a nomadic nectarivore, the grey- 65. Roberts BJ, Catterall CP, Eby P, Kanowski J. Latitudinal range shifts in
headed flying-fox Pteropus poliocephalus in New South Wales, during a Australian flying-foxes: a re-evaluation. Austral Ecol. 2012;37(1):12–22.
period of resource concentration. Aust Zool. 1999;31(1):240–53. 66. Westcott DA, McKeown A, Murphy HT, Fletcher CS: A monitoring method
43. Edson D, Field H, McMichael L, Vidgen M, Goldspink L, Broos A, Melville D, for the grey-headed flying-fox, Pteropus poliocephalus. Atherton: CSIRO
Kristoffersen J, de Jong C, McLaughlin A. Routes of Hendra virus excretion in published Guidelines; 2011.
naturally-infected flying-foxes: implications for viral transmission and 67. Westcott DA, Fletcher CS, McKeown A, Murphy HT. Assessment of
spillover risk. PLoS One. 2015;10(10):e0140670. monitoring power for highly mobile vertebrates. Ecol Appl. 2012;22(1):
44. Kung N, McLaughlin A, Taylor M, Moloney B, Wright T, Field H. Hendra virus 374–83.
and horse owners–risk perception and management. PLoS One. 2013;8(11): 68. Westcott DA, Heersink DK, McKeown A, Caley P. The status and trends of
e80897. Australia’s EPBC-Listed flying-foxes. Australia: CSIRO; 2015.
45. Kung NY, Field HE, McLaughlin A, Edson D, Taylor M. Flying-foxes in the 69. Duncan AM, Baker GB, Montgomery N. The action plan for Australian bats:
Australian urban environment—community attitudes and opinions. One Natural Heritage Trust; 1999.
Health. 2015;1:24–30. 70. Eby P, Law B. Ranking the feeding habitat of grey-headed flying-foxes for
46. Roberts BJ, Eby P, Catterall CP, Kanowski J, Bennett G: The outcomes and conservation management. Canberra: Department of Environment, Heritage,
costs of relocating flying-fox camps: insights from the case of Maclean, Water and the Arts; 2008.
Australia. The Biology and Conservation of Australasian Bats Mosman, NSW, 71. Welbergen JA, Klose SM, Markus N, Eby P. Climate change and the effects
Australia: Royal Zoological Society of NSW 2011:277–287. of temperature extremes on Australian flying-foxes. Proc R Soc Lond B Biol
47. Serneels S, Lambin EF. Impact of land-use changes on the wildebeest Sci. 2008;275(1633):419–25.
migration in the northern part of the Serengeti–Mara ecosystem. J 72. Boer MM, de Dios VR, Bradstock RA. Unprecedented burn area of Australian
Biogeogr. 2001;28(3):391–407. mega forest fires. Nat Clim Chang. 2020;10(3):171–2.
48. Egevang C, Stenhouse IJ, Phillips RA, Petersen A, Fox JW, Silk JR. Tracking of 73. Department of Environment and Climate Change NSW. Threatened species
Arctic terns Sterna paradisaea reveals longest animal migration. Proc Natl assessment guidelines; The assessment of significance. Sydney: Department
Acad Sci. 2010;107(5):2078–81. of Environment and Climate Change NSW; 2007.
49. Fraser KC, Davies KT, Davy CM, Ford AT, Flockhart DTT, Martins EG. Tracking the 74. Toop S. Relocating Melbourne’s flying-foxes–an overview of practices and
conservation promise of movement ecology. Front Ecol Evol. 2018;6:150. processes. Aust Bat Soc Newslett. 2004;22:17,18.
50. Hein AM, Hou C, Gillooly JF. Energetic and biomechanical constraints on 75. van der Ree R, Nelson J, Bender H: The effectiveness of ultrasound at
animal migration distance. Ecol Lett. 2012;15(2):104–10. deterring grey-headed flying-foxes from roosting in the Fern Gully, Royal
51. Sinclair E, Webb N, Marchant A, Tidemann C. Genetic variation in the little Botanic Gardens, Melbourne: a pilot study: Australian Research Centre for
red flying-fox Pteropus scapulatus (Chiroptera: Pteropodidae): implications Urban Ecology Melbourne; 2002.
for management. Biol Conserv. 1996;76(1):45–50. 76. Review of past flying-fox dispersal actions between 1990–2013. https://
52. Webb N, Tidemann C. Mobility of Australian flying-foxes, Pteropus spp. www.environment.nsw.gov.au/resources/animals/flying-fox-2014-.subs/
(Megachiroptera): evidence from genetic variation. Proc R Soc Lond B. 1996; flyingfoxsub-jenny-beatson-part2.pdf. Accessed 29 July 2020.
263(1369):497–502. 77. Welbergen JA. Timing of the evening emergence from day roosts of the
53. McConkey KR, Drake DR. Flying-foxes cease to function as seed dispersers grey-headed flying-fox, Pteropus poliocephalus: the effects of predation risk,
long before they become rare. Ecology. 2006;87(2):271–6. foraging needs, and social context. Behav Ecol Sociobiol. 2006;60(3):311.
54. Epstein JH, Olival KJ, Pulliam JR, Smith C, Westrum J, Hughes T, Dobson AP, 78. Speakman J, Hays G, Webb P. Is hyperthermia a constraint on the diurnal
Zubaid A, Rahman SA, Basir MM. Pteropus vampyrus, a hunted migratory activity of bats? J Theor Biol. 1994;171(3):325–39.
species with a multinational home-range and a need for regional 79. Epstein J, Field H: Disease surveillance in free ranging bat populations:
management. J Appl Ecol. 2009;46(5):991–1002. challenges and logistical considerations. Rome: FAO Animal Production and
55. Humphries NE, Weimerskirch H, Sims DW. A new approach for objective Health Manual (FAO). 2011.
identification of turns and steps in organism movement data relevant to 80. Cochran W: Wildlife telemetry, fr: SD Schemnitz (ed.) Wildlife management
random walk modelling. Methods Ecol Evol. 2013;4(10):930–8. techniques manual. 4a. The Wildlife Society, Bethesda, pp 5O7-52O 1980.
56. Managing tensions around urban flying-fox roosts. https://www.ecolsoc.org. 81. Jonsson N, Johnston S. Field anaesthesia of three Australian species of
au/hot-topics/managing-tensions-around-urban-flying-fox-roosts. Accessed flying-fox. Vet Rec. 2004;154(21):664.
29 July 2020. 82. Divljan A, Parry-Jones K, Wardle GM. Age determination in the grey-headed
57. Páez DJ, Restif O, Eby P, Plowright RK. Optimal foraging in seasonal flying-fox. J Wildl Manag. 2006;70(2):607–11.
environments: implications for residency of Australian flying-foxes in food- 83. Welbergen JA. Growth, bimaturation, and sexual size dimorphism in wild gray-
subsidized urban landscapes. Phil Trans R Soc B. 2018;373(1745):20170097. headed flying-foxes (Pteropus poliocephalus). J Mammal. 2010;91(1):38–47.
58. Summary of Hendra virus incidents in horses. https://www.business.qld.gov. 84. Welbergen JA. Fit females and fat polygynous males: seasonal body mass
au/industries/service-industries-professionals/service-industries/veterinary- changes in the grey-headed flying-fox. Oecologia. 2011;165(3):629–37.
surgeons/guidelines-hendra/incident-summary. Accessed 29 July 2020. 85. Smith CS, Epstein JH, Breed AC, Plowright RK, Olival KJ, de Jong C, Daszak P,
59. Smith C, Skelly C, Kung N, Roberts B, Field H. Flying-fox species density-a Field HE. Satellite telemetry and long-range bat movements. PLoS One.
spatial risk factor for Hendra virus infection in horses in Eastern Australia. 2011;6(2):e14696.
PLoS One. 2014;9(6):e99965. 86. R Core Team. R: a language and environment for statistical computing.
60. Goldspink LK, Edson DW, Vidgen ME, Bingham J, Field HE, Smith CS. Natural Vienna: R Foundation for Statistical Computing; 2017.
Hendra virus infection in flying-foxes-tissue tropism and risk factors. PLoS 87. McKeown A, Westcott DA. Assessing the accuracy of small satellite
One. 2015;10(6):e0128835. transmitters on free-living flying-foxes. Austral Ecol. 2012;37(3):295–301.
61. Burroughs A, Durr P, Boyd V, Graham K, White J, Todd S, Barr J, Smith I, 88. Three levels of government: governing Australia. https://peo.gov.au/
Baverstock G, Meers J. Hendra virus infection dynamics in the grey-headed understand-our-parliament/how-parliament-works/three-levels-of-You can also read