Contrasting Impacts of Cultivated Exotics on the Functional Diversity of Domestic Gardens in Three Regions with Different Aridity - UFZ
←
→
Page content transcription
If your browser does not render page correctly, please read the page content below
Ecosystems
https://doi.org/10.1007/s10021-020-00556-x
                                                                                                        Ó 2020 The Author(s)

     Contrasting Impacts of Cultivated
    Exotics on the Functional Diversity
      of Domestic Gardens in Three
      Regions with Different Aridity
    Josep Padullés Cubino,1,2* Dorothy Borowy,3 Sonja Knapp,4,5
Zdeňka Lososová,2 Carlo Ricotta,6 Stefan Siebert,7 Jeannine Cavender-
 Bares,1 Daniel Sol,8 Alienor Jeliazkov,9,10 and Christopher Swan3

    1
   Department of Ecology, Evolution and Behavior, University of Minnesota, 1479 Gortner Ave, St. Paul, Minnesota 55108, USA;
2
 Department of Botany and Zoology, Masaryk University, Kotlářská 2, 61137 Brno, Czech Republic; 3Department of Geography and
 Environmental Systems, University of Maryland, Baltimore County, 1000 Hilltop Circle, Baltimore, Maryland 21250, USA; 4Helm-
  holtz-Centre for Environmental Research – UFZ, Department of Community Ecology, Theodor-Lieser-Str. 4, 06120 Halle (Saale),
Germany; 5Department of Ecology, Chair of Urban Ecosystem Science, Technische Universität Berlin, Rothenburgstr. 12, 12165 Berlin,
Germany; 6Department of Environmental Biology, University of Rome, ‘La Sapienza’, Piazzale Aldo Moro 5, 00185 Rome, Italy; 7Unit
for Environmental Sciences and Management, North-West University, Potchefstroom 2520, South Africa; 8CREAF-CSIC (Centre for
Ecological Research and Applied Forestries), 08193 Cerdanyola Del Vallès, Catalonia, Spain; 9German Centre for Integrative Biodi-
versity Research (iDiv), Halle-Jena-Leipzig, 04103 Leipzig, Germany; 10Institute of Computer Science, Martin Luther University Halle-
                                               Wittenberg, 06120 Halle (Saale), Germany

ABSTRACT
Cultivated exotic plants are often introduced for                         (Minnesota, USA; Alt Empordà, Spain; and central
their aesthetic value and today comprise a substan-                       South Africa) that differ in aridity. For each garden,
tial fraction of the flora of urban domestic gardens.                     we calculated the mean and variance of each plant
Yet, their relative contribution to the functional                        trait considering all co-occurring species and also
diversity of domestic gardens and how it changes                          splitting them into co-occurring cultivated exotics
across different climate zones is insufficiently                          and natives. Our results revealed that mean plant
understood. Here, we investigated whether the ef-                         showiness increased linearly with the proportion of
fects of cultivated exotics on functional diversity of                    cultivated exotics both across and within studied
three plant traits related to plant aesthetics (that is,                  regions. Moreover, co-occurring cultivated exotics
plant showiness, plant height, and leaf area) varied                      were, on average, showier than natives in all re-
in suburban domestic gardens in three regions                             gions, but differences in their trait variances were
                                                                          context-dependent. The interaction between culti-
                                                                          vated exotics and aridity explained variation in
                                                                          mean plant height and leaf area better than either
Received 4 March 2020; accepted 28 August 2020                            predictor alone, with the effect of cultivated exotics
                                                                          being stronger in more arid regions. Accordingly, co-
                                                                          occurring cultivated exotics were taller and had
Electronic supplementary material: The online version of this article
                                                                          larger leaves than natives in warmer and drier re-
(https://doi.org/10.1007/s10021-020-00556-x) contains supplementary
material, which is available to authorized users.                         gions, while the opposite was true in cooler and
Author Contributions: All authors participated to the conception of the   wetter regions. Our study highlights the need to
study. JPC analyzed data. All authors contributed to the writing and
                                                                          consider the combined effects of exotic species and
approved the final version of the manuscript.
*Corresponding author; e-mail: padullesj@gmail.com                        climate in future studies of urban ecology.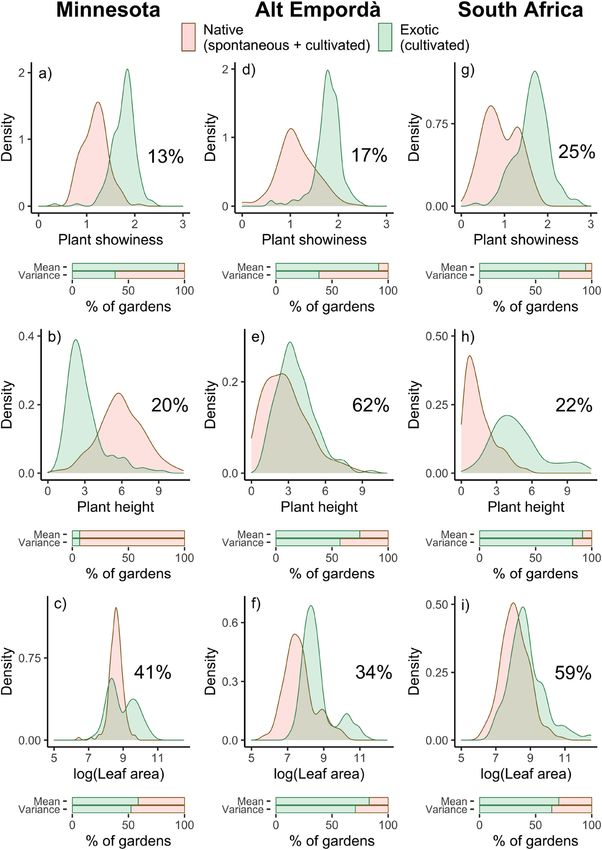
J. P. Cubino and others

Key words: Climate change; Horticulture; Hu-              Cultivated species in gardens are largely selected
man preferences; Introduced species; Plant traits;     from the horticultural pool (Cavender-Bares and
Urban ecosystems; Urbanization.                        others 2020) based on homeowners’ preferences
                                                       for certain traits associated with these species,
                                                       including low water requirements, a specific size at
                                                       maturity, and showy flower displays (for example,
HIGHLIGHTS                                             Kendal and others 2012a; Goodness 2018; Pearse
                                                       and others 2018). These traits have often been re-
                                                       ferred to as ‘ecosystem-service based traits’ (Pataki
 The interaction between exotics and aridity          and others 2013), as opposed to the suite of traits
  drove functional diversity in gardens.               commonly used in ecological studies (Cornelissen
 The effect of this interaction was positive and      and others 2003; Pérez-Harguindeguy and others
  stronger in more arid regions.                       2013). In this regard, the aesthetic value associated
 Exotics were on average showier than co-occur-       with more colorful vegetation has been considered
  ring natives in all regions.                         an important cultural ecosystem service that con-
                                                       tributes to human well-being in urban areas (Ulrich
                                                       1986; Millennium Ecosystem Assessment 2005)
INTRODUCTION                                           although it can be perceived differently by different
As the world becomes more urbanized (UN DESA           social and cultural groups (Marco and others 2010).
2018), urban plant communities are becoming            Although the scientific literature indicates that
increasingly important for maintaining biodiversity    ecosystem-service based traits associated with vi-
(Aronson and others 2014, 2016) and providing          sual aesthetics tend to be of high priority for the
ecosystem services (Tratalos and others 2007). Al-     configuration of the floras in domestic gardens
though exotic plants comprise a substantial fraction   (reviewed in Goodness and others 2016), we have
of the urban flora (Pyšek and others 2010) and are    a relatively poor understanding of the contribution
often assumed to increase taxonomic diversity in       of cultivated exotics to the diversity of these traits,
urban environments (Pearse and others 2018),           and whether trait diversity of cultivated exotics and
their contributions to ecosystem function and the      natives differs across climatic zones.
delivery of ecosystem services to urban residents         Climate has been shown to be the major driver of
across different environmental and social contexts     garden plant diversity and composition at large
are insufficiently understood (Cook-Patton and         spatial scales (Loram and others 2008; Pearse and
Agrawal 2014).                                         others 2018; Padullés Cubino and others 2019).
   Urban plant species, both native and exotic, can    Low and highly variable precipitation (that is, in-
be broadly classified into two groups: cultivated      creased aridity) induces water stress in native
(that is, plants that are intentionally introduced     plants affecting their growth, photosynthetic abil-
and managed by humans) and spontaneous (that           ity, and ultimately their distribution. Unlike other
is, plants that colonize and establish without hu-     climatic constraints, such as extreme temperatures,
man assistance). The relative abundance of species     water availability in gardens can be regulated by
representing each group varies across urban habitat    irrigation, allowing cultivated exotic plants to per-
types with different levels of human management        sist in areas where natural conditions would
(for example, parks, gardens, abandoned land)          otherwise be unsuitable. As a result, trait differ-
(Aronson and others 2016). Among urban habitat         ences between co-occurring native and cultivated
types, domestic gardens represent highly managed       exotic plants in gardens are expected to increase
areas where gardening practices in the form of soil    with aridity, leading to contrasting patterns of plant
amendments, supplemental watering, weeding,            functional diversity in regions with varying aridity.
and fertilization have been shown to partly over-      To date, few studies have considered how exotic
ride climatic stress and other natural environmen-     species and water availability collectively influence
tal filters (Kendal and others 2012b; Groffman and     diversity patterns (for example, Nobis and others
others 2016; Padullés Cubino and others 2019),        2009), despite a number of scientific studies urging
and favor the persistence of a large number of         for a more integrated approach (Walther and others
cultivated species with different functional strate-   2009).
gies (Marco and others 2010; Bigirimana and oth-          The connection between functional traits and
ers 2012; van Heezik and others 2013).                 ecosystem services is well documented for a wide
Cultivated exotics affect functional diversity

range of ecosystems (reviewed in de Bello and                   wider range of altitudes (that is, occupy a wider,
others 2010). However, this connection has not                  and likely novel, trait space), which could translate
been fully described in novel urban ecosystems,                 into greater provisioning of ecosystem services, and
particularly for cultural ecosystem services (for               disservices. This approach can also be extended
example, Goodness and others 2016; Avolio and                   from groups of co-occurring species to groups of
others 2018). In addition, no single functional                 communities in a particular landscape.
diversity measure captures all of the relevant                     Here, we apply this framework to investigate the
information needed for drawing mechanistic links                role of cultivated exotic plants in determining
between functional traits and ecosystem function                functional diversity of traits related to visual
(for example, Pavoine and others 2017). As a re-                attraction and aesthetic appeal in domestic gardens
sult, complementary measures, which cover speci-                in suburban areas of three regions that vary in
fic aspects of community functional structure, are              aridity (Minnesota, USA; Alt Empordà, Spain; and
required (Figure 1). First, community mean (CM)                 central South Africa). To this end, we selected three
trait values describe how a group of co-occurring               plant traits representing visual aesthetic character-
species collectively contribute to a specific ecosys-           istics: plant showiness, plant height, and leaf area.
tem function, which can, in turn, translate into a              These traits have been linked to residents’ prefer-
range of ecosystem services. For example, if culti-             ences in a number of urban studies (Acar and
vated exotics show larger CM values for plant                   others 2007; Goodness and others 2016; Padullés
height than natives in a domestic garden, then this             Cubino and others 2020). Showy plants with col-
likely indicates that cultivated exotics contribute             orful flowers, fruits, and leaves have often been
more to certain ecosystem services (for example,                documented as more desirable in urban landscap-
provision of shade) or disservices (for example,                ing, due to their inherent aesthetic value (Kaufman
dropping of debris) than co-occurring natives                   and Lohr 2004; Todorova and others 2004; Kendal
(Avolio and others 2018). Second, community trait               and others 2012a). Studies have also suggested that
variability (or trait variance; CV) defines the total           distinct levels of plant heights (that is, greater
community trait space occupied by a group of co-                vegetation structural complexity) increase aesthetic
occurring species. Again, if cultivated exotics have            appeal (Ulrich 1986; Kaplan and Kaplan 1989;
a greater CV for plant height than natives in a                 Southon and others 2017), as well as certain leaf
domestic garden, then this suggests they have a                 morphologies and complex broad-leaved foliage

Figure 1. Diagram exemplifying differences between two trait measures (that is, community mean (CM) and variance
(CV)) in different groups of species. In case a), the two groups have different mean trait values (CM2 > CM1), but equal
trait variances. In case b), the two groups have equal mean trait values, but different trait variances (CV2 > CV1). This
same approach could be applied to a group of communities instead of species.
J. P. Cubino and others

(Williams 2002; Lindemann-Matthies and Bose               MATERIALS      AND   METHODS
2007). Understanding how human-mediated
selection for these traits induces differences in the     Study Areas and Vegetation Data
functional diversity of exotic and native species is      For the purpose of this study, domestic gardens (or
crucial for the design and planning of sustainable        only ‘gardens’) were defined as the private land
landscapes that aim to maximize the provision of          around a detached, semi-attached, or attached
ecosystem services.                                       single-family home that is actively managed pri-
   Our analyses are based on plant presence/ab-           marily for aesthetic purposes. We extracted infor-
sence data for 460 domestic gardens in suburban           mation on vascular plant species occurrence in 460
areas located on three different continents (North        gardens from various datasets encompassing sub-
America, Europe, and Africa). Suburban areas in           urban areas in three regions: Minnesota, USA; Alt
these three regions (Minnesota, Alt Empordà, and         Empordà, Spain; and central South Africa. To en-
central South Africa) share a common European             sure consistent sampling effort in our data, ex-
gardening culture centered around aesthetic               tracted data in each region matched four
ecosystem services but differ in a number of char-        conditions: (1) Gardens were actively managed by
acteristics such as their cultural and socio-economic     live-in owners or tenants (that is, non-abandoned),
background, biogeographic history, or climate             (2) plant data were recorded at the individual
(Lubbe and others 2010; Padullés Cubino and              garden level, (3) garden area was recorded, and (4)
others 2015; Cavender-Bares and others 2020). We          data contained an exhaustive list of all plant species
use the distribution of the three regions along a         (that is, both cultivated and spontaneously occur-
major global aridity gradient to assess whether the       ring plants) present in the garden. Data from
influence of cultivated exotics on the functional         Minnesota, USA, included 155 domestic gardens
diversity in gardens varies as a function of climate.     sampled in the Minneapolis-St. Paul metropolitan
   We specifically address three questions: (1) How       area between 2008 and 2012. The Alt Empordà
does the proportion of cultivated exotic plant spe-       region in northeastern Spain included 258 domes-
cies relate to the functional trait diversity of          tic gardens distributed among five neighboring
domestic gardens? (2) Do cultivated exotics influ-        municipalities that were sampled in 2012. Finally,
ence functional trait diversity of gardens differently    data from central South Africa included 150
across a global aridity gradient? (3) Do cultivated       domestic gardens distributed between two munic-
exotics differ from co-occurring natives in func-         ipalities located approximately 100 km apart (Jo-
tional trait diversity in regions with different levels   hannesburg and Tlokwe) that were sampled
of aridity? Because homeowners often select for           between 2008 and 2011. We considered gardens in
cultivated species with different colors and aes-         this region to be in the same geographic unit be-
thetic characteristics (Goodness and others 2016),        cause species composition was consistently homo-
we hypothesized that higher proportions of culti-         geneous across the region (Appendix S1:
vated exotics in domestic gardens would be posi-          Figure S2). To standardize sampling efforts among
tively associated with functional diversity of plant      cities, we randomly subsampled 155 gardens in Alt
showiness. We also expected the interaction be-           Empordà to make the data comparable to Min-
tween cultivated exotics and aridity to be important      nesota and South Africa. Details on site selection
in explaining variation in plant height and leaf          and data collection in each location can be found in
area, given that irrigation by homeowners can             the references provided in Table 1, and in Appen-
compensate for the lack of precipitation in more          dix S1: Table S1.
arid regions (Kendal and others 2012b; Padullés             In all datasets, plants were identified to the spe-
Cubino and others 2019), creating newly available         cies level by trained botanists and the support of
niches that can potentially be filled by cultivated       specialized literature. For those species that could
exotics. Consequently, we expected co-occurring           not be identified at the species level, the genus was
cultivated exotics to be taller and have larger leaves    recorded ( 9%). We retained records for hybrid
than natives in more arid regions. Nonetheless, we        species ( 8%), but excluded hybrid genera
expected co-occurring cultivated exotics to be, both      (< 1%). Species were designated as either spon-
on average and in their distribution, showier than        taneous or cultivated based on homeowner inter-
natives regardless of aridity.                            views, observations of placement, land use, and
                                                          land-use history. We standardized nomenclature
                                                          for all species according to accepted name in the
                                                          Plant List (www.theplantlist.org) version 2.1 using
Cultivated exotics affect functional diversity
Table 1. Location, Number of Gardens, Climate, and References for Each Dataset.
Region Latitude; Number of Mean Annual Annual Aridity Dataset references4
(country) Longitudea analyzed Temperature Precipitation index
gardens (°C)b (mm)2 (*10,000)c
Minnesota 44.97; 155 7.0 754 8291 Cavender-Bares and others
(USA) - 93.19 (2019), Padullés Cubino and
Narango (2019)
Alt Empordà 42.25; 3.12 155 15.2 531 6118 Padullés Cubino (2019)
(Spain)
South Africa - 26.20; 150 16.7 720 4271 Siebert and others (2020)
28.04
a
The spatial distribution of domestic gardens within regions can be found in Appendix S1: Figure S1.
b
Climatic data represent average values across all households in each city. Mean annual temperature and annual precipitation were obtained from the WorldClim database v.2
(www.worldclim.org/version2). Additional climatic data can be found in Appendix S1: Table S2.
c
Details on the calculation of the aridity index can be found in the Methods. Aridity index values increase for cooler and wetter conditions and decrease with warmer and drier
conditions.
4
A complete list of publications derived from these datasets can be found in Table S1.
the R package Taxonstand (Cayuela and others berries. Foliage showiness also consisted of two
2017). In total, studied gardens contained 1863 categories that depended on whether leaves turn
taxa. color in the fall or have whitish, bluish, or other
neutral tones in their leaves (for example, Silene
Native Species Status coronaria, Codiaeum variegatum) (1), in contrast to
leaves that are only green (0). Data for these traits
We classified species as native or exotic in each city
were obtained from the USDA PLANTS database,
using database information and peer-reviewed lit-
the Missouri Botanical (www.missouribotanicalga
erature. Specifically, we used USDA PLANTS (ww
rden.org), and specialized floras such as Bolós and
w.plants.usda.gov) and EOL (www.eol.org) data-
others (2005) and Glen (2002).
bases for classifying garden species in Minnesota.
Plant height and leaf area were collected from
For gardens in Alt Empordà, we classified species as
the TRY database (www.try-db.org; additional ref-
native or exotic according to Bolós and others
erences are provided in Appendix S2). We excluded
(2005). Finally, we followed Germishuizen and
trait records for plant height and leaf area with a
others (2006) and Glen (2002) for classifying gar-
distance greater than 4 standard deviations from
den species in central South Africa. Hybrid species
the mean of species or genus to avoid any potential
were classified as exotic. The proportion (%) of
effect of outliers (Dı́az and others 2016). We then
cultivated exotic species in gardens ranged from
calculated species’ mean trait values with the re-
3% to 74% in Minnesota, from 12 to 92% in Alt
tained plant trait records. All traits were available
Empordà, and from 0% to 72% in central South
for at least 57% of the species in each region (Ap-
Africa (Appendix S1: Figure S3).
pendix S3: Table S3).
Plant Traits Related to Visual Aesthetics Missing Trait Data Imputation
We assigned trait values to all recorded species.
To account for missing data, we imputed trait val-
Plant showiness was calculated for all species as the
ues using phylogenetic information from closely
sum of three independent categorical plant traits:
related species with available data (Swenson 2014).
flower, fruit, and foliage showiness (Avolio and
We relied on data imputation versus selective re-
others 2015; Padullés Cubino and others 2020).
moval of species with unavailable trait information
Flower showiness was divided into three categories:
because it avoids potential bias resulting from the
0 for species that did not flower or had inconspic-
removal of rare species sampled in different re-
uous flowers; 1 for species whose flowers are visible
gions. First, we constructed a phylogenetic tree
and conspicuous; and 2 for species with large
using an updated version of the Zanne and others
showy flowers. Fruit showiness consisted of two
(2014) phylogeny constructed by Qian and Jin
categories: non-visible (0) or visible (1) fruits orJ. P. Cubino and others
(2016). We added species missing from this phy- Clim database v.2 (www.worldclim.org/version2)
logeny at the genus level using the ‘con- (Fick and Hijmans 2017), whereas MAE values
generic.merge’ function in the R package pez were aggregated from potential evapotranspiration
(Pearse and others 2015). Hybrid species and those layers estimated on a monthly average based on the
recorded at the genus level were also added to the Penman–Monteith equation (see Trabucco and
phylogeny when possible. We excluded about Zomer 2019). Aridity index values increase for
2.7% of the taxa from the analysis for which there cooler and wetter conditions and decrease with
were no phylogenetic data. Second, we used the R warmer and drier conditions. We extracted the
package Rphylopars (Goolsby and others 2017) to mean aridity index for each plot in our study using
compare available trait data across four alternative the R package raster (Hijmans 2019).
evolutionary models (that is, Early Burst, Brown-
ian motion, Ornstein–Uhlenbeck, and multivariate Statistical Analysis
Ornstein–Uhlenbeck). We selected the best-fitting
We established significance at a < 0.05 and per-
model based on the lowest AIC value (that is,
formed all statistical analyses in R version 3.5.3 (R
Ornstein–Uhlenbeck) to impute trait data. Further
Core Team. 2019). We calculated the community
details on missing trait data imputation and per-
mean (CM) and variance (CV) of plant showiness,
formance assessment can be found in Appendix S3.
plant height, and leaf area in each garden consid-
After completing trait data imputation, we
ering (1) all co-occurring species, and (2) separately
established a maximum plant height of 25 meters
for co-occurring cultivated exotics and natives (that
and assigned this value to all species taller than 25
is, including both cultivated and spontaneously
m. We did this based on the authors’ personal
occurring natives). We chose trait variance over
observations and knowledge that human manage-
trait range as a measure of trait dispersion because
ment rarely allows tall trees to achieve their max-
it is less sensitive to the effect of outliers.
imum height in domestic gardens. We also tested
We modeled CM and CV of each trait considering
the limitations of assigning a maximum plant
all co-occurring species across all gardens as a
height value by repeating analyses using different
function of the proportion (%) of cultivated exotics
maximum plant heights to assess their effect on the
and the aridity index (fixed effects, previously
results, but they all showed similar patterns (Ap-
standardized and centered; Zuur and others
pendix S4).
(2007)), using linear mixed-effects models with the
‘lme’ function in R package nlme (Pinheiro and
Aridity Index others 2018). Leaf area was log-transformed prior
The three regions included in our study are located to analysis to reduce skewness and improve the
along a global aridity gradient (from cooler and normality of the residuals. In all models, we in-
wetter to warmer and drier: Minnesota, Alt Em- cluded ‘region’ (that is, Minnesota, Alt Empordà,
pordà, and central South Africa, respectively) that South Africa) as a random effect to account for
maximizes climatic differences among these areas large-scale spatial patterns and other region-speci-
better than other variables such as mean annual fic characteristics. In addition, because gardens in
temperature, annual precipitation, or the maxi- South Africa were split into two relatively distant
mum and minimum temperatures of the warmest cities (that is, Johannesburg and Tlokwe; Fig-
and coldest month (Table 1; Appendix S1: ure S1), we also nested ‘city’ within ‘region’ in the
Table S2). random effect. Overall, we investigated five can-
To quantify the aridity gradient and account for didate models resulting from the combination of
its influence in our models, we downloaded the both predictors and their interaction: aridity index
global aridity index (hereafter aridity index) data (M1), % of cultivated exotics (M2), log-trans-
from the Consortium for Spatial Information’s formed % of cultivated exotics (M3; to account for
(CGIAR-CSI) website (www.cgiarcsi.community) potential nonlinear and saturating effects), the
(Trabucco and Zomer 2019). The mean aridity in- combined effects of aridity index and % of culti-
dex from the 1950–2000 period was available at 30 vated exotics (that is, aridity index + % cultivated
arc second spatial resolution and is calculated as: exotics; M4), and the interaction between aridity
index and % of cultivated exotics (that is, aridity
Aridity index ¼ MAP=MAE
index * % cultivated exotics; M5). To account for
where MAP is the mean annual precipitation, and potential species-area effects, we included the log-
MAE the mean annual potential evapotranspira- transformed area of each garden as a covariate in all
tion. MAP values were obtained from the World- models. We also included a null model with onlyCultivated exotics affect functional diversity
the log-transformed garden area as a fixed effect Within locations, the proportion of cultivated
and location as a random factor (M0). We calcu- exotics was consistently and positively associated
lated the AICc (the small-sample-size-corrected with CM of plant showiness (Figure 2A). However,
Akaike information criterion; Anderson 2008) CV of plant showiness was only positively associ-
values of each candidate model set and ranked the ated with the proportion of cultivated exotics in
models by their Akaike weights using the R pack- South Africa (Figure 2B). For plant height, both
age AICcmodavg (Mazerolle 2019). We used the CM and CV were positively associated with the
function ‘modavgPred’ in the same package to proportion of cultivated exotics in South Africa but
compute the model-averaged predictions, which is negatively associated with the proportion of culti-
the natural average and reduces concerns about vated exotics in Minnesota (Figure 2C–D). The
bias away from zero (Cade 2015). To assess the association between CM of plant height and the
predictive power of the models, we calculated proportion of cultivated exotics was also positive in
marginal and conditional R-squared from the R Alt Empordà, albeit weaker than in South Africa
package MuMIn (Bartón 2019). To assess whether (Figure 2C). We found no significant association
response variables and derived model residuals between CV of plant height and the proportion of
were spatially autocorrelated, we calculated Mor- cultivated exotics in Alt Empordà (Figure 2D). For
an’s I with R package ape (Paradis and Schliep leaf area, we found positive associations between
2019). both CM and CV and the proportion of cultivated
We used independent Mann–Whitney U test for exotics in all locations (Figure 2E–F), except for CV
nonparametric samples to test for significant dif- in Alt Empordà, where the association was not
ferences in mean garden trait values between co- significant. Nonetheless, regression coefficients for
occurring cultivated exotics and all natives in each CM of leaf area decreased from more to less arid
location. Similarly, we used F-tests to test for dif- conditions. We found consistent effects of the
ferences in the distribution of mean garden trait proportion of cultivated exotics on functional
values between the two groups of species. We use diversity of the two South African cities (Johan-
the term ‘distribution’ here instead of ‘variance’ to nesburg and Tlokwe), thus supporting the inclu-
avoid confusion between variance across gardens sion of the two cities under the same region in our
(distribution) and variance across species (CV). We analyses (Appendix S5: Figure S6).
plotted density curves to visualize differences be- Co-occurring cultivated exotics were, on aver-
tween the two groups. We adopted a conservative age, showier than co-occurring natives (hereafter
approach and compared cultivated exotics versus only ‘cultivated exotics’ and ‘natives’), regardless of
all natives (rather than only cultivated natives) their location (Figure 3A, D, G; Appendix S5:
because a number of homeowners reported that Table S7). However, the variance in the distribu-
many desired natives grew spontaneously in their tion of plant showiness was greater among natives
gardens, and the distinction between ‘spontaneous’ than among cultivated exotics only in Alt Empordà,
and ‘cultivated’ natives was not always clear. and we found no significant differences in Min-
nesota or South Africa. Cultivated exotics were, on
average, shorter and had a narrower distribution of
RESULTS
plant height than natives in Minnesota (Figure 3B;
The model including the interaction between the Table S7), whereas the exact opposite pattern (that
proportion of cultivated exotics and the aridity in- is, taller cultivated exotics with greater distribution
dex was selected among the best models than natives) was observed in South Africa (Fig-
(DAICc < 2) for all response variables, except for ure 3H; Table S7). Alt Empordà showed a transient
CV of leaf area (Table 2). The coefficients of these state between the two. In this case, cultivated
interactions were negative in all cases (Table 2; exotics were taller on average than natives and
Appendix S5: Figure S5), indicating that the con- their distribution did not differ (Figure 3E;
tribution of the proportion of cultivated exotics in Table S7). Leaf area among cultivated exotics was,
increasing response variables was higher in more on average, larger and had a greater distribution
arid regions. The model including the logarithmic than natives in Alt Empordà (Figure 3F; Table S7),
proportion of cultivated exotics best-explained and South Africa (Figure 3I; Table S7). In Min-
variation in CV of leaf area. Moran’s I for model nesota, the distribution of leaf area was also greater
residuals indicated our predictor variables signifi- among cultivated exotics than among natives, but
cantly reduced the effect of spatial autocorrelation mean leaf area was larger among natives (Fig-
(Appendix S5: Table S6). ure 3C; Table S7). The highest trait distribution
overlap between cultivated exotics and nativesTable 2. Results from Candidate Linear Mixed-effects Models Predicting Functional Diversity.
Response variable Model K DAICc Wi Log(L) Marginal R2 Conditional R2 Model-averaged estimate Unconditional SE
Plant showinessCM M5 Cul. Exotics*Aridity 8 0 0.99 151.92 0.69 0.70 - 0.04 0.01
M4 Cul. Exotics + Aridity 7 9.51 0.01 146.13 0.66 0.68 n.a. n.a.
M2 Cul. Exotics 6 12.55 0 143.58 0.52 0.66 0.22 0.01
M3 Log(Cul. Exotics) 6 16.19 0 141.76 0.51 0.65 0.21 0.01
M0 Null 5 282.44 0 7.60 0.03 0.52 n.a. n.a.
M1 Aridity 6 284.49 0 7.60 0.03 0.53 0.10 0.02
J. P. Cubino and others
Plant heightCM M5 Cul. Exotics*Aridity 8 0 1 - 671.9 0.26 0.26 - 0.49 0.06
M3 Log(Cul. Exotics) 6 52.77 0 - 700.4 0.14 0.15 0.29 0.06
M2 Cul. Exotics 6 53.61 0 - 700.8 0.14 0.15 0.20 0.06
M4 Cul. Exotics + Aridity 7 55.65 0 - 700.8 0.14 0.15 n.a. n.a.
M0 Null 5 70.35 0 - 710.2 0.09 0.13 n.a. n.a.
M1 Aridity 6 72.19 0 - 710.1 0.11 0.14 - 0.19 0.11
Leaf areaCM M5 Cul. Exotics*Aridity 8 0 0.67 - 465.7 0.26 0.35 - 0.12 0.04
M3 Log(Cul. Exotics) 6 2.02 0.24 - 468.8 0.15 0.22 0.27 0.04
M2 Cul. Exotics 6 4.90 0.06 - 470.3 0.15 0.21 0.26 0.04
M4 Cul. Exotics + Aridity 7 6.22 0.03 - 469.9 0.30 0.41 n.a. n.a.
M0 Null 5 42.97 0 - 490.3 0.02 0.11 n.a. n.a.
M1 Aridity 6 43.89 0 - 489.8 0.07 0.13 0.13 0.11
Plant showinessVAR M5 Cul. Exotics*Aridity 8 0 0.79 8.51 0.05 0.05 - 0.03 0.01
M4 Cul. Exotics + Aridity 7 2.91 0.18 6.01 0.04 0.04 n.a. n.a.
M1 Aridity 6 8.28 0.01 2.30 0.03 0.04 - 0.09 0.02
M3 Log(Cul. Exotics) 6 8.95 0.01 1.96 0.09 0.18 0.04 0.81
M2 Cul. Exotics 6 9.87 0,01 1.51 0.08 0.18 0.03 0.01
M0 Null 5 10.12 0 0.36 0.07 0.16 n.a. n.a.
Plant heightVAR M5 Cul. Exotics*Aridity 8 0 1 - 1850 0.25 0.35 - 6.27 0.84
M0 Null 5 45.24 0 - 1876 0.08 0.19 n.a. n.a.
M1 Aridity 6 46.69 0 - 1875 0.14 0.21 1.29 2.97
M2 Cul. Exotics 6 47.26 0 - 1876 0.08 0.19 - 0.88 0.85
M3 Log(Cul. Exotics) 6 47.29 0 - 1876 0.08 0.19 0.04 0.81
M4 Cul. Exotics + Aridity 7 48.39 0 - 1875 0.16 0.22 n.a. n.a.
Leaf areaVAR M3 Log(Cul. Exotics) 6 0 0.67 - 1005 0.16 0.21 0.83 0.13
M2 Cul. Exotics 6 2.67 0.18 - 1006 0.15 0.21 0.82 0.13
M5 Cul. Exotics*Aridity 8 4.30 0.08 - 1005 0.25 0.32 - 0.19 0.13
M4 Cul. Exotics + Aridity 7 4.36 0.08 - 1006 0.27 0.35 n.a. n.a.
M0 Null 5 36.15 0 - 1024 0.04 0.10 n.a. n.a.
M1 Aridity 6 37.45 0 - 1024 0.07 0.12 0.47 0.35
*For each model, the number of parameters (K), the change in small-sample-size-corrected Akaike information relative to the best model (DAICc), the model weight (wi), the log-likelihood (Log(L)), the marginal and conditional R-squared
are given. Models within two DAICc points of the top model are shown in bold. We also present model-averaged estimates and unconditional SE for each explanatory variable of interest incorporated into the whole set of models.
Unconditional confidence intervals that do not overlap zero are shown in bold (see also Appendix S5: Figure S5). All models include ‘city’ nested within ‘region’ as random effect and ‘garden area’ (log-transformed) as fixed effect (not
shown). Aridity = aridity index. CM = community mean; CV = community variance; n.a. = not applicable.Cultivated exotics affect functional diversity
Figure 2. Relationship between the mean (top row) and variance (bottom row) of the three plant traits (that is, plant
showiness, plant height, and leaf area) and the proportion (%) of cultivated exotics in domestic gardens. In each plot, points
and linear regressions are colored according to ‘region’. Blue colors represent cooler and wetter conditions (that is,
Minnesota), red colors represent warmer and drier conditions (that is, central South Africa), and violet colors intermediate
conditions between the two (that is, Alt Empordà). Shaded areas indicate 95% confidence intervals. Standardized
regression coefficients (b), and adjusted R2 are also provided. *, ** and *** indicate significant interactions at P < 0.05, 0.01,
and 0.001, respectively.
across locations was for leaf area, and the lowest for gardens consistently contained showier (more col-
plant showiness (Figure 3). orful) flowers, fruits, and leaves with increased
The proportion of gardens where CM and CV of relative number of cultivated exotics. In addition,
each trait was higher among cultivated exotics than co-occurring cultivated exotics were, on average,
among natives tended to increase with more arid more colorful than co-occurring natives, and the
conditions, except for CM of plant showiness that distribution of plant showiness between the two
remained constant (see stacked bar plots in Fig- groups of species showed little overlap (< 25%).
ure 3). These findings confirm that ornamental exotics
largely contribute to increasing visual attractive-
ness in private urban landscapes (Bigirimana and
DISCUSSION
others 2012; Avolio and others 2019) and that
Using a transcontinental dataset, our study showed combinations of native species in gardens are no-
that increased proportions of cultivated exotics had tably less showy than gardens composed of culti-
contrasting effects on different plant traits related vated exotics. Nonetheless, a large number of
to the visual aesthetics of suburban domestic gar- natives had higher values of plant showiness than
dens. Following our initial hypothesis, and across cultivated exotics at the regional level for all three
three suburban areas in the USA, Spain, and South locations (Appendix S5: Figure S7), which indicates
Africa, we found that the vegetation in domestic that there is potential to create combinations ofJ. P. Cubino and others
Cultivated exotics affect functional diversity
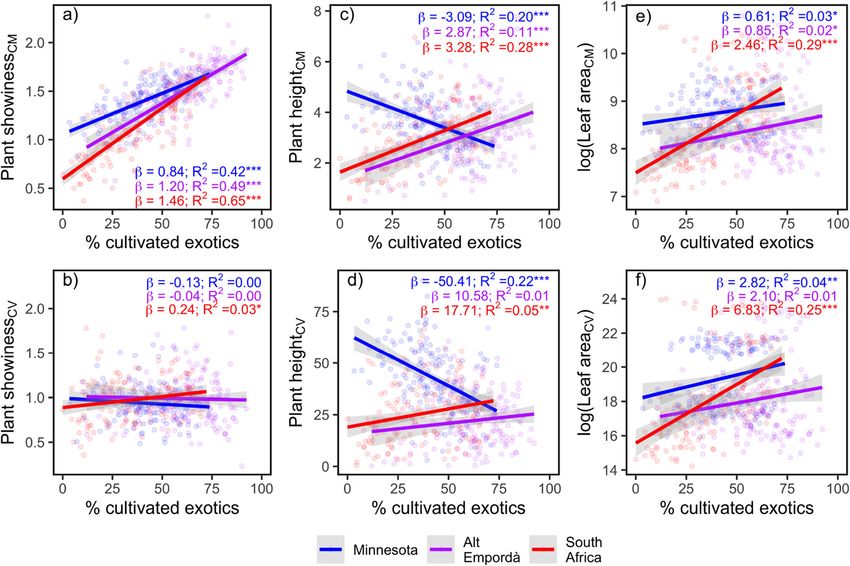
b Figure 3. Density curves for community means (CM) of nesota resulted in co-occurring natives being taller,
the three plant traits (that is, plant showiness, plant with greater variance in plant height, and broader
height, and leaf area) separately for cultivated exotics leaves than co-occurring cultivated exotics,
and natives in domestic gardens in Minnesota (a-c), Alt whereas the opposite was true for the semi-arid
Empordà (d–f), and central South Africa (g-i). The
central area of South Africa. Moreover, gardens in
proportion (%) of overlap between the two groups of
co-occurring species is provided next to the density
Alt Empordà, with its intermediate arid conditions,
curves. Stacked bar plots in the bottom panels represent showed a transition state between these two re-
the proportion of gardens in each region where the mean gions. Thus, cultivated exotic and native plants
or the variance of each particular trait was higher among seemed to be combined in domestic gardens to
cultivated exotics than among natives encompass a range of growth forms and sizes that
(spontaneous + cultivated). promoted greater structural diversity, a pattern
shown to be preferred by homeowners in a number
of studies (Ulrich 1986; Kaplan and Kaplan 1989;
Williams 2002). Further exploration of the differ-
natives that are showier than cultivated exotics. ences between functional diversity of cultivated
However, such combinations of native species exotics and natives among social and cultural
might not be realizable if other traits such as groups would require fine-scale data, such as
growth form, plant shape, and size, or time of household income, age, and cultural background,
flowering, which we did not include in our study, collected throughout different regions.
are more important in explaining planting deci- The increase in flower, fruit, and leaf showiness
sions. In fact, the creation of ‘beauty’ in domestic in gardens as a consequence of the cultivation of
gardens is achieved by combining plants with dif- exotic species might have implications beyond the
ferent desired traits, including showiness or provision of cultural ecosystem services such as
attractiveness, but also care, neatness or natural- aesthetics or recreation. For instance, some crucial
ness (Clayton 2007; Marco and others 2010; Ken- ecosystem functions, such as pollination or the
dal and others 2012a; Goodness and others 2016). provision of food and habitat to natural wildlife,
These traits are usually chosen from among the can be both positively and negatively affected
pool of available ornamental species in nurseries or (Pyšek and others 2012; Johnson and others 2017).
garden centers (Padullés Cubino and others 2015; On the one hand, (showy) cultivated exotics can
Cavender-Bares and others 2020), which is com- positively increase pollinator services by sustaining
posed primarily of exotic species. Thus, given the large pollinator populations (Haaland and others
importance of nurseries in filling homeowners’ 2011), increase native plant genetic diversity via
demand for garden cultivars, and both availability hybridization (Stockwell and others 2003), or help
and prices driving cultivated plant’s likelihood of provide biotic resistance to invasion (Levine and
becoming invasive (Dehnen-Schmutz and others others 2004). On the other hand, cultivated exotics
2007), there is the need for more knowledge of the can also induce a reduction of pollinator popula-
factors that drive decision-making in the regional tions because of a loss of specialist pollinators or
to global horticultural industry. increased heterospecific pollen deposition (Ashman
Consistent with our initial hypothesis, the effect and Arceo-Gómez 2013), decrease native plant
of cultivated exotics on the mean and variance of genetic diversity via gene flow (Selbo and Snow
plant height, and mean leaf area, was mediated by 2005) or facilitate the transmission of novel pests
water stress (that is, aridity), with greater positive and pathogens (McArt and others 2014). Likewise,
effects of cultivated exotics in more arid (hotter and increased plant height and leaf area in domestic
drier) regions. We expected this because, although gardens can also induce changes in a number of
native vegetation in more arid regions is usually ecosystem services, besides visual attractiveness.
dominated by short shrubs, dry grasses, and other For instance, although a wider range of plant
small-leaved and drought-tolerant species (Shmida heights and leaf sizes can increase CO2 sequestra-
1985), human management in the form of irriga- tion, improve air quality, facilitate more efficient
tion can compensate for the lack of precipitation in light interception, and help regulate water balance,
gardens (Kendal and others 2012b; Padullés Cubi- it can also increase water requirements, produce
no and others 2019), and help create new ecolog- larger amounts of allergens, or generate unwanted
ical niches that can potentially be filled by taller litter (Westoby and others 2002; Cameron and
and broader-leaved cultivated exotics. Accordingly, others 2012). Therefore, trade-offs between
the cold and humid continental climate in Min- ecosystem services and disservices provided by
cultivated exotics can create conflicts over whetherJ. P. Cubino and others to manage for the former or the latter, and the local scale, at very broad scales (for example, integration of the two requires an assessment of the transcontinental), intraspecific trait variation is demands of human beneficiaries (Milanović and minimized and likely does not have a strong effect others 2020). on community-level trait values (that is, inter- Although we calculated the functional diversity specific trait variation) (Albert and others 2011). of domestic gardens for individual plant traits, Similarly, the taxonomic classification of garden ecosystem function and associated services might plants at the species level excludes the possibility of not be the expression of just one trait but the accounting for trait variation among cultivars and aggregate of multiple traits within a category. These subspecies, which can also respond to human complex trait-service associations can be useful for preferences. We also note that trait availability was identifying the different trait combinations that can relatively low for our study species, especially support a variety of ecosystem services in the urban among cultivated taxa and for leaf area (58% of landscape. For example, research has shown that total species). Although we believe these limita- general aesthetic appreciation of plants is associated tions were largely mitigated by using an extensive with large, spreading canopies, showy flowers, and dataset with 1863 species, and trait imputation broad-shaped foliage (for example, Williams 2002; techniques (Appendix S3), the collection and Kendal and others 2012a; Goodness and others publication of additional trait data, particularly 2016). Accordingly, our study indicates that the from species in urban habitats, and the use of combination of these traits captures meaningful standardized measures of species abundances, aspects of aesthetic ecosystem services, as gardens would allow further corroboration of our conclu- with a higher proportion of cultivated exotics sions. hosted showier and taller vegetation with larger Overall, our study indicates that cultivated exo- leaves, resulting in overall higher aesthetic appeal. tics play an important role in increasing the visi- However, a consistent positive effect of cultivated bility and aesthetic value of domestic gardens, with exotics on the diversity of the three studied traits concomitant potential impacts on associated was only detected in more arid regions, highlight- ecosystem services and disservices. However, this ing that linkages between multiple traits and ser- role varied across regions of different aridity, indi- vices of cultivated species are not necessarily cating that the effects of cultivated exotics on urban universal and that these linkages may differ widely ecosystem function is likely to intensify with or have specific nuances across cultures and geo- ongoing urban expansion, and climate change, as graphic locations. In addition, homeowners select many regions are projected to become hotter and for plant traits associated with a wide range of drier by the end of the 21st century (IPCC 2014). If ecosystem services types, from cultural (including cities become more arid, it is possible that certain aesthetics and symbolic meanings), to provisioning services may be augmented, reduced, or elimi- (utility and food) and regulating and supporting nated. Likewise, new contributions may be added (environmental suitability, native vegetation, and to the list of urban-based ecosystem services, as the resource use) (Larson and others 2016). Therefore, structure and trait composition of urban vegetation considering the interaction among multifunctional changes. These changes can be associated with landscape goals, homeowners’ management activ- gains and losses of particular sets of cultivated ities (for example, watering and selective plant re- exotics with specific traits selected for by humans. moval), and climate, is essential for promoting In addition, climate change is likely to be a key diverse garden plant communities that maximize driver in the local extirpation of many native spe- targeted services while also supporting low-main- cies, thereby emphasizing the importance of tenance native species that are adapted to the local developing sustainable urbanization strategies that environment. reconcile the cost-benefits of exotics species, as Our study relied on mean species trait values they relate to ecosystem services and the conser- collated from global databases for two of the three vation of native biodiversity. In more arid land- traits studied. We thus acknowledge that the trait- scapes, strategies that enhance water provision in based results from our study do not specifically urban areas can also promote biodiversity and the capture trait variation in our urban populations, benefits associated with it, as well as enhance the which are often exposed to unique selection pres- resilience of urban areas to the effects of climate sures that can uniquely influence the expression of change. Finally, as the imports of ornamental live- different phenotypes (for example, Cheptou and plants continue to increase globally (van Kleunen others 2008). Although these differences can and others 2018), a better understanding of the strongly influence trait patterns within sites at the different garden fashions and the factors that drive
Cultivated exotics affect functional diversity

decision-making in the horticultural industry can                  Aronson MF, Nilon CH, Lepczyk CA, Parker TS, Warren PS,
help us predict the future effects of cultivated                     Cilliers SS, Goddard MA, Hahs AK, Herzog C, Katti M. 2016.
                                                                     Hierarchical filters determine community assembly of urban
exotic species on ecosystem function and the pro-                    species pools. Ecology 97:2952–63.
visioning of ecosystem services.                                   Aronson MFJ, La Sorte FA, Nilon CH, Katti M, Goddard MA,
                                                                     Lepczyk CA, Warren PS, Williams NSG, Cilliers S, Clarkson B,
ACKNOWLEDGEMENTS                                                     Dobbs C, Dolan R, Hedblom M, Klotz S, Kooijmans JL, Kuhn
                                                                     I, MacGregor-Fors I, McDonnell M, Mortberg U, Pysek P,
This paper resulted from a series of workshops held                  Siebert S, Sushinsky J, Werner P, Winter M. 2014. A global
at German Centre for Integrative Biodiversity Re-                    analysis of the impacts of urbanization on bird and plant
search (iDiv) Halle-Jena-Leipzig, Germany, which                     diversity reveals key anthropogenic drivers. Proceedings of the
was funded by sDiv (Working group: sUrBioCity–                       Royal Society B: Biological Sciences 281:20133330.
Deciphering Drivers of Urban Biodiversity across                   Ashman T-L, Arceo-Gómez G. 2013. Toward a predictive
                                                                     understanding of the fitness costs of heterospecific pollen re-
Multiple Scales). We thank botanists involved in                     ceipt and its importance in co-flowering communities.
field sampling and homeowners for giving per-                        American Journal of Botany 100:1061–70.
mission to sample in their gardens.                                Avolio M, Pataki DE, Jenerette GD, Pincetl S, Clarke LW,
                                                                     Cavender-Bares J, Gillespie TW, Hobbie SE, Larson KL,
DATA AVAILABILITY STATEMENT                                          McCarthy HR, Trammell TLE. 2019. Urban plant diversity in
                                                                     Los Angeles, California: Species and functional type turnover
Datasets are publicly available for domestic gardens                 in cultivated landscapes. Plants People Planet:ppp3.10067.
in Spain (https://doi.org/10.6084/m9.figshare.770                  Avolio ML, Pataki DE, Gillespie TW, Jenerette GD, McCarthy
4563.v1), the USA (https://doi.org/10.6073/pasta/a                   HR, Pincetl S, Weller Clarke L. 2015. Tree diversity in
9765d8a1d4ea8840490d454dba3d6e7; https://doi.                        southern California’s urban forest: the interacting roles of
                                                                     social and environmental variables. Frontiers in Ecology and
org/10.13020/89ae-2877), and South Africa (http                      Evolution 3. http://journal.frontiersin.org/Article/10.3389/fe
s://doi.org/10.6084/m9.figshare.12890645.v1).                        vo.2015.00073/abstract. Last accessed 21/11/2017.
                                                                   Avolio ML, Pataki DE, Trammell TLE, Endter-Wada J. 2018.
                                                                     Biodiverse cities: The nursery industry, homeowners, and
OPEN ACCESS                                                          neighborhood differences drive urban tree composition. Eco-
                                                                     logical Monographs 88:259–76.
This article is licensed under a Creative Commons                  Bartón K. 2019. MuMIn: Multi-Model Inference. R package
Attribution 4.0 International License, which per-                    version 1.43.6. https://CRAN.R-project.org/package=MuMIn
mits use, sharing, adaptation, distribution and                    de Bello F, Lavorel S, Dı́az S, Harrington R, Cornelissen JHC,
reproduction in any medium or format, as long as                     Bardgett RD, Berg MP, Cipriotti P, Feld CK, Hering D, Martins
you give appropriate credit to the original author(s)                da Silva P, Potts SG, Sandin L, Sousa JP, Storkey J, Wardle DA,
                                                                     Harrison PA. 2010. Towards an assessment of multiple
and the source, provide a link to the Creative                       ecosystem processes and services via functional traits. Biodi-
Commons licence, and indicate if changes were                        vers Conserv 19:2873–93.
made. The images or other third party material in                  Bigirimana J, Bogaert J, De Cannière C, Bigendako M-J, Par-
this article are included in the article’s Creative                  mentier I. 2012. Domestic garden plant diversity in Bujum-
Commons licence, unless indicated otherwise in a                     bura, Burundi: Role of the socio-economical status of the
credit line to the material. If material is not in-                  neighborhood and alien species invasion risk. Landscape and
                                                                     Urban Planning 107:118–26.
cluded in the article’s Creative Commons licence
                                                                   Bolós O, Vigo J, Masallés RM, Ninot JM. 2005. Flora manual dels
and your intended use is not permitted by statutory                  Paı̈sos Catalans. 3rd edn. Barcelona: Editorial Pòrtic.
regulation or exceeds the permitted use, you will                  Cade BS. 2015. Model averaging and muddled multimodel
need to obtain permission directly from the copy-                    inferences. Ecology 96:2370–82.
right holder. To view a copy of this licence, visit h              Cameron RWF, Blanuša T, Taylor JE, Salisbury A, Halstead AJ,
ttp://creativecommons.org/licenses/by/4.0/.                          Henricot B, Thompson K. 2012. The domestic garden – Its
                                                                     contribution to urban green infrastructure. Urban Forestry &
REFERENCES                                                           Urban Greening 11:129–37.
                                                                   Cavender-Bares J, Padullés Cubino J, Pearse WD, Hobbie SE,
Acar C, Acar H, Eroğlu E. 2007. Evaluation of ornamental plant      Lange AJ, Knapp S, Nelson KC. 2019. Horticultural avail-
  resources to urban biodiversity and cultural changing: A case      ability and homeowner preferences drive plant diversity and
  study of residential landscapes in Trabzon city (Turkey).          composition in urban yards. https://doi.org/10.13020/89ae-2
  Building and Environment 42:218–29.                                877.
Albert CH, Grassein F, Schurr FM, Vieilledent G, Violle C. 2011.   Cavender-Bares J, Padullés Cubino J, Pearse WD, Hobbie SE,
  When and how should intraspecific variability be considered        Lange AJ, Knapp S, Nelson KC. 2020. Horticultural avail-
  in trait-based plant ecology? Perspectives in Plant Ecology,       ability and homeowner preferences drive plant diversity and
  Evolution and Systematics 13:217–25.                               composition in urban yards. Ecol Appl:eap.2082.
Anderson DR. 2008. Model based inference in the life sciences: A   Cayuela L, Stein A, Oksanen J. 2017. Taxonstand: Taxonomic
  prime on evidence. New York: Springer.                             Standardization of Plant Species Names. R package version 20.
J. P. Cubino and others
https://CRAN.R-project.org/package=Taxonstand. Last ac- Hijmans R. 2019. raster: Geographic Data Analysis and Model-
cessed 05/09/2017. ing. https://CRAN.R-project.org/package=raster.
Cheptou P-O, Carrue O, Rouifed S, Cantarel A. 2008. Rapid IPCC. 2014. Climate Change 2014: Synthesis Report. Contribu-
evolution of seed dispersal in an urban environment in the tion of Working Groups I, II and III to the Fifth Assessment
weed Crepis sancta. Proceedings of the National Academy of Report of the Intergovernmental Panel on Climate Change
Sciences 105:3796–9. [Core Writing Team, R.K. Pachauri and L.A. Meyer (eds.)].
Clayton S. 2007. Domesticated nature: Motivations for garden- IPCC, Geneva, Switzerland.
ing and perceptions of environmental impact. Journal of Johnson AL, Fetters AM, Ashman T-L. 2017. Considering the
Environmental Psychology 27:215–24. unintentional consequences of pollinator gardens for urban
Cook-Patton SC, Agrawal AA. 2014. Exotic plants contribute native plants: Is the road to extinction paved with good
positively to biodiversity functions but reduce native seed intentions? New Phytol 215:1298–305.
production and arthropod richness. Ecology 95:1642–50. Kaplan R, Kaplan S. 1989. The Experience of Nature: A Psy-
Cornelissen JHC, Lavorel S, Garnier E, Dı́az S, Buchmann N, chological Perspective. Cambridge: Cambridge University
Gurvich DE, Reich PB, ter Steege H, Morgan HD, van der Press.
Heijden MGA, Pausas JG, Poorter H. 2003. A handbook of Kaufman AJ, Lohr VI. 2004. Does plant color affect emotional
protocols for standardised and easy measurement of plant and physiological responses to landscapes? Acta Hortic:229–
functional traits worldwide. Aust J Bot 51:335. 33.
Dehnen-Schmutz K, Touza J, Perrings C, Williamson M. 2007. Kendal D, Williams KJH, Williams NSG. 2012a. Plant traits link
The Horticultural Trade and Ornamental Plant Invasions in people’s plant preferences to the composition of their gardens.
Britain. Conservation Biology 21:224–31. Landscape and Urban Planning 105:34–42.
Dı́az S, Kattge J, Cornelissen JHC, Wright IJ, Lavorel S, Dray S, Kendal D, Williams NSG, Williams KJH. 2012b. A cultivated
Reu B, Kleyer M, Wirth C, Colin Prentice I, Garnier E, Bönisch environment: Exploring the global distribution of plants in
G, Westoby M, Poorter H, Reich PB, Moles AT, Dickie J, Gil- gardens, parks and streetscapes. Urban Ecosystems 15:637–52.
lison AN, Zanne AE, Chave J, Joseph Wright S, Sheremet’ev van Kleunen M, Essl F, Pergl J, Brundu G, Carboni M, Dullinger
SN, Jactel H, Baraloto C, Cerabolini B, Pierce S, Shipley B, S, Early R, González-Moreno P, Groom QJ, Hulme PE, Kueffer
Kirkup D, Casanoves F, Joswig JS, Günther A, Falczuk V, C, Kühn I, Máguas C, Maurel N, Novoa A, Parepa M, Pyšek P,
Rüger N, Mahecha MD, Gorné LD. 2016. The global spectrum Seebens H, Tanner R, Touza J, Verbrugge L, Weber E, Dawson
of plant form and function. Nature 529:167–71. W, Kreft H, Weigelt P, Winter M, Klonner G, Talluto MV,
Fick SE, Hijmans RJ. 2017. WorldClim 2: new 1-km spatial Dehnen-Schmutz K. 2018. The changing role of ornamental
resolution climate surfaces for global land areas: New climate horticulture in alien plant invasions: Horticulture and plant
surfaces for global land areas. Int J Climatol 37:4302–15. invasions. Biol Rev 93:1421–37.
Germishuizen G, Meyer NL, Steenkamp Y, Keith M. 2006. A Larson KL, Nelson KC, Samples SR, Hall SJ, Bettez N, Cavender-
checklist of South African plants. Southern African Botanical Bares J, Groffman PM, Grove M, Heffernan JB, Hobbie SE,
Diversity Network Report No. 41. Pretoria, South Africa: Learned J, Morse JL, Neill C, Ogden LA, O’Neil-Dunne J,
SABONET. Pataki DE, Polsky C, Chowdhury RR, Steele M, Trammell TLE.
Glen HF. 2002. Cultivated plants of southern Africa. Johannes- 2016. Ecosystem services in managing residential landscapes:
burg: Jacana. Priorities, value dimensions, and cross-regional patterns. Ur-
Goodness J. 2018. Urban landscaping choices and people’s ban Ecosystems 19:95–113.
selection of plant traits in Cape Town, South Africa. Envi- Levine JM, Adler PB, Yelenik SG. 2004. A meta-analysis of biotic
ronmental Science & Policy 85:182–92. resistance to exotic plant invasions: Biotic resistance to plant
invasion. Ecology Letters 7:975–89.
Goodness J, Andersson E, Anderson PML, Elmqvist T. 2016.
Exploring the links between functional traits and cultural Lindemann-Matthies P, Bose E. 2007. Species richness, struc-
ecosystem services to enhance urban ecosystem management. tural diversity and species composition in meadows created by
Ecological Indicators 70:597–605. visitors of a botanical garden in Switzerland. Landscape and
Urban Planning 79:298–307.
Goolsby EW, Bruggeman J, Ané C. 2017. Rphylopars : fast
multivariate phylogenetic comparative methods for missing Loram A, Thompson K, Warren PH, Gaston KJ. 2008. Urban
data and within-species variation. Fitzjohn R, editor. Methods domestic gardens (XII): The richness and composition of the
in Ecology and Evolution 8:22–7. flora in five UK cities. Journal of Vegetation Science 19:321–
30.
Groffman PM, Grove JM, Polsky C, Bettez ND, Morse JL,
Cavender-Bares J, Hall SJ, Heffernan JB, Hobbie SE, Larson Lubbe CS, Siebert SJ, Cilliers SS. 2010. Political legacy of South
KL, Neill C, Nelson K, Ogden L, O’Neil-Dunne J, Pataki D, Africa affects the plant diversity patterns of urban domestic
Chowdhury RR, Locke DH. 2016. Satisfaction, water and gardens along a socio-economic gradient. Scientific Research
fertilizer use in the American residential macrosystem. Envi- and Essays 5:2900–10.
ronmental Research Letters 11:034004. Marco A, Barthelemy C, Dutoit T, Bertaudière-Montes V. 2010.
Haaland C, Naisbit RE, Bersier L-F. 2011. Sown wildflower strips Bridging Human and Natural Sciences for a Better Under-
for insect conservation: A review: Wildflower strips for insect standing of Urban Floral Patterns: the Role of Planting Prac-
conservation. Insect Conservation and Diversity 4:60–80. tices in Mediterranean Gardens. Ecology and Society 15. h
ttp://www.ecologyandsociety.org/vol15/iss2/art2/. Last ac-
van Heezik Y, Freeman C, Porter S, Dickinson KJM. 2013.
Garden size, householder knowledge, and socio-economic cessed 29/01/2019.
status influence plant and bird diversity at the scale of indi- Mazerolle MJ. 2019. AICcmodavg: Model selection and multi-
vidual gardens. Ecosystems 16:1442–54. model inference based on (Q)AIC(c). R package version 2.2-2
https://cran.r-project.org/package=AICcmodavg.You can also read