Space and space-time distributions of dengue in a hyper-endemic urban space: the case of Girardot, Colombia
←
→
Page content transcription
If your browser does not render page correctly, please read the page content below
Fuentes-Vallejo BMC Infectious Diseases (2017) 17:512
DOI 10.1186/s12879-017-2610-7

 RESEARCH ARTICLE                                                                                                                                Open Access

Space and space-time distributions of
dengue in a hyper-endemic urban space:
the case of Girardot, Colombia
Mauricio Fuentes-Vallejo1,2

  Abstract
  Background: Dengue is a widely spread vector-borne disease. Dengue cases in the Americas have increased over
  the last few decades, affecting various urban spaces throughout these continents, including the tourism-oriented
  city of Girardot, Colombia. Interactions among mosquitoes, pathogens and humans have recently been examined
  using different temporal and spatial scales in attempts to determine the roles that social and ecological systems
  play in dengue transmission. The current work characterizes the spatial and temporal behaviours of dengue in
  Girardot and discusses the potential territorial dynamics related to the distribution of this disease.
  Methods: Based on officially reported dengue cases (2012–2015) corresponding to epidemic (2013) and inter-
  epidemic years (2012, 2014, 2015), space (Getis-Ord index) and space-time (Kulldorff’s scan statistics) analyses were
  performed.
  Results: Geocoded dengue cases (n = 2027) were slightly overrepresented by men (52.1%). As expected, the cases
  were concentrated in the 0- to 15-year-old age group according to the actual trends of Colombia. The incidence
  rates of dengue during the rainy and dry seasons as well as those for individual years (2012, 2013 and 2014) were
  significant using the global Getis-Ord index. Local clusters shifted across seasons and years; nevertheless, the incidence
  rates clustered towards the southwest region of the city under different residential conditions. Space-time clusters
  shifted from the northeast to the southwest of the city (2012–2014). These clusters represented only 4.25% of the total
  cases over the same period (n = 1623). A general trend was observed, in which dengue cases increased during the dry
  seasons, especially between December and February.
  Conclusions: Despite study limitations related to official dengue records and available fine-scale demographic
  information, the spatial analysis results were promising from a geography of health perspective. Dengue did
  not show linear association with poverty or with vulnerable peripheral spaces in intra-urban settings, supporting
  the idea that the pathogenic complex of dengue is driven by different factors. A coordinated collaboration of
  epidemiological, public health and social science expertise is needed to assess the effect of “place” from a relational
  perspective in which geography has an important role to play.
  Keywords: Spatial analysis, Urban space, Dengue, Colombia

Correspondence: mauricio.fuentes@fsfb.org.co
1
 Fundación Santa Fe de Bogotá, Bogotá, Colombia
2
 Laboratory of Social Dynamics and Spatial Reconstruction (LADYSS), Paris,
France

                                        © The Author(s). 2017 Open Access This article is distributed under the terms of the Creative Commons Attribution 4.0
                                        International License (http://creativecommons.org/licenses/by/4.0/), which permits unrestricted use, distribution, and
                                        reproduction in any medium, provided you give appropriate credit to the original author(s) and the source, provide a link to
                                        the Creative Commons license, and indicate if changes were made. The Creative Commons Public Domain Dedication waiver
                                        (http://creativecommons.org/publicdomain/zero/1.0/) applies to the data made available in this article, unless otherwise stated.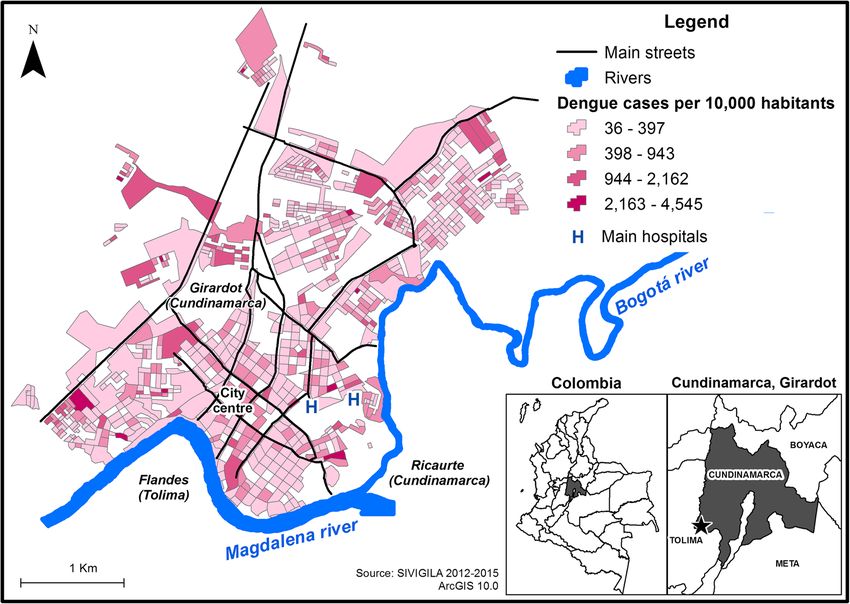
Fuentes-Vallejo BMC Infectious Diseases (2017) 17:512                                                          Page 2 of 16

Background                                                    1971 and 2010, totalling more than 1 million cases of
Dengue is a vector-borne disease that is widely spread. A     dengue (annual average of 30,928 cases).
recent estimate [1] indicated that 390 million dengue in-
fections occur every year (95% CIs = 284–528 million),        Dengue in urban spaces
of which 96 million (95% CIs = 67–136 million) people         The theoretical framework of mosquito-transmitted dis-
manifest clinically severe forms of the disease. It is also   eases has evolved over the last few decades as a product
predicted that dengue will be ubiquitous throughout the       of the permanent assessment of the new interactions be-
tropics, with specific local risk variations influenced by    tween vectors and human biology. One issue that has ac-
rainfall, temperature and the degree of urbanization. Al-     companied the evolution of these theoretical models
though specific-type immunity follows dengue virus in-        concerns the spatial and temporal dynamics of the trans-
fection, an uneven spatial and temporal circulation           mission now considered heterogeneous (i.e., the interac-
exists regarding the four virus serotypes of dengue,          tions among mosquitoes, pathogens and human beings
resulting in endemic and epidemic transmission. Ac-           can predict different results). This issue has led to the
cording to the clinical manifestations of the disease, den-   analysis of transmission at different temporal and spatial
gue is classified as either non-severe (with or without       scales and the roles of social and ecological systems; in
warning signs) or severe, which includes the life-threating   other words, “Emerging theory focuses attention on the
manifestations of the disease [2].                            ecological and social context for mosquito blood feeding,
   The Americas have reported an increase in cases over       the movement of both hosts and mosquitoes, and the
the past 30 years and local transmission has been             relevant spatial scales for measuring transmission and
reported over the entire region, excluding Canada,            for modeling dynamics and control” [11].
Uruguay, and Chile [3, 4]. In 2013, more than 2 million          Nevertheless, different studies have shown opposite re-
dengue cases were reported in the Americas (of which          sults regarding the possible relationships between the inci-
32,270 cases were severe), resulting in an incidence of       dence of dengue and the presence of vector mosquitoes,
404.35 per 100,000 people and 1175 deaths (case fatality      socioeconomic conditions, urban morphology, and the
rate = 0.05%) [4]. The dengue mosquito vectors Aedes          knowledge, attitudes and practices of a population. These
albopictus and Aedes aegypti are both present in the          relationships remain to be established [12–16]. Vector
Americas, although the latter predominates, represent-        control strategies have also been assessed, revealing that a
ing a major public health concern because it is also the      unique effective and generalized prevention strategy that
vector associated with recent and rapidly spreading           can sufficiently address dengue transmission in urban set-
diseases such as chikungunya [5] and Zika [6]. During         tings does not exist [17]. Hence, the spatial dimension has
the 1950s and part of the 1960s, great efforts were           been recognized as essential to better understand the
undertaken to eradicate the vector Aedes aegypti from         transmission of diseases such as dengue [11]. Geography
the Americas as part of the yellow fever eradication          itself has played a role in this debate via the classical
initiatives [7]. The weakening of surveillance systems        works of Maximilien Sorre [18] and, more recently, with
and vector control programmes led to the re-infestation       analyses of dengue discussing how particular configura-
of Aedes aegypti over time, causing periodic outbreaks        tions of each urban space influence the spatial pattern of
that now occur cyclically every three to 5 years [8].         the disease [7, 15, 16, 19, 20].
Dengue is characterized as an emerging and re-emerging           Based on officially reported dengue cases (2012–2015)
disease, and it has become a major public health prob-        corresponding to epidemic (2013) and inter-epidemic
lem because of its disease burden and the economic            years (2012, 2014, 2015), the current work sought to
impact it has on the region [8–10].                           characterize the spatial and temporal behaviours of den-
   Aedes aegypti is widespread in Colombia at altitudes       gue in Girardot, Colombia. Moreover, it discusses the
less than 1800 m above sea level (MASL), and dengue is        potential territorial dynamics related to the distribution
endemic throughout most of the country. Unlike other          of this disease.
countries of the region, Colombia reports cases through-
out the year, with increases during the rainy seasons [4].    Study area: Girardot in a regional setting
It is estimated that more than half of the country’s popu-    Girardot is located 134 km southwest of Bogotá (2 h’
lation (approximately 24 of the total 46 million people)      drive), 289 MASL. Girardot belongs to the Department
live in areas environmentally susceptible to dengue virus     of Cundinamarca, but it shares natural (the Bogotá and
transmission [8]. According to Padilla [8], the number of     Magdalena Rivers) and administrative limits with the
cases and municipalities reporting dengue has increased       Department of Tolima. Girardot is the most important
over recent decades, whereas 66% of the country’s muni-       city in its province; it has a population of 105,085 inhabi-
cipalities (n = 1112) reported cases in 2010. Twelve den-     tants, of whom 96.6% are concentrated in a 20-km2 urban
gue epidemics were registered in Colombia between             area [21, 22]. Girardot has undergone a conurbation
Fuentes-Vallejo BMC Infectious Diseases (2017) 17:512                                                         Page 3 of 16

process with its neighbouring municipalities Ricaurte and    (n = 1112) that accumulated 50% of dengue cases in
Flandes (Department of Tolima). This process has engen-      Colombia (1999–2010) [8].
dered urban growth, which influences functional changes         Girardot is a growing tourism-oriented city with an in-
from rural to urban structures with recreational, com-       fluence over surrounding municipalities including non-
merce and service functions [23]. Characterized by a bi-     endemic cities such as Bogotá. Additionally, Girardot is
modal rain regime, the two rainy seasons occur from          situated in a hyper-endemic region for dengue transmis-
March to May and from October to November. The mean          sion. Although urban growth and tourism have been
precipitation is 1220 mm, with relative humidity of 66.4%    considered as important factors of dengue transmission
and a mean temperature of 33.3 °C.                           elsewhere [4, 19, 26, 27], insufficient evidence is available
   Habituated to the constant population flux, the city      about these factors for Colombian cities.
provides services such as hotels and holiday centres, and
it has evolved as an attractive municipality for the “sec-   Methods
ond residences” of inhabitants of other municipalities       Sources and treatment of information
(primarily Bogotá) for recreational purposes. As a result,   Information sources and the processes applied to perform
the urban area of Girardot includes 5000 beds in more        a spatial analysis are described below. The obligatory case
than 40 hotels and 55 closed residential areas (“condo-      report database from 2012 to 2015 (SIVIGILA), block
minios” and “conjuntos residenciales”), primarily used as    population information (Census 2005) and meteorological
secondary or vacation residences [24]. At the periphery      information (temperature and precipitation, 2012–2015)
of the urban area, extensive vacation/residential com-       were used.
plexes are common, including El Peñon, which has
approximately 900 houses. The city also provides admin-      SIVIGILA
istrative services to the province of Alto Magdalena as      In Colombia, dengue cases are reported through the na-
well as the Department of Cundinamarca, grouping all         tional public health surveillance system (SIVIGILA).
types of environmental, tax collection and justice func-     Cases are identified and reported by the healthcare sys-
tions among others. Although its educational provision       tem, classifying the event as either probable dengue or
has been characterized as weak, the municipality does        probable severe dengue (depending on clinical observa-
provide basic and higher education, such as university       tion) [2, 28].
programmes, to the region [24]. Health service infra-          The challenges of using this type of information have
structure is also an important characteristic of Girar-      been discussed in Colombia [29] and in other countries
dot’s regional primacy, including a high-complexity          [15, 30, 31]. Reported cases correspond only to symp-
(3rd level) hospital that serves as a departmental re-       tomatic patients who present at healthcare centres, and
ferral centre [25].                                          they are registered with their residence addresses that
   According to official records, approximately 23% of re-   are not necessarily the places of transmission. In
ported dengue cases are residents from other municipal-      addition, the SIVIGILA database does not contain spe-
ities, including the non-dengue-endemic settlements of       cific serotype infection information.
the Andean region that are located at higher than 1800         The geocoding of dengue cases in Girardot is challen-
MASL, where the dengue vector is absent (e.g., Bogotá).      ging because the address information in the database is
These settlements provide a constant flux of people who      not standardized, and two different systems of urban ad-
are susceptible to the disease. Although a precise esti-     dresses coexist in the city. This issue was resolved via
mate does not exist, Girardot and its neighbouring tour-     the intensive depuration of the database and combining
istic municipalities receive approximately 65,000 visitors   different automatic (ArcGIS Desktop: Release 10. Red-
in a regular weekend, approximately 140,000 over long        lands, CA: Environmental Systems Research Institute,
weekends and up to 300,000 tourists during high season       and Quantum GIS: Open Source Geospatial Foundation
holidays (June–July and December–January) [24].              Project) and manual geocoding strategies, assuring geo-
   As stated before, Girardot is in the central region of    coding precision at the block level (Fig. 1). The results
the country where important movements of people gen-         of the geocoding process are not usually shown in detail;
erally occur. This central region is characterized as hav-   nevertheless, they are crucial to evaluate for possible se-
ing both hyper-endemic transmission (i.e., the persistent    lection bias. Figure 1 shows the results of the geocoding
transmission of dengue, with the simultaneous circula-       process. Of the 2942 cases in total, 23% were classified
tion of the 4 dengue serotypes) and endemic-epidemic         as impossible to geocode. The majority of these cases
transmission (i.e., sustained dengue transmission with       corresponded to dengue cases with a residence address
punctual epidemic outbreaks). Girardot is responsible        from another municipality (406). Others had insufficient
for 30.9% of the reported cases in the Department of         information for geocoding (228). Although dengue is de-
Cundinamarca, and it is one of the 18 municipalities         scribed as a primarily urban disease [32], 44 cases were
Fuentes-Vallejo BMC Infectious Diseases (2017) 17:512                                                          Page 4 of 16

 Fig. 1 Flowchart of the geocoding process

associated with rural addresses that were not possible to        Using Google Earth’s satellite images from multiple
geocode. Of the 2264 cases with sufficient information,        years, spatial information (i.e., blocks) was adjusted for
89.5% (2027) were successfully geocoded for spatial ana-       non-residential areas (parks, undeveloped areas, and
lysis. A visual inspection of the geocoded cases using sat-    other land uses), excluding polygons without population
ellite images from Google Earth revealed an even               information (225) and those without residential areas
distribution of cases throughout the residential areas of      (7). The final result was a shapefile with 965 polygons
the city.                                                      for a total population of 86,460 inhabitants.
                                                                 The block polygons have a mean area of 8185 m2, al-
                                                               though with a wide range (222 to 274,296 m2 polygons).
Intra-urban census data                                        Given the difference in the size of the polygons that
An important issue to consider when performing these           contain population data, a second approach was devel-
types of spatial analyses is the distribution of the popula-   oped to enhance the spatial analysis possibilities. Local
tion, which might act as a confounding factor when             cluster analyses based on centroids of polygon informa-
assessing the distribution of dengue cases.                    tion are sensitive to the number and distances between
  Total population per block data were available from          neighbouring data points. To resolve this situation, Telle
Colombia’s last population census (2005), with a total         [15] used a grid with squares of 250 m covering the
population of 87,626 across 1197 polygons that cover           study area (Delhi, India) to reduce the effect of irregular
the urban area. Although the available spatial informa-        spatial units (neighbourhoods). In this example, satellite
tion is not recent, it remains an important dataset that       images were used to estimate the population of each
provides a relative measurement of the population              square. Using a similar approach, a 20 × 20-m grid was
distribution to assess the distribution of dengue cases.       created to represent population information, dividing
Acknowledging that the spatial population information          the block’s population by the number of squares con-
is from 2005, and the dengue cases assessed are from a         tained in each block. Importantly, this procedure as-
later period (2012–2015), a ratio of dengue cases per          sumed that the population was evenly distributed inside
inhabitants at the block scale was used, understanding         each block polygon.
that it provides a relational view that enables the devel-       This procedure is also appropriate for Girardot be-
opment of a spatial analysis more than an accurate             cause the population density within blocks is similar,
measurement. Another study undertook a similar rela-           and houses are the predominant type of lodgement in
tional approach [7].                                           residential areas. In the central region of the city where
Fuentes-Vallejo BMC Infectious Diseases (2017) 17:512 Page 5 of 16
small buildings (with a higher population density) are seasons for the entire study period (2012–2015; rainy
present, blocks tend to be smaller; thus, the applied pro- seasons, March–May and October–November). For each
cedure does not have an important effect. For both ap- dataset, cases per inhabitant were calculated following
proaches, 1994 of the 2027 geocoded cases were within the two approaches described above (block polygons and
the block polygons and grid squares that contained grid). Finally, evaluating the urban morphology of Girar-
population information. dot, non-residential use areas fragmented residential
areas, and isolated constructed areas were identified
Meteorological data from field stations (2012–2015) west of the municipality. For this reason and after con-
Finally, precipitation information was obtained from the ducting different tests, it was decided that a fixed band
Hydrology, Meteorology and Environmental Studies In- of 300 m would be used for a spatial correlation analysis
stitute of Colombia (IDEAM). Two datasets were used at the block scale, and a fixed band of 100 m would be
for this study. The first included the monthly mean pre- used at the grid scale. These distances ensured that all of
cipitation for a long time period (1981–2010) from 5 the data would have at least one neighbour (even be-
meteorological stations located near Girardot’s urban tween fragmented residential areas); furthermore, it cor-
area. This information provided the general behaviour of responded to the mobility range of mosquitoes, which is
the precipitation in the region. A more specific dataset important for the diffusion process of the disease (hu-
was obtained from a nearby station (located in the man-vector-human). Another study considered similar
neighbouring municipality of Flandes) of the monthly distance ranges as adequate for this type of analysis [15].
total precipitation during the 2012–2015 period. This in-
formation enabled an approximate assessment of the Kulldorff’s scan statistics
precipitation behaviour during the same study period in Kulldorff’s space-time scan statistics were used to assess
which the dengue cases were evaluated. the concentration of dengue cases [34]. Performing a
gradual scan with variable-sized windows over a deter-
Spatial analysis mined space-time, cases inside each possible window
Spatial autocorrelation enables the assessment of were noted and compared with the expected cases for
whether the distribution of a given phenomenon corre- the same window. To accomplish this goal, information
sponds to a specific spatial pattern (e.g., aggregation or regarding the population at risk in each location was re-
dispersion) or whether it resembles a random distribu- quired. After detecting the most likely space-time clus-
tion. These methods generally provide a global measure ters (primary and secondary), these clusters were tested
used to assess the aggregation of data within a dataset via Monte Carlo simulations: If the points conforming to
and a local measure to evaluate the location of the clus- the evaluated cluster maintained their aggregated pattern
tered data. For this study, Getis-Ord indices (both global when compared with 999 randomized simulations of the
and local) were used [33]. entire dataset, then it was considered significant. Unlike
The dengue cases were divided into six different data- spatial autocorrelation methodologies (e.g., Moran’s or
sets (Table 1) for the spatial autocorrelation analysis. the Getis-Ord index), scan statistics enable the assess-
The first 4 datasets corresponded to individual year ment of both the aggregation of observations and the
datasets (2012, 2013, 2014 and 2015), whereas the other location of the aggregated observations that reject the
2 datasets were generated based on the rainy and dry null hypothesis via a Poisson model: Expected cases are
proportional to the population size [34, 35].
Table 1 Results of global indices using block centroids and a In vector-borne diseases (and specifically in dengue
20-m grid research), this type of analysis enables a better under-
Dataset Number of General Getis-Ord standing of the disease’s spatial and temporal dynamics,
geocoded dengue 20-m grid
cases (n = 1994) (Confidence level) correlating cases not only with regard to proximity but
Fixed band Fixed band
also within a plausible period during which human-
300 m 100 m mosquito-human transmission might occur. Other studies
2012 dataset 380 99% 99% have used this analysis to assess the configuration of out-
2013 dataset 723 99% 99%
breaks, identify concentrations of cases in vulnerable pop-
ulations and improve decision-making processes [36–39].
2014 dataset 533 99% 99%
2015 dataset 358 Not significant Not significant Information and parameters used for the space-time
Rainy season 732 99% 99% analysis
(2012–2015)
The same information used for the autocorrelation ana-
Dry season 1262 99% 99% lysis was used for this approach to analyse individual
(2012–2015)
years (2012–2015). Different dates for each dengue caseFuentes-Vallejo BMC Infectious Diseases (2017) 17:512 Page 6 of 16
were registered in SIVIGILA’s database (notification, on- showing a north/south division of non-residential land
set of symptoms, hospitalization, and so on). Because of use (university campuses, undeveloped areas, sport com-
the spatial and temporal nature of the analysis, the plexes) connected by main streets at three points. Block
symptom onset date was selected because it is a better shape, extension and orientation differed and were frag-
proxy for the actual infection date than the case notifica- mented by open areas (undeveloped terrain and parks),
tion date. Dengue cases and population information at although they were well connected by main streets.
the block level were used for this analysis (965 spatial The conditions of the residential areas were also het-
units). A finer scale analysis, such as the grid used for erogeneous and unevenly distributed throughout the
autocorrelation processing, was not possible because of urban area, displaying a slight pattern of new construc-
the calculation time required to scan the more than tion (corresponding to different socioeconomic strata)
17,000 spatial units that conformed to the grid. along the western corridor, whereas low socioeconomic
An advantage of the software selected to develop the strata residences tended to concentrate along the banks
analysis, was its recognized ability to customize model of the Magdalena and Bogotá Rivers, and more formal
parameters [40]. In this case, a retrospective space-time habitation was located towards the city centre. Neverthe-
design was used based on a discrete Poisson probability less, no defined or general residential pattern was
model. A time-segregation period of 20 days was se- observed based on socioeconomic conditions, with a
lected, and 50% of the at-risk population was set as the mixture of closed residential developments (second
maximum spatial cluster size. Nevertheless, only clusters residential housing) and formal and informal residence
with radii smaller than 300 m were reported. A supple- areas.
mental file contains details of the used parameters
(Additional file 1). Persistence of dengue cases in Girardot (Getis-Ord)
Using the population grid approach, the global Getis-
Results Ord index was significant for the rainy and dry seasons
Geocoded dengue cases (n = 2027) were slightly over- as well as for 2012, 2013 and 2014. Only the 2015 data-
represented by men (52.1%), although important differ- set was not eligible for further local exploration because
ences were registered for the 10- to 14-year-old and 75- it was not significant for the global cluster analysis
to 89-year-old age groups, in which men showed a (Table 1). A local Getis-Ord was applied for the inci-
higher degree of participation (greater than 60%). By dence of dengue using a 20-m grid with fixed bands of
contrast, the 70- to 74-year-old age group reported 60% 300 and 100 m. Both results were consistent, showing a
of cases in women (Fig. 2). Dengue cases in Girardot similar distribution of clustered dengue cases; however,
predominated in the first 15 years of life, as expected ac- the result with a 100-m fixed band allowed a more
cording to known trends for Colombia [41]. precise representation of clusters in the context of
The incidence of dengue is represented on Fig. 3. Near Girardot’s fragmented residential areas.
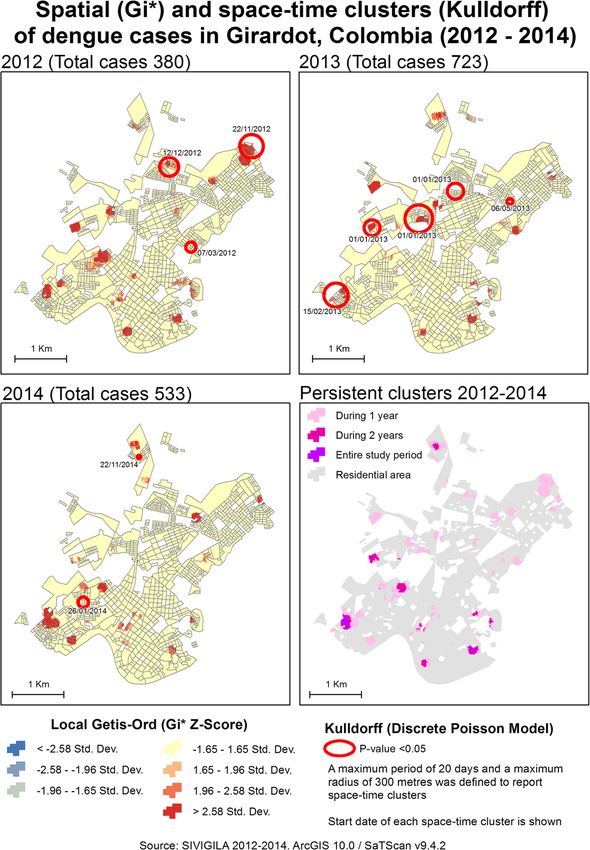
the bank of the Magdalena River, two concentrations of Figure 4 shows the local distribution of the incidence
cases were observed (East and West), as in the northeast of dengue clusters for the 3 years that were significant
and northwest limits of the urban area. On the map, the for global tests: 2012, 2013 and 2014. Interestingly, the
urban morphology of residential areas is appraisable, concentration of dengue cases differed by year and was
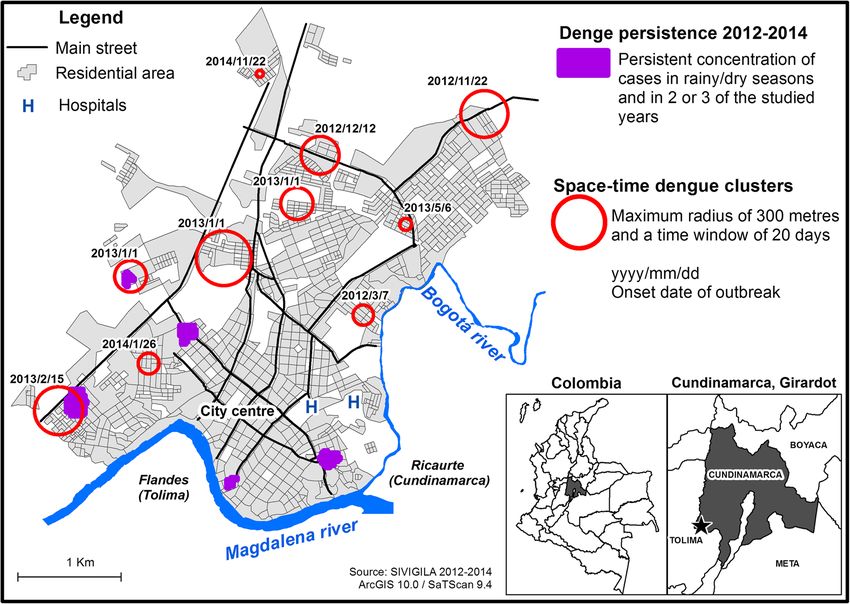
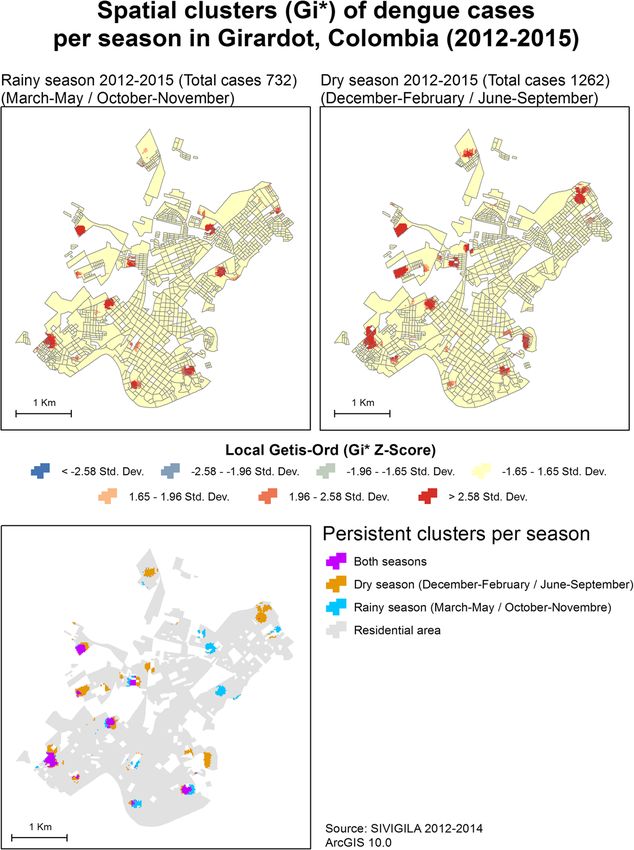
Fig. 2 Dengue cases by age and sex, Girardot 2012–2015 (n = 2027). Source: SIVIGILA records (adjusted for only local residents)Fuentes-Vallejo BMC Infectious Diseases (2017) 17:512 Page 7 of 16 Fig. 3 Incidence of dengue in the context of residential urban morphology, Girardot 2012–2015 not always related to the number of cases. In 2012, 380 also expands to the other side of the main corridor that cases were reported; however, from a spatial perspective, connects the north and south of the city, where Condo- these cases configured more clusters than the subse- mino Los Angeles is located, an area with affluent sec- quent years, although they reported more cases (723 in ondary residence complexes. 2013 and 533 in 2014). The persistence of clusters throughout the study period In terms of geographical extension, 2 clusters were is represented in the bottom right-hand corner of Fig. 4. A notable in 2012, corresponding to different neighbour- general pattern of more persistent clusters (present in 2 of hoods. At the northeast limit of the urban area, an ex- the 3 years of the study period) is notable in the south of tent cluster covered part of Portachuelo, a peripheral the city, which contrasts with the north, where clusters neighbourhood with formal and informal housing. A were apparent only for 1 year. This northern area also has second large cluster was located in the central-west re- a more fragmented residential morphology. Nevertheless, gion of Girardot, where more heterogenic urban condi- two persistent clusters were identified at the southwest tions are present: Quinta Saavedra has formal but and southeast limits of the urban area. The first affects La diverse residential areas (middle-low socioeconomic Esperanza, Hacienda Girardot and Quito Patio as de- conditions and second residence complexes); El Portal scribed above, whereas the second affects Las Rosas and de la Hacienda is a closed secondary residential area; part of Las Bocas del Bogotá. In general, these latter and part of Joge Eliecer Gaitan, a neighbourhood also neighbourhoods have lower socioeconomic conditions, characterised by middle-low socioeconomic conditions. including isolated informal residences. Regarding 2013, an important cluster is visible in the Figure 5 shows a general pattern describing a diagonal, southwest region of the city, primarily involving La where clusters with persistent presence in the dry and Esperanza, Hacienda Girardot and Quinto Patio, which rainy seasons are located in the south and west regions share similar middle socioeconomic conditions, and spe- of the urban area. Included in this group are both of the cific areas with more vulnerable conditions. This cluster persistent clusters identified earlier for the 3 years
Fuentes-Vallejo BMC Infectious Diseases (2017) 17:512                                                                  Page 8 of 16

 Fig. 4 Spatial distribution of the incidence of dengue in Girardot

studied (2012–2014). At the other side of this diagonal,              this difference is due to under-report of cases in
clusters with a presence in only one of the seasons                   different periods. As stated earlier, there is an increase of
during the evaluated period (2012–2015) were located in               tourism (grater presence of susceptible populations,
the north and east regions of the city. Neighbourhoods                higher population density) during the dry seasons that
where significant clusters were present for the rainy or              could have an effect on the increase of dengue cases.
dry season differed with regard to socioeconomic condi-                 Table 2 shows the percentages that the grouped cases
tions, ranging from informal developing areas to formal               in significant clusters represent. Although the percent-
and closed secondary residential areas with high socio-               ages were generally low, the spatial distribution of these
economic conditions.                                                  clusters corresponded to different neighbourhoods as
  Importantly, the number of cases per season differed:               discussed above. Regarding patient age, Table 3 shows
1262 in the dry seasons and 732 in the rainy seasons. Al-             that all of the clustered cases were associated with lower
though the dry season includes 7 months (December–                    mean and median ages than non-clustered cases, al-
February and June–September), and the rainy season                    though no significant differences were found using a
includes only 5 (March–May and October–November),                     nonparametric analysis (K-sample test on the equality of
the former still had a higher mean number of cases per                medians, StataCorp. 2013. Stata Statistical Software:
month (180.3) than the latter (146.4). It is unlikely that            Release 13. College Station, TX: StataCorp LP).
Fuentes-Vallejo BMC Infectious Diseases (2017) 17:512                                                                          Page 9 of 16

  Fig. 5 Seasonal distribution of the incidence of dengue in Girardot

Concentration of cases in time and space (Kulldorff’s scan                    (La Esperanza). The established 20-day window of the
statistics)                                                                   first cluster ended on 11 December, and three new
Figure 4 represents the 10 spatio-temporal clusters iden-                     clusters started on the next day (12 December) with the
tified from 2012 to 2014. Examining the start dates of                        separation of 1230, 180 and 457 m among them, ending
the clusters, they shifted starting on 22 November 2012                       on 25 January 2013. A fifth cluster started 20 days later
in the northeast (Portachuelo) towards the southwest                          (15 February) in the southeast region of Girardot.
                                                                                 The identified clusters also described the 2013 outbreak,
Table 2 Cases grouped in significant clusters                                 with three initial clusters during the first year (2012),
Year/season               Total cases   Cases grouped in significant   %      increasing to 5 in 2013 and then decreasing to two clusters
                                        clusters(p < 0.05)                    in 2014. As shown in Additional file 2 (spatio-temporal
2012                      380           66                             17.4   cluster detail), 5 of the 10 spatio-temporal clusters
2013                      723           101                            14.0   overlapped with spatial clusters (Getis-Ord) that repre-
2014                      533           50                             9.4    sented a concentration of cases during each year. The
Any of the 3 years        1636          325                            19.9   spatio-temporal clusters also varied in size, reporting radii
                                                                              from 33.5 to 266.9 m. Different types of residential areas
Persistence in at least   1636          91                             5.6
2 years                                                                       and urban conditions were reported, including opposite
Rainy season              732           63                             8.6
                                                                              conditions such as in the Agua Blanca and Brisas de Gua-
                                                                              dalquivir high-stratum residence complexes, which were
Dry season                1262          141                            11.2
                                                                              different to the vulnerable conditions in Portachuelo.
Fuentes-Vallejo BMC Infectious Diseases (2017) 17:512 Page 10 of 16
Table 3 Age of the patients in the identified clusters
% of cases younger Mean age (years) Median age (years) n Pearson’s chi2/P-value
than 15 years old (K-sample test on the
equality of medians)
Cases in persistent zones 70.3 16.6 11 91 3.2333/0.072
(clusters in at least 2 years)
Cases in non-persistent zones 60.4 19.4 12 1545
(clusters in at least 2 years)
Cases clustered in the dry season 60.3 17.1 12 141 0.8484/0.357
Cases not clustered in the dry season 58.0 20.1 13 1121
Cases clustered in the rainy season 68.3 18.1 10 63 1.4416/0.230
Cases not clustered in the rainy season 57.2 21.2 13 669
Cases clustered in any of the three years 64.3 17.4 11 325 3.6110/0.057
Cases not clustered in any of the three years 60.1 19.8 12 1311
Within the presence of these two extremes, average condi- monthly precipitation in mm, showing that dengue cases
tions were constantly reported. tend to increase during dry seasons.
During the 3-year period, spatio-temporal clusters in- According to the synthesis (Fig. 7), dengue cases
cluded 69 observed cases, corresponding to only 4.25% clustered in space and space-time described before
of the total cases reported over the same period (1623 showed different distributions. A persistent incidence
cases). These cases were primarily patients younger than of dengue (local Getis-Ord indices) was found in more
15 years old, with an even distribution between males consolidated urban areas, whereas the space-time
and females (Additional file 2). clusters (Kulldorff ’s scan statistics) emerged towards
Regarding dengue cases on a broader temporal scale, the north and east of the city where urban expansion
an increased number of cases was noted at the end and and a more dynamic urban space are present. Never-
beginning of each year, especially for 2012–2013 and theless, dengue clusters assessed with both methods
2013–2014 (Fig. 6). For both epidemic periods, spatio- were located outside of the central region of the city
temporal clusters were identified (red bars in Fig. 6) dur- towards the periphery, corresponding to the neigh-
ing the first months when the increase of cases occurred. bourhoods and residential areas with different charac-
As mentioned earlier, December–February and June– teristics and socioeconomic conditions. The different
September are the dry seasons. However, to assess spe- distributions of space and space-time clusters could be
cific interactions of precipitation with dengue cases, the related to different territorial dynamics as discussed in
black line in the same figure represents the total the next section.
Fig. 6 Dengue cases, temperature and precipitation, Girardot 2012–2015. Legend. Black and orange lines along the right axis represent the total
precipitation (mm) per month and temperature (°C), respectively. The bars represent dengue cases per month. The highlighted bars in red indicate the
presence of spatio-temporal clusters. Sources: SIVIGILA and IDEAMFuentes-Vallejo BMC Infectious Diseases (2017) 17:512 Page 11 of 16
Fig. 7 Synthesis of the incidence of dengue in Girardot
Discussion equilibrium (i.e., the same number of cases in two
This study combined spatial and spatio-temporal ana- consecutive years) might hide an unstable configuration
lyses, which have been proven useful [42] for assessing of the incidence of dengue on a finer scale. Although the
the distribution of the incidence of dengue in intra- number of cases in Girardot changed over years, similar
urban settings. Although the observed clusters in numbers were reported in 2012 and 2015 (380 and 358,
Girardot shifted throughout time and space (Fig. 7), respectively). Nevertheless, the results for the general
these patterns might be the result of different territorial Getis-Ord index showed that the cases in 2015, unlike
dynamics related to urban functions, urban changes (i.e., 2012, did not correspond to an agglomerated pattern;
urban expansion), demographic composition, or touristic thus, assessments of local clustering for this particular
activities. Further understanding of dengue persistence year are not recommended. Even more drastic that the
(space clusters) and outbreaks (space time clusters) in results from Delhi, the similar count of dengue cases in
the context of hyper-endemic urban spaces could even- Girardot might not be significantly concentrated.
tually help to guide prevention measures from a territor- Nevertheless, this study described the persistence of
ial perspective (i.e., where, when and how to intervene). significant concentrations of dengue cases, defined as
the overlapping of clusters for 2 or 3 years of the study
Space clustering of the incidence of dengue period as well as in both seasons (Figs. 4 and 5). A 3-
The geography of dengue in Girardot is characterized by year study in another hyper-endemic urban context [16]
annual concentrations of cases in clusters of different found a low percentage of the spatial units registered
sizes across disparate places throughout the city. Similar dengue cases in 2 or 3 of the study years. Therefore, an
results were obtained in a study in Delhi [15], where a absence of permanent clusters was described in the
similar number of cases were assessed over 2 years. The context of a highly populated city (Delhi) undergoing
results showed concentrations of cases in different loca- the reintroduction of the DENV-1 serotype 5 years after
tions. The author emphasized that a system in apparent its last circulation. The overlap of significant clustersFuentes-Vallejo BMC Infectious Diseases (2017) 17:512 Page 12 of 16 described for Girardot accounted for a small percentage areas of persistent clusters discussed earlier (excluding of the total cases for each year or season (Table 2); the high-class complex Brisas de Guadalquivir, which nevertheless, this persistence was observed despite the did not exist at the time). Furthermore, a general local effect of monotypic herd immunity, which can relationship was found between high-risk neighbour- weaken the persistence of the incidence as described by hoods with low socioeconomic status and the pres- Telle et al. [16]. Moreover, these clusters showed a dis- ence of the vector in households. However, these tribution that was coherent with the local epidemiology general findings were not suitable for assessing spe- of dengue and residential structures. cific intra-urban dynamics. Non-significant median age differences were found A systematic review argued that there is no consistent among patients in clustered and non-clustered patterns evidence to affirm that poverty is a predictor of dengue in Girardot (Table 3). However, the higher percentage of [13]. This lack of evidence might also be related to the cases in patients younger than 15 years old and the scale of analysis usually adopted to assess this type of re- lower mean age of clustered cases supports the hypoth- lationship. Considering the persistence of dengue at an esis that the presence of vulnerable populations shapes intra-urban scale might help define a more appropriate the distribution of the identified clusters, given that the scale to measure the relationship between dengue and most affected age group in Colombia shifted from 15 to socioeconomic conditions, which might also help ex- 44 years old towards 0 to 15 years old [41]. This result is plore how other systems interact to explain why not all a response to the actual hyper-endemic transmission in deprived areas have concentrated cases or why dengue cities such as Girardot and characterized by the simul- cases are also concentrated in high-stratum areas such taneous circulation of all four dengue virus serotypes ob- as Brisas de Guadalquivir in Girardot. Nevertheless, we served since 2004. A multi-country study in Asia and agree with other authors [7] that this type of finding Latin America (5 countries in each region) assessed should strengthen rather than discourage public policy symptomatic dengue and seropositivity in children [43]; to attain sustainable urban development, including den- Colombia contributed the largest subcohort of the re- gue prevention and control programmes, especially for gion (n = 3245) distributed among 9 municipalities, in- those with greater need. cluding Girardot. Although non-specific data were Olivier Telle [15] found that intra-urban deprived and available for Girardot, Colombia reported the highest densely populated spaces in Delhi were associated with seropositivity at baseline (92.3%) in Latin America, and dengue concentration and the permanent presence of it was the only country of the region to report the circu- the dengue vector throughout the year. This relationship lation of all 4 dengue serotypes. Additional studies are might play an important role in maintaining viral circu- needed to assess the impact of demographic composition lation during inter-epidemic periods. The degree of vul- at a fine scale on the incidence of dengue in the context nerability of deprived urban areas and their relationships of hyper-endemic transmission. with vector presence have yet to be adequately measured Regarding the distribution in the residential structures in Girardot. Nevertheless, the persistence of the inci- of the described persistent clusters, three of the five dence of dengue was found near the Bogotá and Magda- areas that showed this persistent behaviour corresponded lena Rivers and in the oldest, more consolidated and less to neighbourhoods of local residents (non-tourists) with fragmented regions of Girardot. This finding contrasted low-to-medium socioeconomic conditions; one corre- with the northern part of the city, which presented with a sponded also to neighbourhoods of local residents with more fragmented residential morphology, an important heterogenic conditions but with a predominance of commercial and tourism-related infrastructure (e.g., shop- medium socioeconomic conditions; and finally, one was ping malls), and the two urban expansion areas of the city related to a high stratum of secondary residence complexes (i.e., the northern and western fronts). (Brisas de Guadalquivir). Although the available informa- Related to the urban morphology of the city, dengue tion for this study did not enable an assessment of the clusters identified during the rainy season (Fig. 5) were specific socioeconomic conditions of each of the five men- located near small natural drainages (caños) or open, tioned areas, a relationship between the structural socio- undeveloped terrain. Although the vector productivity in economic conditions and the persistence of dengue is Girardot has been primarily related to indoor recipients likely. A previous study of Girardot [44] that evaluated den- [45], this result suggests that specific places exist where gue cases (1998–2002) from an ecological approach ob- the rainy season increases the productivity of breeding tained results consistent with those discussed here. Using a sites in public spaces and therefore augments the risk of standardized incidence ratio (i.e., the incidence of dengue dengue and the number of cases. This suggestion is a for each neighbourhood divided by the incidence of dengue plausible hypothesis, given that undeveloped terrains for the whole city), a substantial number of neighbourhoods and “caños” are usually unattended and filled with rub- were identified at high risk [44], including the same specific bish, creating a potential accumulation of rainwater and
Fuentes-Vallejo BMC Infectious Diseases (2017) 17:512                                                        Page 13 of 16

consequent breeding sites for Aedes aegypti. Major            reported cases in the initial processing of the SIVIGILA
breeding sites in public spaces (specifically sewers),        database (2012–2015) corresponded to rural residents
have been reported in other Colombian cities such as          and residents from other municipalities. This finding led
Cali [45].                                                    to the perception of important city migration fluxes due
  One overall point about the persistent behaviour of         to tourism, low-wage construction workers and popula-
dengue concentrations is that it seems to be related to       tion from surrounding municipalities in search of ser-
low and medium socioeconomic conditions. In addition,         vices. These migration dynamics are commonly reported
this persistence was correlated with more consolidated        for Girardot but have not been well documented or
and stable urban systems, unlike the north and west ex-       measured.
pansion areas of Girardot.                                      The spatio-temporal clusters also describe the dis-
                                                              placement from the northeast (November 2012) to the
Space-time clustering of the incidence of dengue              southwest (February 2013). In another study, the pos-
Regarding the results of the spatio-temporal analysis, the    sible effect of wind was discussed, which was associated
general spatial distribution differed from the pattern dis-   with the dispersal of dengue epidemics [46]. In this case,
cussed regarding persistent agglomerations of the inci-       however, it seems that social structures and the migra-
dence of dengue. Outbreaks have been described along a        tion of susceptible populations remain as possible
diagonal from the northeast towards the southwest of          explanations. The onset date (1 January) of three simul-
the city, following the axis of urban expansion described     taneous space-time clusters might be correlated with the
earlier, whereas a persistence of cases was present in the    long tourism season of the city because two clusters
southern part of the city. However, common places             overlap with high-stratum secondary residence com-
remained (5 of the 10 spatio-temporal reported clusters)      plexes. One possible hypothesis is that the arrival of sus-
where these two distributions overlapped, specifically        ceptible populations to secondary residence complexes
throughout the onset and initial evolution of the 2013        during a season when the vector densities are higher
epidemic (November 2012–February 2013).                       [47] results in conditions conducive to the spread of the
  However, the observed cases within the space-time           virus, thereby generating symptomatic reported cases as
clusters represent a small percentage of the total reports    well as asymptomatic infections that generally affect lo-
(4.25%). This result diverges from that obtained by a         cals and foreigners. Although the influence of tourism
similar analysis that assessed a specific outbreak with the   has been explored in other studies [4, 19, 27], more evi-
same measurement, finding 65.3% of total dengue cases         dence is needed for Colombian cities such as Girardot.
[46]. Another study (with the same model parameters:          Findings concerning touristic economies and risk of out-
300 m and 20-day windows) observed 67% and 62% of             breaks are sensible and have an important effect in local
the total cases in spatio-temporal clusters over two con-     economies, as reported in the Indian Ocean during the
secutive years with similar numbers of cases [15]. In the     chikungunya outbreak (2004–2006) [48]. In the case of
context of hyper-endemic dengue transmission in Girar-        Girardot, recent outbreaks of chikungunya and Zika
dot, cases were distributed throughout the city year-         have concerned local authorities regarding health and
round. Therefore, space-time clusters might represent         economic impacts (mainly in tourism).
particular transmission dynamics more than focalized            To attain a better understanding of the possible trans-
starting points for generalized epidemics. Nevertheless,      mission dynamics relative to the interactions between
68% of the cases grouped in space-time clusters were lo-      ecological and social systems, much remains to be learned
cated in areas with tourist infrastructures and secondary     about the intra-urban circulation of dengue serotypes and
residences; furthermore, they occurred during the dry         their relationships with the movement of people (at
season, which is the longest and most tourism-related         different scales), especially with regard to Girardot and
period of the year in Girardot (December and January).        Colombia. Much has been said about the effects of daily
  This temporal distribution contrasts with the de-           movements, including the methodological challenges
scribed relationship during the rainy season and the in-      regarding accurate measurements and the estimated effect
crease in dengue cases in Colombia [4, 41]. In Girardot,      of daily movement on dengue transmission [7, 30, 31, 49–
a clear pattern of dengue cases is notable during the dry     51]. Intra-urban daily movements have been suspected in
season. The results of an entomologic study support this      hyper-endemic cities such as Girardot, given the low
finding, stating that Girardot reported (in 20 randomly       percentage of cases represented in spatio-temporal
selected clusters composed of approximately 100 house-        clusters. Assessing cases by their residential address can
holds each) more recipients with water, a slight increase     affect a spatio-temporal analysis, given that people might
in low tanks (albercas) with high water levels and an         be infected away from home. Additional evidence is
overall increased productivity of Aedes aegypti pupae         needed to understand how daily movements shape dengue
during the dry season [47]. Importantly, 19.6% of 3228        transmission in Girardot.
Fuentes-Vallejo BMC Infectious Diseases (2017) 17:512 Page 14 of 16
Dengue in Girardot: Among places of persistence and most important limitations concerning this type of study
places of outbreaks is the accuracy of address information in Colombia, which
The incidence of dengue in Girardot was characterized required an important and comprehensive process of
with space and space-time manifestations throughout an database editing. In addition, differential access to the
urban space. Each cluster had different spatial patterns; healthcare system (in which cases are officially reported)
however, a general pattern was evident, in which persist- might have underestimated the incidence of dengue
ent clusters (local Getis-Ord indices) and space-time among specific social groups (e.g., inhabitants from more
concentrations (Kulldorff’s scan statistics) occurred deprived areas). Finally, no evidence exists as to whether
along the periphery of the city, identifying a weak pres- the distribution of reported symptomatic cases is compar-
ence of the disease in the historical and geographical able to the asymptomatic non-registered cases; if import-
centre of Girardot. Although the incidence analysis con- ant differences exist, then the results might be biased.
trolled for the effect of population density, spatial units Context-related limitations were also present, such as
with low population denominators (which are usually the availability of updated populations and socioeco-
present in city centres) can overestimate the incidence, nomic information, particularly with regard to the de-
even when they present a reduced number of cases [15]. tailed spatial units that enabled additional exploration of
This finding was not the case for Girardot, even that the distribution of cases in urban areas. Population de-
population density is lower in the city centre because of nominators are crucial for this type of analysis, and al-
other non-residential land uses; nevertheless, no appar- though approximate results can be achieved using the
ent dengue concentrations were detected. available information, having more accurate data that
In other contexts, the city centre has been described as can lead to better results and more useful recommenda-
having a high incidence of dengue [7, 52]. However, per- tions is always desirable.
ipheral vulnerable areas have also been emphasized to play
a role in understanding dengue transmission, and interven- Conclusions
tions are recommended in these places even if incidence of The literature on dengue is full of inconsistent results that
dengue is low [7, 15]. The periphery of Girardot was not mirror the inherent complexity of its transmission dynam-
specifically correlated with vulnerable conditions because ics. The relationships between socioeconomic conditions
of the mixed residential pattern already described. Never- and the incidence of dengue have not been completely un-
theless, the peripheral spaces in Girardot are dynamic, and veiled. In addition, the movement of people and the spe-
they demonstrate the recent urban changes that the city cific circulation of serotypes on fine scales are being
has undergone in terms of housing construction and com- explored as important components of dengue transmis-
mercial/tourism activity emplacement. In contrast to den- sion. Finally, although the introduction of dengue vaccines
gue persistence, spatio-temporal clustering seems to be is on the horizon [53, 54] and much knowledge has been
related to areas where seasonal fluxes are present, specific- gained regarding this disease, many questions remain to
ally with regard to susceptible populations. In the same be addressed to advance effective prevention initiatives to
sense, dynamic and changing urban spaces (expansion and affect its burden. From epidemiological, public health and
changes in urban functions) were related to the spatio- social sciences viewpoints, the need for coordinated col-
temporal concentrations of the incidence of dengue. laboration that leads to assessments of the effect of “place”
Complementary use of space and space-time analysis can from a relational perspective is gaining importance [55],
reveal different underlying territorial dynamics. Structural and geography has an important role to play.
or long-term urban conditions (e.g., deprived areas) might A general peripheral pattern was described in Girardot;
be related to persistent concentrations of dengue to a cer- however, by no means is exclusively correlated with vulner-
tain extent. By contrast, more unstable and temporal urban able spaces. Rather, an understanding exists that the periph-
dynamics (urban expansion and the movement of people ery of the city is marked by the presence of different types
on different scales) might enhance spatio-temporal con- of residential areas that correspond to a wide range of so-
centrations. This possible pattern would certainly need to cioeconomic and cultural conditions. From a geography of
be evaluated in the context of and particularities of specific health perspective, it is important to acknowledge that the
urban spaces before arriving at generalized conclusions. linear and general associations between dengue and poverty
or peripheral spaces no longer apply specifically to intra-
Study limitations urban hyper-endemic settings. The pathogenic complex of
Working with notified dengue cases (SIVIGILA) posed a dengue [18] is dynamic, and even if the same main compo-
series of challenges mentioned throughout this paper. The nents are always present (virus, vector and susceptible
absence of serotype information related to reported population), the configuration of these components with re-
dengue cases limits the interpretation of the space and gard to complex urban territorial structures would result in
space-time clusters described in this study. One of the different processes and spatial manifestations of the disease.Fuentes-Vallejo BMC Infectious Diseases (2017) 17:512 Page 15 of 16
Additional files 3. San Martín JL, Brathwaite O, Zambrano B, Solórzano JO, Bouckenooghe A,
Dayan GH, et al. The epidemiology of dengue in the Americas over the last
three decades: a worrisome reality. Am J Trop Med Hyg 2010 Jan;82(1):128–135.
Additional file 1: Parameters for space-time cluster analysis (SaTScan
Available from: http://dx.doi.org/10.4269/ajtmh.2010.09-0346.
V9.4.2). Description of data: Table containing the specific parameters and
4. Zambrano B, San Martin JL. Epidemiology of dengue in latin America.
observations concerning the performed space-time cluster analysis.
J Pediatric Infect Dis Soc. 2014;3(3):181–2.
(DOCX 88 kb)
5. Fernández-Salas I, Danis-Lozano R, Casas-Martínez M, Ulloa A, Bond JG,
Additional file 2: Detail of spatio-temporal clusters identified in Girardot, Marina CF, et al. Historical inability to control Aedes Aegypti as a main
2012–2014. Description of data: Table containing the details of the contributor of fast dispersal of chikungunya outbreaks in Latin America.
space-time clusters identified (year, start-end dates, radius, observed Antivir Res. 2015;124:30–42.
cases, affected population and description of urban conditions, and 6. Rojas DP, Dean NE, Yang Y, Kenah E, Quintero J, Tomasi S, et al.
overlap with spatial clusters). (DOCX 63 kb) The Epidemiology and Transmissibility of Zika Virus in Girardot and San
Andres Island, Colombia. bioRxiv [Internet]. 2016;(January). Available from:
http://biorxiv.org/content/early/2016/04/24/049957.abstract. Accessed
Acknowledgements
Feb 2017.
I appreciate the collaboration of Simon Tomasi and Juliana Quintero from
the “Fundación Santa Fe de Bogotá” for their input throughout the 7. Donnat M, Gozalvez-Kreuzer B, Roca Y, Conde Cosme A, Choque Rios J,
geocoding process and their comments during the interpretation of the Hervé J-P, et al. La dynamique de la dengue à Santa Cruz de la Sierra
(Bolivie) entre paysages à risques et mobilités: appréciation des inégalités et
results. In addition, I thank Professors Stephane Rican (University Paris
Nanterre) and Vincent Godard (University Paris 8 Vincennes Saint Denis) from gestion du risque. Espac Popul Sociétés. 2011:34–46.
the Laboratory of Social Dynamics and Spatial Reconstruction (LADYSS) and 8. Padilla JC, Rojas DP, Sáenz-Gómez R, Sáenz-Gómez R. Dengue en Colombia:
Professor Pascal Handschumacher (IRD) for their feedback during the Epidemiología de la reemergencia a la hiperendemia. Hernández CA, editor.
development of this study. Bogotá D. C.; 2012. 248 p.
9. Castañeda-Orjuela C, Diaz H, Alvis-Guzman N, Olarte A, Rodriguez H,
Camargo G, et al. Burden of disease and economic impact of dengue and
Funding
severe dengue in Colombia, 2011. Value Heal Reg Issues. 2012;1:123–8.
The “Fundación Santa Fe de Bogotá (Colombia)” partially financed this study
10. Castro Rodriguez R, Galera-Gelvez K, López Yescas JG, Rueda-Gallardo J a.,
through the project “Enfoque Ecobiosocial para el diseño e implementación
Lopez Yescas JG, Rueda-Gallardo J a. Costs of dengue to the health system
de una estrategia sostenible para el control del vector de dengue en Girardot,
and individuals in Colombia from 2010 to 2012. Am J Trop Med Hyg. 2015;
Fase 3. Viabilidad y cosot efectividad de una intervención innovadora para el
92(4):709–714. Available from: http://www.ajtmh.org/cgi/doi/10.4269/ajtmh.
control del vector de dengue” Departamento de Ciencia, Tecnología e
14-0386.
Innovación (Colciencias (CTeI)), Project code 622172553374.
11. Smith DL, Perkins TA, Reiner RC, Barker CM, Niu T, Chaves LF, et al.
Recasting the theory of mosquito-borne pathogen transmission dynamics
Availability of data and materials and control. Trans R Soc Trop Med Hyg. 2014;108(4):185–97.
The datasets used and analysed for the current study are available from the
12. Bowman LR, Runge-Ranzinger S, McCall PJ. Assessing the Relationship
corresponding author upon request.
between Vector Indices and Dengue Transmission: A Systematic Review of
the Evidence. Plos Negl Trop Dis. 2014;8(5):1–11.
Authors’ contributions 13. Mulligan K, Dixon J, Joanna Sinn C-L, Elliott SJ. Is dengue a disease of
MFV designed the study, processed the information, performed the analysis, poverty? A systematic review. Pathog Glob Health. 2015;109(1):10–18.
interpreted the results, and wrote the manuscript. Available from: http://www.ncbi.nlm.nih.gov/pubmed/25546339.
14. Carabali M, Hernandez LM, Arauz MJ, Villar LA, Ridde V. Why are people
Authors’ information with dengue dying? A scoping review of determinants for dengue
MFV is a Geography PhD candidate at the University Paris 8 Vincennes Saint mortality. BMC Infect Dis. 2015;15:301. Available from: http://www.
Denis, Laboratory of Social Dynamics and Spatial Reconstruction (LADYSS). pubmedcentral.nih.gov/articlerender.fcgi?artid=4520151&tool=
pmcentrez&rendertype=abstract.
Ethics approval and consent to participate 15. Telle O. Géographie d’une maladie émergente en milieu urbain endémique,
Not applicable. le cas de la dengue à Delhi, Inde. Cybergeo Eur J Geogr. 2015;(718):1–20.
16. Telle O, Vaguet A, Yadav NK, Lefebvre B, Daudé E, Paul RE, et al. The spread
Consent for publication of dengue in an endemic urban milieu-the case of Delhi, India. PLoS One.
Not applicable. 2016;11(1):e0146539. Available from: http://journals.plos.org/plosone/
article?id=10.1371/journal.pone.0146539.
Competing interests 17. Bowman LR, Donegan S, McCall PJ. Is dengue vector control deficient in
The author declares that he/she has no competing interests. effectiveness or evidence?: systematic review and meta-analysis. PLoS Negl Trop Dis.
2016;10(3):e0004551. Available from: http://journals.plos.org/plosntds/article?id=10.
1371/journal.pntd.0004551.
Publisher’s Note 18. Sorre M. Complexes pathogènes et géographie médicale. Ann Georgr. 1933;
Springer Nature remains neutral with regard to jurisdictional claims in 235:1–18.
published maps and institutional affiliations. 19. Flauzino RF, Souza-Santos R, Barcelllos C, Gracie R, Magalhães
MDAFM, Oliveira RMD. Spatial heterogeneity of dengue fever in local
Received: 8 March 2017 Accepted: 18 July 2017 studies, City of Niterói, southeastern Brazil. Rev Saude Publica. 2009;
43(6):1035–43.
20. Fuentes-Vallejo M, Higuera-Mendieta DR, García-Betancourt T, Alcalá-
References Espinosa LA, García-Sanchez D, Munévar-Cagigas DA, et al. Territorial
1. Bhatt S, Gething PW, Brady OJ, Messina JP, Farlow AW, Moyes CL, et al. The analysis of Aedes Aegypti distribution in two Colombian cities: a chorematic
global distribution and burden of dengue. Nature 2013;496(7446):504–507. and ecosystem approach. Cad Saude Publica. 2015;31(3):517–30.
Available from: http://www.pubmedcentral.nih.gov/articlerender.fcgi?artid= 21. DANE. Departamento Administrativo Nacional de Estadística. Proyecciones
3651993&tool=pmcentrez&rendertype=abstract. de población 2005–2020 [Internet]. 2013 [cited 2016 May 6]. Available from:
2. World Health Organization, Special Programme for Rsearch and Training in http://www.dane.gov.co/index.php/estadisticas-por-tema/demografia-y-
Tropical Diseases. Dengue: guidelines for diagnosis, treatment, prevention poblacion/proyecciones-de-poblacion.
and control [internet]. Geneva: World Health Organization Press; 2009. x, 22. Alcaldía de Girardot. Sitio oficial de Girardot en Cundinamarca, Colombia
147. Available from: http://www.who.int/tdr/publications/training-guideline- [Internet]. 2016 [cited 2016 May 6]. Available from: http://www.girardot-
publications/dengue-diagnosis-treatment/en/. cundinamarca.gov.co/informacion_general.shtml.You can also read