Final 6/29/2021 - Zero Fatalities-Nevada's
←
→
Page content transcription
If your browser does not render page correctly, please read the page content below

Final 6/29/2021

Final 6/29/2021

3

                                                Table of Contents
1.      Introduction .............................................................................................................. 5
2.      Highway Safety Planning Process ........................................................................... 8
     2.1. Funding Strategy ................................................................................................ 8
     2.2. Grant Process .................................................................................................... 9
     2.3. Process Participants ........................................................................................ 12
3.      Data Analysis ......................................................................................................... 14
     3.1. Data Sources and Processes ........................................................................... 14
     3.2. Coordination with SHSP ................................................................................... 15
4.      Equipment Request................................................................................................ 18
5.      Performance Report ............................................................................................... 19
     5.1. Performance Measure C-1: Fatalities............................................................... 20
     5.2. Performance Measure C-2: Serious Injuries .................................................... 21
     5.3. Performance Measure C-3: Fatality Rate/100 Million VMT .............................. 21
     5.4. Performance Measure C-4: Unrestrained Passenger Vehicle Occupant
     Fatalities, All Positions ............................................................................................... 22
     5.5. Performance Measure C-5: Number of Fatalities in Crashes Involving a Driver
     or Motorcycle Operator with a BAC of 0.08 and Above ............................................. 22
     5.6. Performance Measure C-6: Speeding-Related Fatalities ................................. 23
     5.7. Performance Measure C-7: Number of Motorcyclist Fatalities ......................... 23
     5.8. Performance Measure C-8: Number of Unhelmeted Motorcyclist Fatalities ..... 24
     5.9. Performance Measure C-9: Number of Drivers Age 20 or Younger Involved in
     Fatal Crashes ............................................................................................................ 25
     5.10.      Performance Measure C-10: Pedestrian Fatalities ....................................... 25
     5.11.      Performance Measure C-11: Bicyclists Fatalities .......................................... 26
     5.12.      Performance Measure B-1: Observed Seat Belt Usage................................ 26
     5.13.      Performance Measure A-1: Child Passenger Safety..................................... 27
     5.14. Performance Measure A-2: Number of Traffic Fatalities Reported as
     Distracted Driving ...................................................................................................... 27
     5.15. Performance Measure C-C-1: The percentage of crash records with no
     missing critical data elements .................................................................................... 28
     5.16.      Performance Measure C-T-1: Traffic Records Crash Timeliness Median Days
                28
     5.17. Performance Measure C-T-2: Percentage Crash Report Entered into
     Database within 30 Days after the Crash .................................................................. 28
6.      HSP Problem Identification .................................................................................... 29
4
7.      Performance Measures .......................................................................................... 31
     7.1. Performance Measure C-1: Fatalities............................................................... 33
     7.2. Performance Measure C-2: Serious Injuries .................................................... 34
     7.3. Performance Measure C-3: Fatality Rate Per 100 Million VMT ........................ 35
8.      HSP Program Areas............................................................................................... 36
     8.1. Occupant Protection (Adult and Child Passenger Safety [CPS])...................... 36
     8.2. Impaired Driving Prevention (Drug or Alcohol) ................................................. 46
     8.3. Speeding Prevention ........................................................................................ 52
     8.4. Motorcycle Safety............................................................................................. 57
     8.5. Young Drivers .................................................................................................. 62
     8.6. Non-Motorized (Pedestrian and Bicycle) .......................................................... 68
     8.7. Distracted Driving ............................................................................................. 78
     8.8. Communications (Media) ................................................................................. 85
     8.9. Traffic Records ................................................................................................. 88
     8.10.      Evidence-Based Traffic Safety Enforcement Program .................................. 91
     8.11.      Racial Profiling Data Collection ..................................................................... 94
     8.12.      Legislative Initiatives ..................................................................................... 94
9.      Acronyms ............................................................................................................... 96
10.       Resources ........................................................................................................... 97
     10.1.      Websites ....................................................................................................... 97
     10.2.      Documents.................................................................................................... 97

                                                    Attachments
Certifications and Assurances – NV_FY22_Appendix A.pdf
Appendix B Part 1300 Application for Section 405 and Section 1906 Grants –
NV_FY22_Appendix B.pdf
Attachments for Appendix B Part 1300 Application (see separate file attachments)
Funding Summary and Project Level Detail – NV_FY22_Funding Summary and Project
Level Detail.pdf
Section 1906 Project – NV_FY22_1906_UNLV Project.pdf
Nevada Traffic Safety Crash Facts – NV_FY22_Traffic Safety Crash Facts.pdf
C-C-1 Supporting Document – NV_FY22_405c_Quantitative Improvement C.C.1 NV
Secondary Collisions.pdf
2020 Citations and Arrests – NV_FY22_405c_2020 Citations Arrests.pdf
5

1. Introduction
With the goal of eliminating traffic-related fatalities and serious injuries from its
roadways, Nevada’s 2022 Highway Safety Plan (HSP) involves an annual collaboration
with public and private stakeholders from across the state. Working with state, local,
tribal, and federal partners interested in preventing traffic crashes through strategic use
of the 6 Es of Safety: Equity, Engineering, Enforcement, Education, Emergency
Response and Everyone, Nevada’s HSP identifies proven countermeasures to move
Nevada toward Zero Fatalities, its stated goal for the last decade. With the newest E—
Equity—Nevada is committed to reaching all communities, all Nevadans, and all
roadway users with transportation safety messaging and outreach. Toward this end, the
Office of Traffic Safety (OTS) has added the following equity supporting statement to
each grant partnership agreement:

The Nevada Office of Traffic Safety has established a goal of reaching Zero Fatalities
on our roads as both an objective for the organization and as a framework for all grant
activities. As such, the OTS commits to understanding the historic and current barriers
to traffic safety as it relates to equity: the idea that, regardless of one’s age, race,
gender, ability, income, background, or other personal characteristics, all people can be
represented in traffic safety initiatives so that achieving Zero Fatalities is possible.
Through this policy position, the Office of Traffic Safety encourages all partners and
stakeholders to promote safe, fair, and equitable practices with all community members,
regardless of race, ethnicity, color, religion, sex, sexual orientation, gender identity,
national origin, or other personal demographics.
Reflecting the message that zero fatalities are acceptable, the 2022 HSP focuses on
strategies that foster the necessary behavior changes to meet this critical goal.

The federally required HSP is based on in-depth crash data trends and analyses that
identify priorities for funding and drive strategic behavioral interventions in Nevada. Data
findings from these assessments guide performance measure and program
development, which help the Nevada Department of Public Safety (DPS), OTS, in
concert with stakeholders across the state, prioritize and direct resources to efforts and
partners most likely to improve safety on Nevada roadways.
Planning and implementation of OTS’ behavioral safety programming is aligned with
efforts by Nevada’s other principal safety partners, including the Nevada Department of
Transportation (NDOT). Through NDOT’s Highway Safety Improvement Program
(HSIP), engineering improvements enhance Nevada’s roadway infrastructure to reduce
crashes, fatalities, and injuries. Together, both state agencies actively participate in the
new Nevada Advisory Committee on Traffic Safety (NV ACTS), formerly known as the
Nevada Executive Committee on Traffic Safety (NECTS). The committee comprises
traffic safety executives from agencies involved in road safety across the state,
including both OTS and NDOT leaders, working to develop a systemic approach to
eliminating traffic fatalities and serious injuries.

6
OTS’ HSP planning efforts also reflect key priorities of the 2021-2025 Nevada Strategic
Highway Safety Plan (SHSP), the comprehensive statewide plan that provides a
coordinated framework for reducing fatalities and serious injuries on Nevada’s
roadways. With leadership from NDOT and DPS, the SHSP establishes statewide goals
and strategies for critical emphasis areas (CEAs) developed in consultation with federal,
state, local, and private-sector stakeholders. Visit zerofatalitiesnv.com for more
information and history of the Nevada SHSP and HSP implementation.

The 2022 HSP supports the nine CEAs identified in the 2021-2025 SHSP that offer the
greatest potential for improving safety on Nevada roadways. The nine CEAs from the
SHSP are shown in Figure 1.

                           Figure 1: 2021-2025 Nevada SHSP CEAs

The 2022 HSP and NDOT’s HSIP share coordinated safety targets for three core
safety performance measures: the number of motor vehicle fatalities, the number of
motor vehicle serious injuries, and the rate of motor vehicle fatalities per annual vehicle
miles traveled (VMT) on Nevada roadways. These shared target measures reinforce
the commitment and focus required to reach the goal of Zero Fatalities on Nevada’s
public roads.

With approval of the 2021-2025 SHSP, the NECTS approved the new statewide goal of
Zero Fatalities by 2050. In order to set each performance measure target, a straight-
line reduction from the 2020 preliminary state number was calculated to meet the goal.
Figure 2 and Figure 3 demonstrate historical crash data trends and track the reduction
to a goal of zero fatalities and serious injuries by 2050.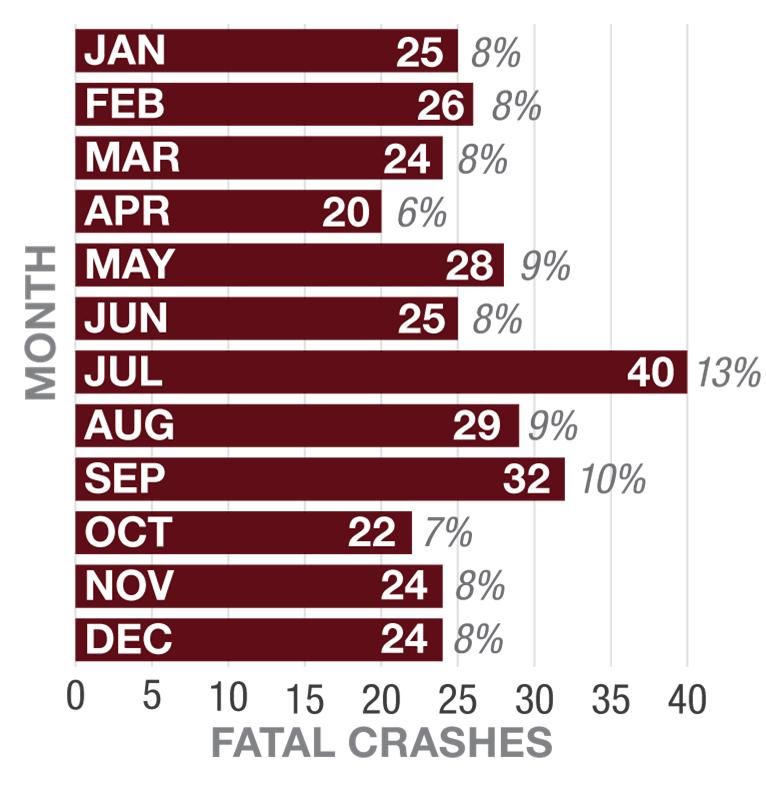
7

    Figure 2: Nevada Fatality Historical Trends

Figure 3: Nevada Serious Injuries Historical Trends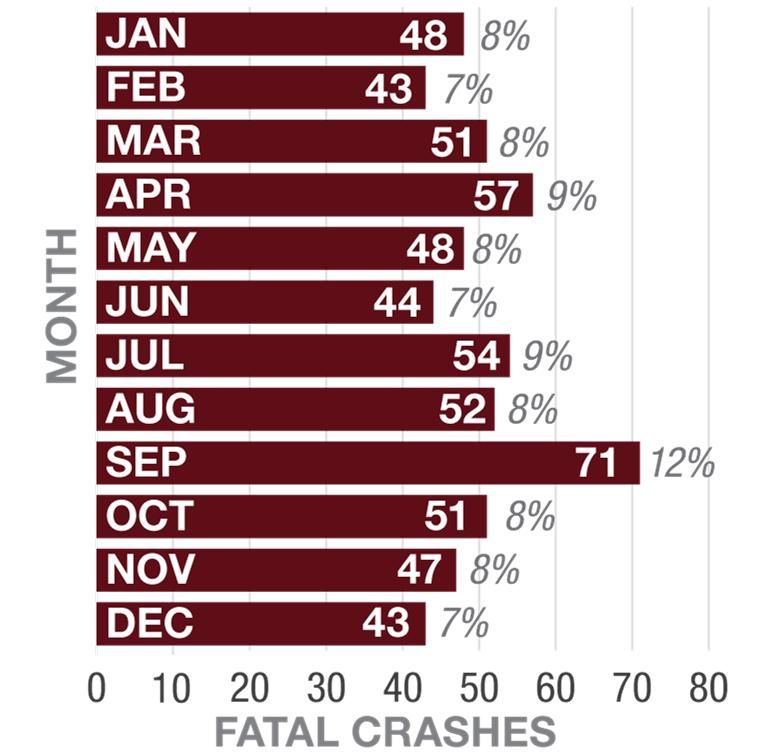
8

 2. Highway Safety Planning Process
 OTS begins its grant proposal period in January each year and provides resources and
 information to grant applicants about the priorities to be addressed and the
 countermeasures OTS envisions. Potential grantees are invited to review crash data for
 an issue and/or geographic area and propose specific strategies and actions to
 counteract these risky behaviors. The HSP provides partners with key information about
 each safety focus area, providing current data and examples of past efforts that have
 received funding to address these issues. Federal Fiscal Year (FFY) 2022 grant
 projects are supported by both state and federal funds awarded to OTS to address
 safety issues identified in the unified Nevada SHSP, moving the state closer to the goal
 of Zero Fatalities. OTS actively monitors traffic safety trends and emerging issues and
 will respond with changes to the HSP as needed. Requests for new projects or
 amendments to the HSP are submitted to National Highway Traffic Safety
 Administration (NHTSA) for approval.

                 The Goal-Setting Process
                 The annual highway safety planning process is circular and continuous. At any one
                 point in time, OTS may be working on previous, current, and upcoming fiscal year
                 plans. Due to a variety of often unpredictable factors at both the federal and state level,
                 the planning process may be interrupted by unforeseen events and mandates.
                 Figure 4 below visually captures the steps involved in the planning process.

Analyze Data                             Develop           Identify,           Provide            Evaluate
                     Define and
Rates, Trends,                         Performance     Prioritize, and        Monitoring           Results
                    Articulate the
and Priorities                          Goals and           Select               and             and Adjust
                      Problem
                                          Select          Programs            Technical           Problem
                                     Countermeasures    and Projects          Assistance         Statements
                                     Figure 4: Goal-Setting Process

 2.1. Funding Strategy
 OTS annually awards federal funds to state, local, and non-profit organizations to
 actively partner in addressing priority traffic safety concerns.
 Funds awarded are strictly for use in reducing motor vehicle fatalities and serious
 injuries through the implementation of programs or strategies addressing driver
 behavior in priority program areas. These priority areas and their respective funding
 percentages are shown in Figure 5.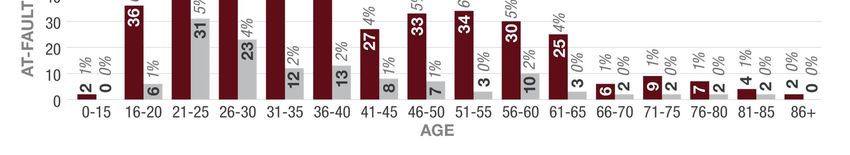
9

                          Figure 5: 2022 Total Funding by Program Area

2.2. Grant Process
Formal project selection begins with organizations submitting either a Letter of Interest
(LOI) or grant proposal to OTS. The LOI process is intended to solicit new traffic safety
partners and provide potential grant recipients with a simplified mechanism to propose
new programs. The invitation to submit an LOI includes requests for projects focused on
Nevada’s most recent data. In 2021, the 2022 grant process was impacted by the
COVID-19 pandemic. Grant application review was performed remotely, the use of
review panels was reduced, evaluation of emerging data (during the pandemic) was
required and impacts of the pandemic on local resources was considered.

Project selection criteria included the following:
  ● Is the project and supporting data relevant to the applicant’s jurisdiction or area of
    influence?
  ● Is the problem adequately identified?
  ● Is the problem identification supported by accurate and relevant local data?
  ● Is there evidence that this type of project saves lives and reduces severe crashes?
  ● Are the goals and objectives realistic and achievable?
  ● Is this project cost-effective?
  ● Is the evaluation plan sound (i.e., is the performance/progress measurable)?
  ● Is there a realistic plan for self-sustainability (if applicable)?
  ● Does the project use proven countermeasures?

2.2.1. Selection Criteria
Project selection involves constant analysis and evaluation of best practices, program
area gaps, assessment of available funds and project/program return on investment.
OTS funds projects and programs that are managed within the agency by staff, such as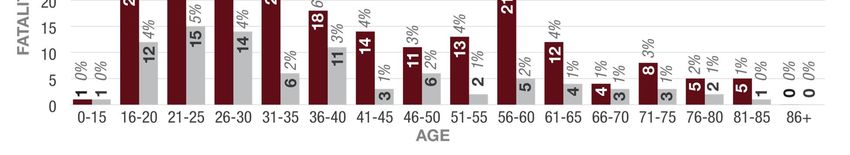
10
Zero Teen Fatalities and Drug Recognition Expert/Advanced Roadside Impaired Driving
Enforcement (DRE/ARIDE) training, as well as programs managed by subrecipients.
OTS engages its partners year-round through task force and stakeholder meetings,
trainings and presentations, the Nevada Traffic Safety Summit, and outreach events.
Information regarding funding opportunities is provided via the OTS website, eGrants
online grant system, announcements through statewide task forces, newsletters, and
email distribution.
Formal project solicitation begins with an invitation to government agencies, non-profit
organizations, and community partners to submit an LOI. The invitation to submit an LOI
cover page includes a high-level description of priority issues and links to project
development resources such as “Countermeasures That Work” and NHTSA data. LOIs
are reviewed by OTS program managers and leadership to determine congruence with
priority program areas and/or support strategies found in Nevada's SHSP. After review
grant proposal applications are accepted via the online grant administration system
eGrants and enter into an evaluation process that utilizes Peer Review Committees
comprised of OTS and NDOT staff, community specialists and subject matter experts
who discuss and score applications and prioritize for award. The final 2022 HSP project
selections were based on the following criteria:
Analysis of Nevada highway safety information system data
Effectiveness or ability to improve the identified problem
OTS program assessments and management reviews conducted by NHTSA
Support of priorities and strategies within Nevada’s SHSP
Partner efforts and/or review may be provided by:
Department of Health and Human Services
Statewide Community Coalitions
Traffic Records Coordinating Committee (TRCC)
Impaired Driving Subcommittee
Statewide law enforcement agencies
University of Nevada, Reno School of Medicine, Center for Traffic Safety
Research
University of Nevada, Las Vegas Transportation Research Center, Vulnerable
Road Users Project
NECTS (now NV ACTS) and SHSP work groups
OTS also develops statewide projects in cooperation with other state, local, and non-
profit agencies that partner on the SHSP. Local strategies and projects are developed
by working with agencies expressing an interest in implementing an evidence-based
traffic safety project in their community or jurisdiction in the annual OTS LOI grant
applications.11 2.2.2. Monitoring and Technical Assistance To ensure safety efforts are undertaken in a timely fashion and in accordance with project agreements or grant contracts, all projects awarded to state, local, and non-profit agencies are monitored by OTS. Risk assessments are conducted on each project recommended for award prior to notification of approval and are assigned a risk level. A monitoring plan is developed that takes this risk level into account. Monitoring is accomplished by observing work in progress, examining products and deliverables, reviewing activity reports, facilitating desk correspondence, and conducting on-site visits. OTS performs a desk audit of each claim and monthly progress report prior to acceptance or payment. Due to the COVID-19 pandemic, OTS is currently utilizing remote monitoring of awarded projects. In addition, OTS program managers are available to provide technical assistance to grantee project directors on an as-needed basis. Assistance may include providing and analyzing data, helping with fiscal management, providing report feedback, or giving tips for effective project management. 2.2.3. Final Reports At the close of each fiscal year, grant subrecipients must submit a final report detailing the project’s successes and challenges during the grant period. This information is compiled in the OTS Annual Report and used to evaluate progress toward OTS goals. It also aids in the assessment of future projects and documents OTS’s efforts to reduce fatalities and serious injuries.
12 2.3. Process Participants A broad range of agencies and organization partners participated in both the SHSP and HSP planning and the implementation process through the leadership of the NECTS (now NV ACTS). The NECTS included participation from the following agencies: Nevada Department of Transportation Nevada Department of Public Safety – Office of Traffic Safety Nevada Department of Public Safety – Nevada Highway Patrol Nevada Department of Motor Vehicles Nevada Department of Health and Human Services Nevada Department of Education Regional Transportation Commission of Southern Nevada Regional Transportation Commission of Washoe County Nevada Association of Counties Nevada Sheriffs’ and Chiefs’ Association Administrative Office of the Courts Nevada League of Cities Southern Nevada Health District Inter-Tribal Council of Nevada Federal Highway Administration (Ex-Officio/Non-Voting) Federal Motor Carrier Safety Administration (Ex-Officio/Non-Voting) National Highway Traffic Safety Administration (Ex-Officio/Non-Voting) Nevada Legislative Representatives Tahoe Regional Planning Agency Carson Area Metropolitan Planning Organization (CAMPO)
13
The 2021-2025 SHSP utilizes four Key Area Task Forces and the TRCC task force that
meet quarterly to develop, implement, and evaluate action steps toward eliminating fatal
and serious injury crashes, as follows: Safer Roads Key Area (CEAs: Safe Speed,
Intersections, Lane Departures), Vulnerable Road Users Key Area (CEAs: Pedestrians,
Motorcyclists), Safer Drivers and Passengers (CEAs: Occupant Protection, Older
Drivers, Young Drivers) and Impaired Driving Key Area.
OTS actively seeks new partnerships with businesses, government agencies,
associations, special interest groups, policy makers, media, and community
organizations. Our outreach also extends to bringing new participants into our statewide
Task Forces. Recent connections include:
Lyft
Zappos
PTs Entertainment Group
Regional Transportation Commission (RTC) of Washoe County/
Vision Zero Project
Reno + Sparks Chamber of Commerce
RTC Southern Nevada
Grand Sierra Resort
Hot August Nights
Las Vegas Raiders
Top Golf14 3. Data Analysis The priorities and programs of Nevada’s 2022 HSP are driven by data. The process of data analysis and problem identification involves a careful review of state crash data to identify Nevada’s most pressing traffic safety issues. This review of crash data helps to determine primary focus areas, inform resource allocation, and serves as an effectiveness measure of prior safety efforts. Nevada uses a collaborative process with relevant partners from the 6 Es of traffic safety (Equity, Engineering, Education, Enforcement, Emergency Medical Response and Everyone) and advocates to implement data-driven identification of issues, strategies, and action steps and relies heavily on the implementation of proven countermeasures and best practices. 3.1. Data Sources and Processes The crash data most often used in this analysis involves fatalities and serious injuries and is collected by law enforcement officers at the scene of traffic crashes. Nevada law enforcement agencies utilize a centralized citation and crash reporting system, Brazos, which provides timely and consistent traffic data to OTS and other partners. In recent years, the integration of crash data with trauma center data has been funded to enable further analysis of the impacts of fatalities and serious injuries to society, such as medical costs, reduction of productivity, and other harms associated with these crashes. Information related to crash incidents, vehicles, drivers, and passengers from the crash report is captured and maintained in Brazos. This database contains all related traffic information, including date, time, location, severity, manner of collision, contributing factors, weather, traffic controls, and design features of the road. Information contained in this database is accessible to traffic safety professionals, stakeholders, and the general public online at this link: https://zerofatalitiesnv.com/ Vehicle information typically includes year, make, model, and registration of the vehicles involved. Driver and passenger information typically includes age, gender, license status, and injury data. Injury Surveillance Systems (ISS) typically provide data on emergency medical services (EMS) (pre-hospital), emergency department (ED), hospital admission/discharge, trauma registry and long-term rehabilitation. Roadway information includes roadway location and classification (e.g. interstates, arterials, collectors, etc.), as well as a description of the physical characteristics and uses of the roadway. Citation data currently can be used to detect recidivism for serious traffic offenses earlier in the process (i.e., prior to conviction) and to track the behavior of law enforcement agencies and the courts with respect to dismissals and plea bargains. This data is available through direct access to query the Brazos system. Citation, injury, and roadway information are available and manually correlated to crash data for analysis. Vehicle and passenger data are only available as part of the crash report.
15
The chart below depicts the crash data collected for the driver/passenger/ road user, the
crash, the vehicles involved, and the roadway on which the crash occurred. Each
element is used to guide Nevada safety stakeholders in making key decisions about
safety priorities and resource expenditures.

                               Figure 6: Crash Data Elements

3.2. Coordination with SHSP
OTS coordinates closely with NDOT and is an active participant in the integrated SHSP
and HSP process. The 2021-2025 SHSP was approved by the Federal Highway
Administration (FHWA) in February 2021. The update process for the five-year SHSP
included a thorough review of Nevada’s crash data, designation of Key Area and CEA
Task Forces, and development of strategies and action steps. The Nevada Traffic
Safety Crash Facts (Attachment NV_FY22_Traffic Safety Crash Facts.pdf) document
was published by OTS in early 2020 and updated in 2021 to provide SHSP Task Forces
with data specific to their CEA, as well as providing data to inform implementation of
traffic safety countermeasures and development of local projects.

3.2.1. Traffic Records Coordinating Committee
In early 2010, the NECTS approved the formation of the SHSP Data Team, which was
charged with developing a unified SHSP data message. Activities included
16
recommending crash statistic definitions that are acceptable to all major data generators
and users; initiation of data integration between the 4 Es (now 6 Es) of traffic safety; and
obtaining annual data reports from OTS and NDOT for updating the CEA tracking tools
and SHSP fact sheets.
In 2016, the TRCC and its required functions were fully integrated into the SHSP, with
direct report to the NECTS, who has overall authority to consider and approve projects
that improve traffic crash data and data systems in Nevada.
The Nevada OTS HSP is guided by the same state and local crash data as the
statewide SHSP to ensure that the recommended improvement strategies and grant-
funded projects are directly linked to the factors contributing to the high frequency of
fatal and life-changing injury crashes. The ability to access reliable, timely, and accurate
data helps increase the overall effectiveness of the plan and increases the probability of
directing resources to strategies that will prevent the most crashes and assist in
identifying locations with the greatest need.
Nevada collected data from a variety of sources as a prelude to this 2022 Highway
Safety Plan, including:
Community Attitude Awareness Survey
Emergency Medical Systems
Fatality Analysis Reporting System (FARS)
Brazos Citation and Crash Reporting System
Nevada Department of Motor Vehicles (DMV)
Nevada Traffic Safety Crash Facts (see Attachment NV_FY22_Traffic Safety
Crash Facts.pdf)
NHTSA and National Center for Statistics and Analysis (NCSA) Traffic Safety
Fact Sheets
Seat Belt Observation Survey Reports
State Demographer Reports
University of Nevada, Las Vegas - Transportation Research Center (TRC)
University of Nevada, Las Vegas School of Medicine - analysis of crash and
trauma records from motor vehicle crashes - Traffic Research and Education
Newsletter (TREND)
Nevada’s traffic safety community is committed to exploring all avenues
available to reduce fatalities and serious injuries on our roadways. Additional
resources utilized in the data analysis process include the following:
Data reflecting the increase/reduction for each CEA based on the interim goals of
the SHSP
Current CEA strategies and action steps17 Recommended strategies from the local agencies and organizations such as RTCs, public transit, schools and universities, courts, etc. Serious injury data from the state’s four trauma centers, including both cost and severity of injury Consideration of other strategies and countermeasures
18

4. Equipment Request
The following table includes equipment requested that has a useful life of more than one
year and an acquisition cost of $5,000 or more.
 Grant ID             Item                  Quantity   Unit       Total      NHTSA     NHTSA
                                                       cost       Cost       Share per Share
                                                                             unit      Total Cost

 TS-2022-LVMPD-       DUI Patrol Vehicle    1          $135,000   $135,000   $135,000   $135,000
 00007
 TS-2022-LVMPD-       Toxicology Lab        1          $440,000   $440,000   $426,800   $426,800
 00193                Equipment
 TS-2022-NDOT-00163   Portable Rumble Strip 6          $11,700    $70,200    $11,700    $70,200
                      System

 TS-2022-DPS NHP      E-Warrant System      1          $40,000    $40,000    $40,000    $40,000
 00196
                                Table 1:   Equipment Request
19
5. Performance Report
Progress towards meeting State performance targets from the previous fiscal year's
HSP is shown in the table below.
2022 HSP
Performance Target Target Target Value Data Source/ On Track to
Measure: Period Year(s) FY21 HSP FY21 Progress Meet FY21
Results Target YES/NO/In-
Progress
C-1) Total Traffic 5 year 2017-2021 330.2 2015-2019 In Progress
Fatalities FARS; 2020
State /
317.8
C-2) Serious Injuries in 5 year 2017-2021 1,154.7 State / In Progress
Traffic Crashes 1071.2
C-3) Fatalities/VMT 5 year 2017-2021 1.226 FARS, FHWA / In Progress
1.166
C-4) Unrestrained Annual 2021 72.7 2015-2019 In Progress
Passenger Vehicle FARS; 2020
Occupant Fatalities, All State /
Seat Positions 68.6
C-5) Alcohol-Impaired Annual 2021 90.6 State / In Progress
Driving Fatalities 86.6
C-6) Speeding-Related Annual 2021 97.0 2015-2019 In Progress
Fatalities FARS; 2020
State /
98.2
C-7) Motorcyclist Annual 2021 60.6 2015-2019 In Progress
Fatalities FARS; 2020
State /
59.4
C-8) Unhelmeted Annual 2021 8.3 2015-2019 In Progress
Motorcyclist Fatalities FARS; 2020
State /
6.8
C-9) Drivers Age 20 or 3 year 2019-2021 32.6 2015-2019 In Progress
Younger Involved in Fatal FARS; 2020
Crashes State /
33.4
C-10) Pedestrian Fatalities 5 year 2017-2021 82.7 2015-2019 In Progress
FARS; 2020
State /
79.2
C-11) Bicyclist Fatalities 5 year 2017-2021 8.8 2015-2019 In Progress
FARS; 2020
State /
8.420
B-1) Observed Seat Belt Annual 2021 91.58 2019 State In Progress
Use for Passenger Survey /
Vehicles, Front Seat 92.05
Outboard Occupants
A-1) Number of traffic 5 Year 2017-2021 0.3 2015-2019 No
fatalities of children Age 0- FARS; 2020
4 State /
0.8
A-2) Number of traffic 5 Year 2017-2021 8.3 State / In Progress
fatalities reported as 10.2
distracted driving
C-C-1) The percentage of Annual 2021 92 State / Yes
crash records with no 99.99
missing critical data
elements
C-T-1) Traffic Records Annual 2021 12 State / In Progress
Crash Timeliness Median 5.97
Days
C-T-2) Percentage crash Annual 2021 92 State / Yes
report entered into database 93.87
within 30 days after the
crash
Table 2: Performance Measure Targets FY 2021 Progress
5.1. Performance Measure C-1: Fatalities
Progress: In Progress
Nevada is making progress towards our 2021 performance target for fatalities from the
previous fiscal year’s HSP of a 5-year average of 330.2 fatalities for the years 2017 to
2021. As shown in Figure 7, Nevada’s preliminary fatality number for 2020 (316) and
the five-year average of 317.8 are on track to be below the 2020 target.
350 329 329 304 316
326 311
288.6 291
300 261 266
317.2 319.8 317.8
294.6 304.6
250 278.0
266.2 254.6 264.2
200 246
150
100
50
0
2011 2012 2013 2014 2015 2016 2017 2018 2019 2020
# of Fatalities # of Fatalities: 5-Year Average
Figure 7: Nevada Traffic Fatalities and Five-Year Average (2011-2020)21
5.2. Performance Measure C-2: Serious Injuries
Progress: In Progress
Nevada is making progress towards our 2021 performance target for serious injuries
from the previous fiscal year’s HSP of a 5-year average of 1,154.7 serious injuries for
the years 2017 to 2021. As shown in the chart below, Nevada’s preliminary serious
injury number for 2020 of 968 has been declining the last six years, is the lowest in the
last ten years and the last two years have been below the 2021 target.
1600 1489.4
1335.6
1400 1265.4 1225.4 1349 1273 1228.6 1193.4
1147.4 1071.2
1200
1000 1229.6 1240.4
1219
1161 1207 1102 1031
800 1212 982 968
600
400
200
0
2011 2012 2013 2014 2015 2016 2017 2018 2019 2020
# of Serious Injuries # of Serious Injuries: 5-Year Average
Figure 8: Nevada Serious Injuries and Five Year Average (2011-2020)
5.3. Performance Measure C-3: Fatality Rate/100 Million
VMT
Progress: In Progress
Nevada is on track to meet our 2021 performance target for fatality rate from the
previous fiscal year’s HSP of a 5-year average of 1.226 for the years 2017 to 2021. As
shown in the chart below, Nevada’s preliminary fatality rate for 2020 is 1.25 and the 5-
year average of 1.166 is under the target.
Fatality Rate/100 Million VMT
1.4 1.322 1.23 1.25
1.202 1.15 1.26 1.16
1.08 1.13 1.167
1.2 1.02
1 1.160 1.170 1.185 1.166
1.106 1.098 1.118
1.08 1.06
0.8
0.6
0.4
0.2
0
2011 2012 2013 2014 2015 2016 2017 2018 2019 2020
Fatality Rate /100 million VMT Fatality Rate /100 million VMT: 5-Year Average
Figure 9: Fatality Rate Per 100 Million VMT and Five-Year Average (2011-2020)22
5.4. Performance Measure C-4: Unrestrained Passenger
Vehicle Occupant Fatalities, All Positions
Progress: In Progress
Nevada is on track to meet our 2021 performance target for Unrestrained Passenger
Vehicle Occupant fatalities from the previous fiscal year’s HSP of a 5-year average of
72.7 fatalities for the years 2017 to 2021. As shown in the chart below, Nevada’s
preliminary unrestrained fatality number for 2020 of 71 and the 2020 5-year average are
below the target.
Unrestrained Passenger Fatalities
100
86.0
72 76
80 72 69 68.8 71
64 63 65
57 55
60 73.8 70.8 68.6
67.0 65.2 64.2 65.8 67.0
40
20
0
2011 2012 2013 2014 2015 2016 2017 2018 2019 2020
# of Unrestrained Passenger Fatalities # of Unrestrained Passenger Fatalities: 5-Year Average
Figure 10:Unrestrained Passenger Fatalities and Five-Year Average (2011-2020)
5.5. Performance Measure C-5: Number of Fatalities in
Crashes Involving a Driver or Motorcycle Operator
with a BAC of 0.08 and Above
Progress: In Progress
Nevada is on track to meet our 2021 performance target for alcohol impaired fatalities
from the previous fiscal year’s HSP of a 5-year average of 90.6 fatalities for the years
2017 to 2021. As shown in the chart below, Nevada’s preliminary alcohol impaired
annual fatality number for 2020 of 66 and the 2020 5-year average of 86.6 are well
below the 2021 target.23
Fatalities Involving Driver with >0.08 BAC
120
102
86.4 93 99 92.0 93.4 92
100 86.6
85 81
80 92.0 93.2
85.6
79.8 79.6
60 74.8 88
70 85
66
40
20
0
2011 2012 2013 2014 2015 2016 2017 2018 2019 2020
# of Fatalities Involving Driver w/ > .08 BAC # of Fatalities Involving Driver w/ > .08 BAC: 5-Year Average
Figure 11:Fatalities Involving Alcohol Impaired Driver and Five-Year Average (2011-2020)
5.6. Performance Measure C-6: Speeding-Related
Fatalities
Progress: In Progress
Nevada is on track to meet our 2021 performance target for speeding-related fatalities
from the previous fiscal year’s HSP of a 5-year average of 97.0 fatalities for the years
2017 to 2021. As shown in the chart below, Nevada’s preliminary fatality number for
2020 of 90 is below the target and is on track to below the target by 2021.
140 126
120 112 104.6 105.2
102 100 102.6 98.2
88.2 90
100
106.0
80 96.0
89.2 88.6 89.8
60 76 95 93 87 90
40
20
0
2011 2012 2013 2014 2015 2016 2017 2018 2019 2020
# of Speeding-Related Fatalities # of Speeding-Related Fatalities: 5-Year Average
Figure 12:Nevada Speeding-Related Fatalities and Five-Year Average (2011-2020)
5.7. Performance Measure C-7: Number of Motorcyclist
Fatalities
Progress: In Progress
Nevada is on track to meet our 2021 performance target for motorcyclist fatalities from
the previous fiscal year’s HSP of a 5-year average of 60.6 fatalities for the years 2017 to24
2021. As shown in the chart below, Nevada’s preliminary fatality number for 2020 of 55
motorcyclist fatalities and the 2020 5-year average of 59.4 is below the target.
80 74
70 63 61.0 60.8
59 55 59.4 59.4
60
50 48.2 46.6
58.8
40 50.8 52.2 58 55
46.6 54 56
30 41 43
20
10
0
2011 2012 2013 2014 2015 2016 2017 2018 2019 2020
# of Motorcyclist Fatalities # of Motorcyclist Fatalities: 5-Year Average
Figure 13:Nevada Motorcyclist Fatalities and Five-Year Average (2011-2020)
5.8. Performance Measure C-8: Number of Unhelmeted
Motorcyclist Fatalities
Progress: In Progress
Nevada is on track to meet our 2021 performance target for unhelmeted motorcyclist
fatalities from the previous fiscal year’s HSP of a 5-year average of 8.3 fatalities for the
years 2017 to 2021. As shown in the chart below, Nevada’s preliminary fatality number
for 2020 of 3 unhelmeted motorcyclist fatalities the 2020 5-year average of 6.8 is below
the target.
14
12
12 11
10 9.4
9.2
10
7.8 8
8 7 9.6 6.8
5 8.4 8.0 8.2 8 8.4
6
6.8 8
4 3 3
2
0
2011 2012 2013 2014 2015 2016 2017 2018 2019 2020
# of Unhelmeted Motorcyclist Fatalities # of Unhelmeted Motorcyclist Fatalities: 5-Year Average
Figure 14:Unhelmeted Motorcyclist Fatalities and Five-Year Average (2011-2020)25
5.9. Performance Measure C-9: Number of Drivers Age
20 or Younger Involved in Fatal Crashes
Progress: In Progress
Nevada is on track to meet our 2021 performance target for driver’s age 20 or younger
fatalities from the previous fiscal year’s HSP of a 5-year average of 32.6 fatalities for the
years 2017 to 2021. As shown in the chart below, Nevada’s preliminary fatality number
for 2020 is 37 and the 2020 5-year average is 33.4. Although these numbers are above
the 2021 target, the target is still attainable in 2021.
50
37 39 39 37
40 35 34.4 34 33.8
40.6 30
30 34.2 36.0 35.2
33.4 33.4
30.2 30.2 27
20 26 30
10
0
2011 2012 2013 2014 2015 2016 2017 2018 2019 2020
# of Drivers Age 20 or Younger in Fatal Crashes
# of Drivers Age 20 or Younger in Fatal Crashes: 5-Year Average
Figure 15:Young Driver Traffic Fatalities and Five-Year Average (2011-2020)
5.10. Performance Measure C-10: Pedestrian Fatalities
Progress: In Progress
Nevada is on track to meet our 2021 performance target for pedestrian fatalities from
the previous fiscal year’s HSP of a 5-year average of 82.7 pedestrian fatalities for the
years 2017 to 2021. As shown in the chart below, Nevada’s preliminary fatality number
for 2020 is 84 and the 5-year average of 79.2 is below the target.
100 91
80 84
79
80 71 75.6
65 66
55 77.4 79.2
60 74.6
46 67.4
60.6 62
40 54.6
45.0 45.6 47.4
20
0
2011 2012 2013 2014 2015 2016 2017 2018 2019 2020
# of Pedestrian Fatalities # of Pedestrian Fatalities: 5-Year Average
Figure 16:Pedestrian Fatalities and Five-Year Average (2011-2020)26
5.11. Performance Measure C-11: Bicyclists Fatalities
Progress: In Progress
Nevada is on track to meet our 2020 performance from the previous fiscal year’s HSP of
a 5-year average of 8.8 bicycle fatalities for the years 2017 to 2021. As shown in the
chart below, Nevada’s preliminary bicycle fatality number for 2020 is 11, but the 5-year
average of 8.4 is below the target.
12 11
10
10 9 8.2 8.2 8.4
8
8 6.6 7 6.4 6.8
5.2 5.2 5.6 8.0 8 8
6
4
4 3 6
2
0
2011 2012 2013 2014 2015 2016 2017 2018 2019 2020
# Bicycle Fatalities # Bicycle Fatalities: 5-Year Average
Figure 17:Bicyclists Fatalities and Five-Year Average (2011-2020)
5.12. Performance Measure B-1: Observed Seat Belt
Usage
Progress: In Progress
Nevada is on track to meet our 2021 performance target for percent observed belt use
from the previous fiscal year’s HSP of 91.58%. As shown in the chart below, Nevada’s
percent observed seat belt use has been increasing the last four years and was 94.2
percent in 2019. Nevada requested a waiver for 2020 and has reported the 2019
percentage for 2020.
Percent Observed Seat Belt Use
96.0 94.8
94.1 94.0 94.2 94.2
94.0 93.10
92.16 92.18
91.94 91.9
92.0 93.32
92.72 92.1
92.24 92.05
90.0 89.4 91.60 91.64
90.5 90.6
88.0
86.0
2011 2012 2013 2014 2015 2016 2017 2018 2019 2020
% Observed Belt Use # Observed Belt Use PV-FSOO: 5-Year Average
Figure 18:Percent Observed Seat Belt Use and Five-Year Average (2011-2020)27
5.13. Performance Measure A-1: Child Passenger Safety
Progress: In Progress
Nevada is not on track to meet our 2021 performance target for fatalities from the
previous fiscal year’s HSP of a 5-year average of 0.3 Children Age 0-4 fatalities for the
years 2017 to 2021. As shown in the chart below, Nevada’s Children Age 0-4 fatalities
was one (1) in 2020 and with 2 in 2017, the lowest it can be for Nevada for 2017 to
2021 is a 5-year average of 0.6.
Children Age 0-4 Fatalities
5
4
4
3
2.4
2 2 2
2 1.8
1.4
1 2.0 0.6 1
1 1.6 1.8 1.8 1.8
1 0 0.8
0 0
0
2011 2012 2013 2014 2015 2016 2017 2018 2019 2020
# Children Age 0-4 Fatalities # Children Age 0-4 Fatalities: 5-Year Average
Figure 19:Figure 19: Child Age 0-4 Fatalities and Five-Year Average (2011-2020)
5.14. Performance Measure A-2: Number of Traffic
Fatalities Reported as Distracted Driving
Progress: In Progress
Nevada is making progress towards our 2021 performance target for distracted driving
fatalities from the previous fiscal year’s HSP of a 5-year average of 8.3 fatalities for the
years 2017 to 2021. As shown in the chart below, Nevada’s distracted driving fatality
number for 2020 is 10 which is under the 5-year average of 10.2.
Distracted Driving Fatalities
25
21 20
20 17.0 17.2
15 14.4 15
15 12.4 11.2
14.4 10
10 14.0 15 15 7
10.0 10.2
5 10
7.0 9
0
2011 2012 2013 2014 2015 2016 2017 2018 2019 2020
# Distracted Driving Fatalities # Distracted Driving Fatalities: 5-Year Average
Figure 20:Distracted Driving Fatalities and Five-Year Average (2011-2020)28
5.15. Performance Measure C-C-1: The percentage of
crash records with no missing critical data elements
Progress: Yes
Nevada established a target for crash record completeness of critical data elements for
2021 to be 92%. This data began to be tracked in 2019 and Nevada was at 91% of
records with all critical data elements in 2019 and has increased to 99.9952% for 2020.
Supporting information provided in Attachment NV_FY22_405c_Quantitative
Improvement C.C.1 NV Secondary Collisions.pdf.
5.16. Performance Measure C-T-1: Traffic Records Crash
Timeliness Median Days
Progress: In Progress
Nevada has been working diligently towards the 2021 performance measure of 12
median days from the crash date to the date the crash report is entered into the NCATS
database but is not able to confirm yet if this measure has been met. This was set with
7 days provided for the law enforcement agency to approve the crash and transfer it to
NDOT and an additional 7 days for NDOT Traffic Safety Engineering to review and
clean the data and upload the crashes into NCATS. However, there has been
challenges with the data transfer from the Brazos system with law enforcement agency
crash data to NCATS that has caused errors with the data transfer that has led to
Nevada not meeting this target yet.
5.17. Performance Measure C-T-2: Percentage Crash
Report Entered into Database within 30 Days after
the Crash
Progress: Yes
Nevada met the performance target at 92 percent of crash reports entered into the
database within 30 days after the crash with a current rate of 93.87%. The process had
been 60, 90 days or longer over the last few years but a significant amount of effort has
been focused on improving the electronic transfer of files between law enforcement
agencies.29
6. HSP Problem Identification
The Nevada 2022 HSP is closely aligned with the Nevada SHSP. Both plans identify
issues with the greatest involvement in fatal and serious injury crashes and prioritize the
actions that can best mitigate them. Official FARS data from NHTSA is used for
fatalities whenever possible, with state data providing additional crash parameters and
VMT.
This information, along with strategies for addressing the identified critical issues (found
in NHTSA’s “Countermeasures That Work” publication), help to determine where to
focus HSP and SHSP efforts and resources and to evaluate effectiveness. Visit
https://www.nhtsa.gov/sites/nhtsa.gov/files/documents/812478_countermeasures-that-
work-a-highway-safety-countermeasures-guide-.pdf for a full reference to this resource.
Nevada’s SHSP was recently approved for the next five years (2021-2025). The HSP
will continue to support the strategies and goals of the SHSP. The 2022 HSP is
supportive of the following nine CEAs as established within the 2021-2025 SHSP:
Impaired Driving Prevention Older Drivers
Intersection Safety Safe Speed
Lane Departure Prevention Pedestrian Safety
Motorcycle Safety Young Driver Safety
Occupant Protection
Powered by the collective experience of diverse safety stakeholders, traffic safety task
forces associated with each CEA meet quarterly to discuss strategies and assess the
implementation of defined actions for each CEA. Additional areas of interest such as
tribal safety, bicycles, older drivers, and outreach to minority populations are
incorporated into the strategies of each task force. OTS staff are actively involved in all
task forces, with a lead role in the CEAs that have a behavioral safety focus.30
The crash data summary for the key elements of Nevada’s safety program for the past
10 years is provided in Table 3. All fatality data shown for years 2011 through 2018 is
reported from FARS. Fatality data for 2019 is reported from preliminary FARS in the
Annual Report File. Fatality data for 2020 is preliminary state data. Serious injury data
and seat belt usage percentage for all years is reported by the state. Nevada fatality
data is provided in a separate document, Nevada Traffic Safety Crash Facts (see
Attachment NV_FY22_Traffic Safety Crash Facts.pdf).
Crash Data Summary 2011 2012 2013 2014 2015 2016 2017 2018 2019 2020
Fatalities (Actual) 246 261 266 291 326 329 311 329 304 316
Serious Injuries 1,219 1,161 1,207 1,212 1,349 1,273 1,102 1,031 982 968
Fatality Rate/100 Million
VMT 1.02 1.08 1.08 1.15 1.26 1.23 1.13 1.16 1.06 1.25
Unrestrained Passenger
Vehicle Occupant 64 63 57 65 72 72 69 76 55 71
Fatalities
Fatalities Involving
Driver or Motorcycle 70 85 81 93 99 102 85 88 92 66
Operator w/ > .08 BAC
Speeding-Related
Fatalities 76 102 90 100 112 126 95 93 87 90
Motorcyclist Fatalities 41 43 59 63 55 74 54 58 56 55
Unhelmeted
Motorcyclist Fatalities 5 10 7 8 11 12 8 8 3 3
Drivers Age 20 or
Younger Involved in 26 35 30 37 39 39 27 34 30 37
Fatal Crashes
Pedestrian Fatalities 46 55 65 71 66 80 91 79 62 84
Children Age 0-4
Fatalities 1 2 2 4 0 1 2 0 0 1
Bicycle Fatalities 4 3 7 8 10 6 9 8 8 11
Distracted Driving
Fatalities 21 15 20 15 15 7 15 10 9 10
Percent Observed Seat
Belt Use for Passenger
Vehicles—Front Seat 94% 91% 95% 94% 92% 89% 91% 92% 94% 94%
Outboard Occupants
Table 3: Crash Data Summary31 7. Performance Measures Targets for 2022 were set to reflect Nevada’s Zero Fatalities goal of zero fatalities and serious injuries by 2050. The target for 2022 was estimated by using a straight-line reduction from the 2020 annual value to reaching zero in 2050. The resulting five-year average set the target for 2022. A summary of all of Nevada’s performance measures is shown in Table 4. Additional details on the three performance measures shared by the Nevada SHSP, HSP, and HSIP (fatalities, serious injuries, and fatality rate) are included on the following pages. Details on the remaining HSP performance measures are incorporated into the HSP program area sections in Section 8.
32

 Five Year Average                                                                                  2020 2021 2022
                        2011    2012       2013    2014    2015    2016    2017    2018    2019
    and Targets                                                                                    Prelim     Target

C-1 Fatalities          288.6    266.2     254.6   264.2   278.0   294.6   304.6   317.2   319.8   317.8   313.1   309.9

C-2 Serious Injuries    1,489.4 1,335.6 1,265.4 1,225.4 1,229.6 1,240.4 1,228.6 1,193.4 1,147.4 1,071.2 1,003.7    964.0

C-3 Fatality Rate       1.322    1.202     1.106   1.098   1.118   1.160   1.170   1.185   1.167   1.166   1.162   1.171

C-4 Unrestrained         86.0    73.8      67.0    65.2    64.2    65.8    67.0    70.8    68.8     68.6   67.9    67.4

C-5
                         86.4    79.8      74.8    79.6    85.6    92.0    92.0    93.4    93.2     86.6   78.9    74.2
> .08% BAC

C-6 Speeding             88.2    89.2      88.6    89.8    96.0    106.0   104.6   105.2   102.6    98.2   90.4    88.2

C-7 Motorcyclist         48.2    46.6      46.6    50.8    52.2    58.8    61.0    60.8    59.4     59.4   55.2    54.7

C-8 Unhelmeted           7.8      8.4       6.8     8.0     8.2     9.6     9.2     9.4     8.4     6.8     5.0     3.9

C-9 Drivers Age 20
                         40.6    34.2      30.2    30.2    33.4    36.0    34.4    35.2    33.8     33.4   32.8    34.3
or Younger

C-10 Pedestrians         45.0    45.6      47.4    54.6    60.6    67.4    74.6    77.4    75.6     79.2   79.4    76.9

C-11 Bicyclists          6.6      5.2       5.2     5.6     6.4     6.8     8.0     8.2     8.2     8.4     9.3     9.6

A-2 Distracted Driver    7.0     10.0      14.0    17.0    17.2    14.4    14.4    12.4    11.2     10.2   10.7     9.6

A-1 Children Age 0-4
(only when restraint     2.4      1.6       1.8     2.0     1.8     1.8     1.8     1.4     0.6     0.8     0.8     0.6
use was known)
B-1 Percent
Observed Belt Use
for Passenger
                        92.24    91.94     92.72   93.32   93.10   92.16   92.18   91.60   91.64   92.05   93.1    93.8
Vehicles—Front Seat
Outboard Occupants
(%)
                         Table 4:       Performance Measures Five-Year Average and Targets
33
7.1. Performance Measure C-1: Fatalities
The target for fatalities for 2022 was set to meet Nevada’s Zero Fatalities and Serious
Injuries Goal of reaching zero in 2050. The target for 2022 fatalities was estimated by
using a straight-line reduction from the 2020 annual value to reaching zero in 2050. The
resulting five-year average is 309.9 fatalities in 2022.
The following table includes the 2016-2020 fatalities, five-year average and the 2022
target.
2020 2022
Crash Data and Targets 2016 2017 2018 2019 2021
Prelim Target
Fatalities 329 311 329 304 316 305 295
Five-Year Average 294.6 304.6 317.2 319.8 317.8 313.1 309.9
Table 5: Performance Measure C-1: Fatalities
329 319.8 317.8 313.1 309.9
350
300
317.2 304 316
250 305 295
200
150
100
50
0
2018 2019 2020 2021 2022
# of Fatalities # of Fatalities: 5-Year Average
Figure 21:2022 Target for Fatalities34
7.2. Performance Measure C-2: Serious Injuries
The target for serious injuries for 2022 was set to meet Nevada’s Zero Fatalities and
Serious Injuries Goal of reaching zero in 2050. The target for 2022 serious injuries was
estimated by using a straight-line reduction from the 2020 annual value to reaching zero
in 2050. The resulting five-year average is 964.0 serious injuries in 2022.
The following table includes the 2016-2020 number of serious injuries, the five-year
average, and the 2022 target.
2020 2022
Crash Data and Targets 2016 2017 2018 2019 2021
Prelim Target
Serious Injuries 1,273 1,102 1,031 982 968 936 903
Five-Year Average 1,240.4 1,228.6 1,193.4 1,147.4 1,071.2 1,003.7 964.0
Table 6: Performance Measure C-2: Serious Injuries
2022 Target for Serious Injuries
1400
1193.4 1147.4
1200
1071.2
936 903
1000
1031 982
800 968 1003.7 964.0
600
400
200
0
2018 2019 2020 2021 2022
# of Serious Injuries # of Serious Injuries: 5-Year Average
Figure 22:2022 Target for Serious Injuries35
7.3. Performance Measure C-3: Fatality Rate Per 100
Million VMT
The target for fatality rate per 100 million VMT for 2022 was set to meet Nevada’s Zero
Fatalities and Serious Injuries Goal of reaching zero in 2050. The target for 2022 fatality
rate was estimated by using a straight-line reduction from the 2020 annual value to
reaching zero in 2050. The resulting five-year average is 1.171 fatality rate per 100
million VMT in 2022.
The following table includes the 2016-2020 fatalities rates per 100 million vehicle miles
traveled (VMT), the five-year average, and the 2022 target.
2020 2022
Crash Data and Targets 2016 2017 2018 2019 2021
Prelim Target
Fatality Rate/100 Million VMT 1.23 1.13 1.16 1.06 1.25 1.21 1.17
Five-Year Average 1.160 1.170 1.185 1.167 1.166 1.162 1.171
Table 7: Total Fatality Rate Per 100 Million VMT
1.40 1.185 1.21
1.167 1.166 1.17
1.20
1.00 1.16 1.06 1.25 1.162 1.171
0.80
0.60
0.40
0.20
0.00
2018 2019 2020 2021 2022
Fatality Rate /100 million VMT Fatality Rate /100 million VMT: 5-Year Average
Figure 23:2022 Target for Fatality Rate/100 Million VMT36
8. HSP Program Areas
The following sections include information on the performance measures and problem
identification for the following program areas:
Occupant Protection (Adult and Child Passenger Safety)
Impaired Driving (Drug and Alcohol)
Speed Management
Motorcycle Safety
Young Drivers
Non-Motorized (Pedestrians and Bicyclists)
Distracted Driving
Communications (Media)
Traffic Records
8.1. Occupant Protection (Adult and Child Passenger
Safety [CPS])
Occupant protection includes planning and developing traffic injury control safety
programs in the areas of seat belts, Child Passenger Safety (CPS) seat use, and
automatic occupant protection systems. Nevada’s HSP includes a comprehensive
occupant protection program that educates and motivates the public to properly use
available motor vehicle occupant protection systems. A combination of legislation and
use requirements, enforcement, communication, education, and incentive strategies is
necessary to achieve significant, lasting increases in seat belt and child car seat usage.
8.1.1. Description of Highway Safety Problem
A fatal unrestrained-occupant crash involves a person traveling in a passenger vehicle
that did not use a restraining device, such as a seatbelt, that died in the crash.
Passenger vehicles are constituted as passenger cars, light trucks, pickups, and vans.
The FARS data uses the attribute “restraint system/helmet use (REST_USE)” in the
person data set to determine if a person was using a seatbelt, and the attribute “injury
severity (INJ_SEV)” to determine the level of the person’s injuries. For this analysis, the
two attribute codes used were “none used/not applicable” for restraint use and “fatal
injury (K)” for injury severity. If a crash reported both attributes, the crash was deemed a
fatal unrestrained-occupant crash. All occupant protection crash data presented in
Section 8.1.1 is located in the Attachment NV_FY22_Traffic Safety Crash Facts.pdf.37
What?
Between 2015 and 2019, 344 fatalities and 319 fatal unrestrained-occupant crashes
occurred on Nevada roadways.
Figure 24: Unrestrained-Occupant
Fatalities in Nevada (2015-2019) Figure 25: Fatal Unrestrained-Occupant
Crashes in Nevada (2015-2019)
Where?
Between 2015 and 2019, 187 fatal unrestrained-occupant crashes occurred in Clark
County. More than half of fatal unrestrained-occupant crashes occurred on urban
roadways.
Figure 26: Fatal Unrestrained-Occupant Crashes in Nevada (2015-2019)38
Who?
Figure 27: Age/Gender Breakdown of Unrestrained-Occupant Fatalities in Nevada
When?
Figure 28: Fatal Unrestrained-Occupant Figure 29: Fatal Unrestrained-Occupant
Crashes by Day of Week (2015- Crashes by Month of Year
2019)39
Figure 30: Fatal Unrestrained-Occupant Crashes by Time of Day (2015-2019)
Why?
Figure 31: Fatal Unrestrained-Occupant Crashes by Crash Type (2015-2019)40
Child Passenger Crashes
A child passenger crash involves a child between the ages of zero and 13 that dies in a
crash. The FARS data uses the person data file attributes “age (AGE),” “person type
(PER_TYP),” and “injury severity (INJ_SEV).” The following attribute codes were used:
values equal to and between zero and 13 to identify age, “passenger of a motor vehicle
in transport,” and “fatal injury (K).” If a crash reported all the individual attribute codes,
the crash was deemed a fatal child passenger crash. Fatal child passenger crashes
make up too small of a percentage of all fatalities and fatal crashes in Nevada to
perform a full analysis.
What?
During 2015 to 2019, 16 fatalities and 16 child passenger fatal crashes occurred on
Nevada roadways.
Figure 32: Child Passenger Fatalities in Nevada (2015-2019)
Figure 33: Fatal Child Passenger Crashes in Nevada (2015-2019)41
Where?
The majority of fatal child passenger crashes occurred in Clark County and on urban
roadways.
Figure 34: Fatal Child Passenger Crashes in Nevada by Location (2015-2019)*You can also read