First ground-based Fourier transform infrared (FTIR) spectrometer observations of HFC-23 at Rikubetsu, Japan, and Syowa Station, Antarctica
←
→
Page content transcription
If your browser does not render page correctly, please read the page content below

Atmos. Meas. Tech., 14, 5955–5976, 2021
https://doi.org/10.5194/amt-14-5955-2021
© Author(s) 2021. This work is distributed under
the Creative Commons Attribution 4.0 License.

First ground-based Fourier transform infrared (FTIR) spectrometer
observations of HFC-23 at Rikubetsu, Japan,
and Syowa Station, Antarctica
Masanori Takeda1,a , Hideaki Nakajima2,1 , Isao Murata1 , Tomoo Nagahama3 , Isamu Morino2 , Geoffrey C. Toon4 ,
Ray F. Weiss5 , Jens Mühle5 , Paul B. Krummel6 , Paul J. Fraser6 , and Hsiang-Jui Wang7
1 Graduate   School of Environmental Studies, Tohoku University, Sendai, Miyagi, 980-8572, Japan
2 National  Institute for Environmental Studies, Tsukuba, Ibaraki, 305-8506, Japan
3 Institute for Space–Earth Environmental Research, Nagoya University, Nagoya, Aichi, 464-8601, Japan
4 Jet Propulsion Laboratory, California Institute of Technology, Pasadena, CA 91109, USA
5 Scripps Institution of Oceanography (SIO), University of California San Diego, La Jolla, CA 92093-0244, USA
6 Climate Science Centre, Commonwealth Scientific and Industrial Research Organisation (CSIRO), Oceans and Atmosphere,

Aspendale, Victoria, 3195, Australia
7 School of Earth and Atmospheric Sciences, Georgia Institute of Technology, Atlanta, GA 30332-0340, USA
a now at: Institute for Agro-Environmental Sciences, National Agriculture and Food Research Organization,

Tsukuba, Ibaraki, 305-8604, Japan

Correspondence: Hideaki Nakajima (nakajima@nies.go.jp)

Received: 18 December 2020 – Discussion started: 13 January 2021
Revised: 28 May 2021 – Accepted: 16 June 2021 – Published: 3 September 2021

Abstract. We have developed a procedure for retriev-            the spectroscopic parameters used to obtain HFC-23, H2 O,
ing atmospheric abundances of HFC-23 (CHF3 ) with a             HDO, and CH4 abundances. For comparison between FTIR-
ground-based Fourier transform infrared (FTIR) spectrom-        retrieved HFC-23 total columns and surface dry-air mole
eter and analyzed the spectra observed at Rikubetsu,            fractions provided by AGAGE (Advanced Global Atmo-
Japan (43.5◦ N, 143.8◦ E), and at Syowa Station, Antarc-        spheric Gases Experiment), FTIR-retrieved HFC-23 dry-
tica (69.0◦ S, 39.6◦ E). The FTIR retrievals were carried out   air column-averaged mole fractions (XHFC-23 ) were calcu-
with the SFIT4 retrieval program, and the two spectral win-     lated. The FTIR-retrieved XHFC-23 values at Rikubetsu and
dows of 1138.5–1148.0 cm−1 and 1154.0–1160.0 cm−1 in            Syowa Station have negative biases of −15 % to −20 %
the overlapping ν2 and ν5 vibrational–rotational transition     and −25 % compared to the AGAGE datasets, respec-
bands of HFC-23 were used to avoid strong H2 O absorp-          tively. These negative biases might mainly come from sys-
tion features. We considered O3 , N2 O, CH4 , H2 O, HDO,        tematic uncertainties of HFC-23 spectroscopic parameters.
CFC-12 (CCl2 F2 ), HCFC-22 (CHClF2 ), peroxyacetyl ni-          The trend of the FTIR-retrieved XHFC-23 data at Riku-
trate (PAN) (CH3 C(O)OONO2 ), HCFC-141b (CH3 CCl2 F),           betsu was derived for December to February (DJF) obser-
and HCFC-142b (CH3 CClF2 ) to be interfering species.           vations, which are considered to represent the background
Vertical profiles of H2 O, HDO, and CH4 are preliminar-         values when an air mass reaching Rikubetsu has the least
ily retrieved with other independent spectral windows be-       influence by transport of HFC-23 emissions from nearby
cause these profiles may induce large uncertainties in the      countries. The DJF trend of Rikubetsu over the 1997–
HFC-23 retrieval. Each HFC-23 retrieval has only one            2009 period is 0.810 ± 0.093 ppt yr−1 (ppt: parts per tril-
piece of vertical information with sensitivity to HFC-23        lion), which is in good agreement with the trend derived
in the troposphere and the lower stratosphere. Retrieval        from the annual global mean datasets of the AGAGE 12-
errors mainly arise from the systematic uncertainties of        box model for the same period (0.820 ± 0.013 ppt yr−1 ).

Published by Copernicus Publications on behalf of the European Geosciences Union.
5956                                                     M. Takeda et al.: First ground-based FTIR observations of HFC-23

The DJF trend of Rikubetsu over the 2008–2019 period is            2010 are estimated to have reached 386 ± 41 Gg yr−1 by an
0.928 ± 0.108 ppt yr−1 , which is consistent with the trend in     inverse model (Simmonds et al., 2018a). HFC-23 emissions
the AGAGE in situ measurements at Trinidad Head (41.1◦ N,          have been increasing as a consequence.
124.2◦ W) for the same period (0.994 ± 0.001 ppt yr−1 ). The          Currently, hydrofluorocarbons (HFCs) are widely used as
trend of the FTIR-retrieved XHFC-23 data at Syowa Station          substitutes for CFCs and HCFCs because they do not con-
over the 2007–2016 period is 0.819 ± 0.071 ppt yr−1 , which        tain ozone-depleting halogen atoms (Cl or Br). However,
is consistent with that derived from the AGAGE in situ mea-        HFC-23 is not used as a substitute for CFCs or HCFCs, but
surements at Cape Grim (40.7◦ S, 144.7◦ E) for the same            it is used in halon-1301 (CBrF3 ) production, semiconduc-
period (0.874 ± 0.002 ppt yr−1 ). Although there are system-       tor manufacturing, very low-temperature refrigeration, and
atic biases in the FTIR-retrieved XHFC-23 at both sites, these     specialty fire extinguishers (Oram et al., 1998; Miller et al.,
results indicate that ground-based FTIR observations have          2010, Simmonds et al., 2018a), which means that emissions
the capability to monitor the long-term trend of atmospheric       from deliberate use of HFC-23 are small. Hence, HFC-23
HFC-23. If this FTIR measurement technique were extended           has mainly been vented from HCFC-22 production plants
to other Network for the Detection of Atmospheric Com-             into the atmosphere (Montzka et al., 2019). Simmonds et al.
position Change (NDACC) ground-based FTIR sites around             (2018a) reported that global annual emissions of HFC-23
world, the measurements reported from these sites would            were estimated to have reached 13.3 ± 0.8 Gg yr−1 in 2006
complement the global AGAGE observations by filling spa-           up from 4.2 ± 0.7 Gg yr−1 in 1980 due to rising produc-
tial and temporal gaps and may lead to improved insights           tion of HCFC-22. After 2006, HFC-23 emissions rapidly de-
about changes in regional and global emissions of HFC-23           creased to 9.6 ± 0.6 Gg yr−1 in 2009 as a result of thermal
and its role in global warming.                                    destruction of HFC-23 incentivized by the Clean Develop-
                                                                   ment Mechanism (CDM) under the Kyoto Protocol to the
                                                                   United Nations Framework Convention on Climate Change
                                                                   (UNFCCC). Due to a scheduled end of the CDM project,
1   Introduction                                                   however, HFC-23 emission again increased, rapidly reach-
                                                                   ing 14.5 ± 0.6 Gg yr−1 in 2014 (Simmonds et al., 2018a).
Trifluoromethane (CHF3 ), also known as hydrofluorocarbon-         The annual global average mole fraction of HFC-23 reached
23 (HFC-23), has an atmospheric lifetime of 228 years              28.9 ppt (parts per trillion) in 2016, which corresponds to a
and a global warming potential integrated over a 100-year          radiative forcing of 5.2 mW m−2 . This is the second-largest
timescale (100-year GWP) of 12 690 (Montzka et al., 2019).         radiative forcing among all HFCs and fluorinated gases
Due to this high GWP, emissions of HFC-23 are contribut-           just after HFC-134a (14.3 mW m−2 ) (Montzka et al., 2019).
ing to climate change. HFC-23 is an unwanted by-product            Miller and Kuijpers (2011) suggested that if no additional
of the production of chlorodifluoromethane (CHClF2 ), also         abatement measures are implemented to reduce HFC-23, its
known as hydrochlorofluorocarbon-22 (HCFC-22), with the            emission will rise to 24 Gg yr−1 in 2035, and the mole frac-
HFC-23 / HCFC-22 production ratio estimated to be up to            tion will rise to 50 ppt, which corresponds to a radiative forc-
4 % (McCulloch and Lindley, 2007).                                 ing of 9 mW m−2 . Furthermore, if emissions of HFC-23 were
   Under the regulations of the Montreal Protocol on Sub-          not regulated and all UNFCCC CDM projects were termi-
stances that Deplete the Ozone Layer (Montreal Proto-              nated, the HFC-23 emission growth rate after 2030 would
col) (UNEP, 2000), production and consumption of ozone-            rise to 0.8 Gg yr−2 , which is 4 times larger than the pre-
destroying chlorofluorocarbons (CFCs) have been com-               vious trend (Miller and Kuijpers, 2011). In 2016, the par-
pletely banned since 2010, whereas production and con-             ties to the Montreal Protocol agreed to amend the Montreal
sumption of hydrochlorofluorocarbons (HCFCs), which have           Protocol to gradually reduce the production and consump-
less of an effect on ozone depletion, have continued. The          tion of HFCs (the 2016 Kigali Amendment) and to control
Montreal Protocol is phasing out the production and con-           emissions of HFC-23. Unfortunately, Stanley et al. (2020)
sumption of HCFCs for emissive uses by 2020 in developed           reported that the global HFC-23 emissions, derived from
countries and by 2030 in developing countries, while use for       atmospheric measurements (top-down estimate), reached
feedstock (e.g., in production of HFCs and fluoropolymers)         15.9 ± 0.9 Gg yr−1 in 2018, which was higher than in any
is not restricted. Hence, emissions of HCFCs to the Earth’s        year in history. Moreover, their results indicated that the top-
atmosphere are expected to continue for quite a while.             down global emission in 2017 was 12.5 ± 0.7 Gg yr−1 higher
HCFC-22, one of the major HCFCs with an ozone deple-               than the inventory-based emission of 2.4 Gg yr−1 (bottom-up
tion potential (ODP) of ∼ 0.03 and a 100-year GWP of 1760          estimate). This result clearly implies that unreported HFC-23
(Harris et al., 2014), has been widely used in air conditioners,   by-product emissions exist. Therefore, the global observation
refrigerators, foaming agents, and heat-insulating materials,      system of atmospheric HCFC-22 and HFC-23 abundances is
and therefore large banks still exist, which also contribute to    important to monitor the efficacy of the phase-down under
ongoing emissions. Emissions of HCFC-22 have increased             the Montreal Protocol and to accurately project the impact
since 2004 (Montzka et al., 2009), and global emissions in

Atmos. Meas. Tech., 14, 5955–5976, 2021                                             https://doi.org/10.5194/amt-14-5955-2021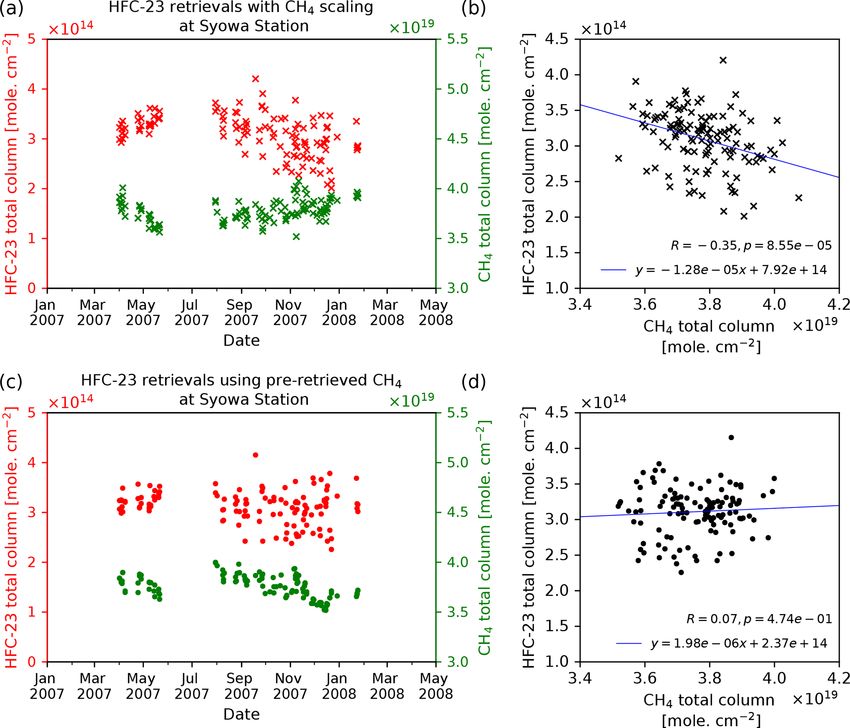
M. Takeda et al.: First ground-based FTIR observations of HFC-23                                                           5957

of emissions of these compounds on ozone depletion and cli-         The Network for the Detection of Atmospheric Composi-
mate change into the future.                                     tion Change – Infrared Working Group (NDACC-IRWG) has
   A ground-based in situ measurement of HCFC-22 with            been globally monitoring abundances of various atmospheric
a gas chromatography–mass spectrometer (GC-MS) tech-             trace gases (e.g., O3 , HCl, HNO3 , CH4 , CO) using ground-
nique was first reported by Rasmussen et al. (1980). The         based Fourier transform infrared (FTIR) spectrometer instru-
Halocarbons and other Atmospheric Trace Species (HATS)           ments (De Mazière et al., 2018). At present, the contribut-
group in the Global Monitoring Division (GMD) of the Earth       ing ground-based FTIR instruments to the NDACC-IRWG
System Research Laboratory at the National Oceanic and           are located at more than 20 sites around the world and have
Atmospheric Administration (NOAA/ESRL) has been ana-             yielded long-term consistent high-quality data by adherence
lyzing atmospheric minor constituents sampled in flasks at       to strict measurement and analysis procedures. For CFCs
several remote sites since 1977, and the measurement of          and HCFCs, for example, atmospheric CFC-11, CFC-12, and
HCFC-22 by the HATS group started in 1992 (Montzka               HCFC-22 have been retrieved from infrared spectra taken by
et al., 1993, 2009). The Advanced Global Atmospheric Gases       ground-based FTIR spectrometers at Reunion Island (Zhou
Experiment (AGAGE) observation network, supported by a           et al., 2016). For HFCs, however, there has been no attempt
consortium of multinational institutions and organizations,      to retrieve their atmospheric abundances. If routine obser-
started HCFC-22 in situ measurements in 1998 using a             vations of atmospheric HFC-23 using the NDACC’s ground-
GC-MS (adsorption–desorption systems (ADSs) since 1998           based FTIR spectrometers were possible, we could fill spatial
and more advanced “Medusa” systems since the mid-2000s)          and temporal gaps in the existing observations by AGAGE
(Simmonds et al., 1995; Prinn et al., 2000; O’Doherty et al.,    and ACE-FTS, which would allow for monitoring of global
2004; Miller et al., 2008).                                      atmospheric HFC-23 abundances in greater detail than ever.
   In contrast, the history of in situ observation of atmo-         This study aims to investigate the retrieval procedure
spheric HFC-23 is relatively short. Atmospheric HFC-23           of atmospheric HFC-23 using the overlapping ν2 and ν5
abundances were first reported in Oram et al. (1998) based on    vibrational–rotational transition bands of HFC-23. We an-
GC-MS measurements of flask background air samples col-          alyze solar infrared spectra observed by two ground-based
lected at Cape Grim, Tasmania, Australia (40.7◦ S, 144.7◦ E),    FTIR spectrometers installed at Rikubetsu, Japan, and Syowa
from 1978 to 1995. But high-frequency in situ measure-           Station, Antarctica. First, the details of the FTIR observa-
ment of HFC-23 by the AGAGE network are only available           tions at both sites are described in Sect. 2. In Sect. 3, the
since the late 2000s using the GC-MS-Medusa at AGAGE             retrieval strategy of HFC-23 for both sites is described in
stations (e.g., Cape Grim; Gosan, Jeju island, South Ko-         detail. Section 4 presents the results and characteristics of
rea – 33.3◦ N, 126.2◦ E) (Miller et al., 2010; Kim et al.,       the HFC-23 retrievals, including the retrieval error budget.
2010; Simmonds et al., 2018a). Also, in situ measurements of     In Sect. 5, the time series of our FTIR-retrieved HFC-23
HFC-23 with AGAGE-compatible (but not identical) instru-         are compared to the in situ measurements from the AGAGE
ments have been made at two stations of the National Insti-      network and the modeled annual global mean dataset based
tute for Environmental Studies (NIES) in Japan: Hateruma,        on the AGAGE measurements. In addition, we discuss the
Okinawa (24.1◦ N, 123.8◦ E; since 2004), and Cape Ochiishi,      HFC-23 trends derived from each dataset. Finally, conclu-
Hokkaido (43.2◦ N,145.5◦ E; since 2006) (Yokouchi et al.,        sions and perspectives are summarized in Sect. 6.
2006; Fang et al., 2015). In total, however, there are only 13
sites with HFC-23 in situ measurements in the AGAGE net-
work, including three affiliated stations.                       2     FTIR observations
   Thanks to the evolution of molecular spectroscopy and
increasing atmospheric concentrations, spaceborne remote         2.1    Rikubetsu
sensing observation of HFCs, in addition to several CFCs
and HCFCs, became possible (Nassar et al., 2006). For            Measurements of atmospheric trace gases at Rikubetsu,
HFC-23, the first spaceborne and balloon-borne remote sens-      Hokkaido, Japan (43.5◦ N, 143.8◦ E), have been carried out
ing observations were done by the Atmospheric Chem-              since May 1995 using two high-spectral-resolution FTIR
istry Experiment-Fourier Transport Spectrometer (ACE-            instruments as part of NDACC-IRWG. The site is located
FTS) on SCISAT and the JPL MkIV interferometer using             200 km east of Sapporo in a small town surrounded by forests
the spectral region (1140–1160 cm−1 ) covering the ν2 and        and pastures. In October 1997, this observatory was relocated
ν5 vibrational–rotational transition bands of HFC-23 (Harri-     to the top of a hill (380 m a.s.l.) near the town. The first in-
son et al., 2012). Fernando et al. (2019) reported the HFC-23    strument, which operated until April 2010, was a Bruker IFS-
trend above cloud top derived from the ACE-FTS measure-          120M FTIR spectrometer. In 2013, a Bruker IFS-120/5HR,
ments for the period of 2004–2017 and indicated that the         an upgrade of the IFS-120HR, was installed as a second
annual HFC-23 mole fractions retrieved from the ACE-FTS          instrument taking over the observations by the IFS-120M,
consistently averaged 5 % smaller than ones at ground level      contributing to the Total Carbon Column Observing Net-
from the AGAGE annual global mean dataset.                       work (TCCON) in addition to NDACC-IRWG. The FTIR

https://doi.org/10.5194/amt-14-5955-2021                                            Atmos. Meas. Tech., 14, 5955–5976, 2021

5958                                                    M. Takeda et al.: First ground-based FTIR observations of HFC-23

instruments at Rikubetsu have been taking solar infrared          but since January 2008 the observations covering this spec-
spectra from 500 to 7500 cm−1 with a KBr beam splitter,           tral region have been separated into two measurements using
the NDACC-recommended optical filters, and two liquid-            the narrower NDACC filter no. 7 (covering 500–1100 cm−1 )
nitrogen-cooled detectors since 1995: indium–antimonide           and no. 8 (covering 1000–1400 cm−1 ). Similar to observa-
(InSb) and mercury–cadmium–telluride (HgCdTe, so-called           tions at Rikubetsu, these measurements were used from 2 to
MCT). Typically, measurements with 2 scans were executed          16 scans with 0.0035 cm−1 resolution. However, we degrade
to acquire a spectrum with a resolution of 0.0035 cm−1 ; how-     the resolution of these spectra to 0.0070 cm−1 (see Sect. 3.3).
ever, sometimes 4 to 16 scans were co-added to improve
signal-to-noise ratios (SNRs). These measurements cover-
ing long periods of time have been used for various studies       3     Retrieval strategy of HFC-23
of atmospheric tracers (e.g., O3 , CO, C2 H6 , and HCN) re-
                                                                  To derive HFC-23 vertical mole fraction profiles and to-
lated to stratospheric composition change and biomass burn-
                                                                  tal column abundances, all spectra taken from the FTIR in-
ing (Nakajima et al., 1997; Zhao et al., 1997; 2002; Koike
                                                                  struments at Rikubetsu and Syowa Station were analyzed
et al., 2006; Nagahama and Suzuki, 2007).
                                                                  with the SFIT4 version 0.9.4.4 program (see https://wiki.
   In this study, we used the spectra measured with the
                                                                  ucar.edu/display/sfit4/, last access: 13 August 2021) based on
NDACC optical filter no. 6 (covering 500–1400 cm−1 ) and
                                                                  the optimal estimation method (OEM) of Rodgers (Rodgers,
an MCT detector under clear-sky conditions since October
                                                                  1976; Rodgers, 2000). This program was developed by sci-
1997. For the observations with the NDACC filter no. 6 by
                                                                  entists from the National Center for Atmospheric Research
the IFS-120/5HR from 2013 to 2018, the SNR values of
                                                                  (NCAR), the University of Bremen, and other institutes tak-
the spectra are unfortunately about 20 % of those achieved
                                                                  ing part in the NDACC-IRWG as an upgraded version of
before the replacement of the instrument in 2013 because
                                                                  the previous SFIT2 algorithm (Pougatchev et al., 1995). This
smaller apertures were used. Since 2019, the more suit-
                                                                  program includes a procedure to calculate the theoretical ab-
able aperture size of 1.7 mm has been adopted for measure-
                                                                  sorption spectrum based on prior information (e.g., meteoro-
ments using the NDACC optical filter no. 6. Hence, those
                                                                  logical profiles, a priori profile of target) and fits the calcu-
observed spectra were additionally used in the retrievals of
                                                                  lated spectrum to the observed one for one or more selected
HFC-23. Also, these spectra are degraded to 0.0070 cm−1
                                                                  spectral regions (micro-windows; MWs). Finally, the pro-
(see Sect. 3.3).
                                                                  gram derives the most suitable state vector (i.e., the retrieved
                                                                  target profile) that balances information obtained from ob-
2.2    Antarctic Syowa Station
                                                                  servations and from the a priori. Hereafter, the details of
                                                                  HFC-23 retrieval are described.
Since the Japanese Antarctic Syowa Station (69.0◦ S,
39.6◦ E; 10 m a.s.l.) was established in 1957, various kinds of   3.1    Retrieval method
scientific observations (e.g., meteorology, upper atmospheric
physics, cryospheric sciences, biology, geology) have been        From the Rodgers OEM, the measured spectrum y can be
conducted. Syowa Station has been maintained by members           written using a forward model F with a vector vertical pro-
of the Japanese Antarctic Research Expedition (JARE). In          file of gas x and all non-retrieved parameters (temperature,
2007, a Bruker IFS-120M FTIR instrument was installed at          pressure, etc.) in vector b as
Syowa Station by NIES and Tohoku University, in coop-
eration with the 48th JARE members. Measurements using            y = F (x, b) + ε,                                            (1)
the FTIR at Syowa Station contributed to research related to
                                                                  where ε is the measurement noise. By taking a Taylor series
stratospheric composition near the edge of the polar vortex
                                                                  expansion around an a priori profile x a and best-estimated
during ozone hole evolution due to its geographical location
                                                                  value b̂ of b, as well as neglecting higher orders, we get the
(Nakajima et al., 2020). As this is a remote site in Antarc-
                                                                  linear expression of Eq. (1) as
tic, it is possible to observe the background atmosphere of
the Southern Hemisphere, which is not influenced by local                          ∂F                 ∂F
human activity.                                                   y = F (x a , b̂) +     (x − x a ) +    (b − b̂) + ε
                                                                                   ∂x                 ∂b
   The instrument has two liquid-nitrogen-cooled detectors
                                                                      = y a + K(x − x a ) + Kb (b − b̂) + ε,                   (2)
(InSb and MCT), which are the same as those in the FTIR
at Rikubetsu. Solar infrared spectra (500–7500 cm−1 ) were        where ya is a spectrum calculated from a priori, and K and Kb
recorded using the same measurement settings as used at           are weighting function matrices, also called the Jacobians,
Rikubetsu under clear-sky conditions in 2007 (and January         for state vector x and model parameter b, respectively. From
2008), 2011, and 2016 but not during polar night periods.         the inversion of Eq. (2), we get the best-estimated vertical
In this study, we used the spectra covering 500–1400 cm−1         profile of the gas mole fraction vector x̂ as
measured with the MCT detector. Note that the observed
spectra in 2007 were measured with the NDACC filter no. 6,        x̂ = x a + GK(x − x a ) + GKb (b − b̂) + Gε,                 (3)

Atmos. Meas. Tech., 14, 5955–5976, 2021                                                https://doi.org/10.5194/amt-14-5955-2021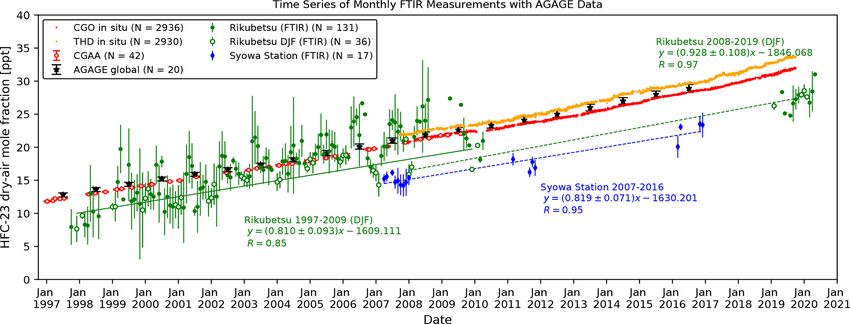
M. Takeda et al.: First ground-based FTIR observations of HFC-23                                                                                   5959

Table 1. Summary of settings used for HFC-23 retrievals.

  Micro-windows                                  MW1                                                    MW2
  Spectral region [cm−1 ]                  1138.50–1148.00                                        1154.00–1160.00
  Profile retrieval                                                          HFC-23, N2 O, O3
  Column retrieval                H2 O, HDO, CFC-12, PAN, HCFC-22                            H2 O, HDO, CFC-12, PAN
  Pre-retrieval                                                              H2 O, HDO, CH4
  Fixed species                                                      CH4 , HCFC-141b, HCFC-142b
  Spectroscopic parameters        PLL (HFC-23, CFC-12, PAN, HCFC-22)                ATM18 (H2 O, HDO)                     HITRAN2008 (others)
  Pressure and temperature                                            NCEP Reanalysis-1, CIRA86
  A priori profiles (HFC-23)           Naik et al. (2000) but scaled to 16 ppt (Rikubetsu) and 24 ppt (Syowa Station) at the surface
  A priori profiles (others)      Mean profiles in the period of 1995–2010 (Rikubetsu) and 2007–2016 (Syowa Station) from WACCM
                                  version 6 (CFC-12, HCFC-22, HCFC-141b, HCFC-142b)
                                  WACCM version 6 mean profiles from 1980 to 2020 (except for the above)
  Signal-to-noise ratio (SNR)                                   Calculated from each observed spectrum
  Background correction                                                      Slope, curvature
  Instrumental line shape (ILS)                                                LINEFIT9/14

                                                                       cost function J derived from Bayes’ theorem and Gaussian
where G = ∂ x̂/∂y is the gain matrix, or contribution func-            statistics:
tion, which represents the sensitivity of the retrieved pa-
rameters to the measurements. Combining a profile x taken              J (x) = (y − Kx)T S−1                     T
                                                                                          ε (y − Kx) + (x − x a ) R(x − x a ), (6)
from an observed spectrum y with an a priori profile as de-
                                                                       where R = S−1 a is a regularization matrix. The second term
scribed in Rodgers (1976) and assuming a linear relationship
                                                                       of Eq. (6) is generally called the constraint, and it is impor-
y = Kx +ε, the best estimation of x̂ is defined as the follow-
                                                                       tant for a stable solution of the state vector x. In the case
ing weighted average:
                                                                       of the Rodgers OEM, the covariance matrix obtained from
                    −1                                             a realistic variability of target gas is used as the regulariza-
              T −1                     T −1
x̂ = S−1
       a + K Sε K          S−1
                            a x a + K Sε Kx                            tion matrix R, but we use Tikhonov regularization (Tikhonov,
  = x a + ŜKT S−1                                                     1963) to set up R in this study. The details about selection of
                ε (y − Kx a ),                                (4)
                                                                       the regularization matrix are described in Sect. 3.5. Finally,
where Sa and Sε are a priori and measurement noise covari-             the cost function is minimized by the Gauss–Newton itera-
ance matrices, respectively, and Ŝ = (S−1     T −1    −1 =            tion method so that the appropriate profile is found by itera-
                                        a + K Sε K)
    T             T −1
Sa K (Sε + KSa K ) Sε K is the covariance matrix of x̂.                tion, which is described as
Comparing Eq. (3), which neglects the error terms of the                                                     −1
                                                                       x i+1 = x a + Sa KTi Sε + Ki Sa KTi

forward model parameters and the measurement noise, with                                                             y − y i + Ki (x i − x a ) ,    (7)
Eq. (4), we get the following matrix, which is the so-called
                                                                       where i = 0, 1, 2,. . . , is the iteration counter, Ki is the Jaco-
averaging kernel matrix A:
                                                                       bian diagnosed at xi , and yi = F (xi ). If this iterative calcula-
              ∂ x̂                                                     tion converges, the best estimate of x̂ results.
A = GK =           = ŜKT S−1
                           ε K,                               (5)
              ∂x
                                                                       3.2    Retrieval micro-windows
which is described in Rodgers (2000) in detail. Each line in
matrix A is called the averaging kernel, which represents the          Table 1 summarizes the strategy for the retrieval of HFC-23
sensitivity of the retrieved value compared to the true value.         in this study. For the retrieval of HFC-23 from FTIR spec-
The sum of diagonal elements of matrix A (trace; tr(A)) is             tra, we used the ν2 and ν5 vibrational–rotational transition
called degrees of freedom for signal (DOFS), which gives               bands of HFC-23 located at ∼ 1150 cm−1 , which is the
the number of pieces of vertical information.                          same spectral region as the retrieval of ACE-FTS (Harri-
   Since the forward model for FTIR observation is usually             son et al., 2012). The infrared absorption by HFC-23 typ-
a nonlinear problem, x̂ is taken by minimizing the following           ically contributes to only about 1 % of the atmospheric

https://doi.org/10.5194/amt-14-5955-2021                                                   Atmos. Meas. Tech., 14, 5955–5976, 2021
5960                                                        M. Takeda et al.: First ground-based FTIR observations of HFC-23

Figure 1. Examples of solar absorption spectra taken from FTIR observations at Syowa Station. The red spectrum was obtained with the
filter no. 6 on 30 September 2007. The green and the blue ones were measured with filter no. 7 and no. 8 on 30 September 2011, respectively.
A positive zero-level offset is clearly seen in the red filter no. 6 spectrum.

transmittance of solar infrared radiation at ground level.              optical characterization of the FTIR instrument, especially
Hence, the choice of MWs is critically important for the                the optical bandpass filter. Since the MWs for HFC-23 re-
retrieval of HFC-23 from ground-based measurements. To                  trieval are rather wide, the slope and curvature (parabola) of
avoid three strong H2 O absorption lines at 1149.47 cm−1 ,              the spectral continuum level over each MW are retrieved in
1151.54 cm−1 , and 1152.44 cm−1 , we used two MWs: MW1                  the SFIT4 program. This correction multiplies the transmis-
at 1138.5–1148.0 cm−1 and MW2 at 1154.0–1160.0 cm−1 .                   sion spectrum B by
Major interfering species in these MWs are O3 , N2 O, CH4 ,
H2 O, HDO, CCl2 F2 (CFC-12), CHClF2 (HCFC-22), and                      B = α(w − w0 )2 + β(w − w0 ) + 1,                               (8)
CH3 C(O)OONO2 (peroxyacetyl nitrate: PAN). Since there
are several strong absorption lines of O3 and N2 O in these             where α is the curvature, β is the slope factor, w is the
MWs, we retrieve profiles of these gases in addition to                 wavenumber vector in the MW, and w0 is the starting
HFC-23. For the other species except for CH4 , we fit to                wavenumber of the MW. As a result, the calculated spectrum
an observed spectrum by scaling the a priori profile (col-              y c can be written as
umn retrieval). In addition, CH3 CCl2 F (HCFC-141b) and
                                                                        y c = B · ψ[τ (w)],                                             (9)
CH3 CClF2 (HCFC-142b) exist as minor interfering gases in
these MWs, but these gases were not retrieved in this study             where τ (w) is a calculated transmission spectrum with ab-
because the contributions of these gases to the transmittance           sorptions by each gas and solar lines (the Fraunhofer lines),
in the MWs are very small. More details are given in the fol-           and ψ[τ (w)] is a transmission spectrum of τ (w) convolved
lowing sections.                                                        with an instrumental line shape (ILS) function.
                                                                           Hydrogen bromide (HBr) gas-cell spectra were taken us-
3.3    Spectral correction and instrumental line shape                  ing a mid-infrared internal light source to check the align-
                                                                        ment of the FTIR instrument and to evaluate the ILS function
As was stated in Sect. 2, absorption spectra, which include             for both the instruments at Rikubetsu and Syowa Station. At
HFC-23 retrieval MWs, were recorded with the NDACC                      Rikubetsu, the first HBr cell spectrum was taken on 26 March
no. 6 and no. 8 optical filters in the MCT channel with                 2002 after the relocation of the instrument in October 1997.
0.0035 cm−1 resolution. In order to reduce the spectral                 In this study, all observed spectra from October 1997 to April
random noise, we degraded the spectral resolution from                  2010 with the IFS-120M instrument were convolved with the
0.0035 cm−1 to 0.0070 cm−1 . Note that the zero level of the            ILS function derived from the HBr cell measurement. For
measured spectra (see Fig. 1) are raised (about +5 % rela-              all spectra observed with the IFS-120/5HR instrument, the
tive to maximum signal intensity) and curved due to the non-            ILS function was accurately defined by the theoretical model
linearity of the MCT detector. Therefore, we corrected this             for the given instrument configuration because the instrument
zero-level offset in the measured spectrum with a second-               had always been maintained with the best optical alignment.
order polynomial fit using well-known absorption-saturated              At Syowa Station, HBr cell spectra were taken from time to
bands sprinkled over the spectral region of 750–1350 cm−1 .             time following installation and re-alignment. Therefore, ILS
   On the other hand, the continuum level, which is equal               corrections were applied for all the spectra. The modulation
to 100 % in transmittance, has a shape that is caused by the            efficiency and phase error of the ILS at Rikubetsu and Syowa

Atmos. Meas. Tech., 14, 5955–5976, 2021                                                    https://doi.org/10.5194/amt-14-5955-2021
M. Takeda et al.: First ground-based FTIR observations of HFC-23                                                          5961

Station were evaluated with the LINEFIT9 and LINEFIT14           HFC-23, β was set to 1.5, the normal value for nonlinear
programs, respectively (Hase et al., 1999).                      molecules. To calculate the vibrational partition function, we
                                                                 assumed a harmonic oscillator approximation and used the
3.4   Spectroscopic parameters                                   fundamental vibrational frequencies and degeneracies from
                                                                 Ceausu-Velcescu et al. (2003). For solar lines, we used the
For the calculation of absorption by each atmospheric            empirical line-by-line parameters in the mid-infrared region
species, the HITRAN 2008 line-by-line spectroscopic              (Hase et al. 2006) in the SFIT4 program package.
database (Rothman et al., 2009) was primarily used.
For spectroscopic parameters of H2 O and its isotopes,           3.5   Information of atmospheric state and
the updated ATM18 line list by co-author G. C. Toon                    regularization matrix
(NASA/JPL) was used (see https://mark4sun.jpl.nasa.gov/
toon/atm18/atm18.html, last access: 8 August 2020). For          We consider 47 atmospheric layers for Rikubetsu and 48 lay-
heavy molecules (such as CFCs, HCFCs, HFCs, and PAN),            ers for Syowa Station from the ground to 120 km in al-
there are no resolved line lists available in HITRAN 2008.       titude. The thickness of the layers increases with altitude.
For our retrieval of CFC-12, HCFC-22, HFC-23, and PAN,           We used Reanalysis-1 daily temperature and pressure data
we used a pseudo-line list (PLL) developed by co-author          obtained from the National Center for Environmental Pre-
G. C. Toon (see https://mark4sun.jpl.nasa.gov/pseudo.html,       diction (NCEP; http://www.ncep.noaa.gov) from the ground
last access: 13 August 2021). In these PLLs, the 296 K line      to 40 km and zonal monthly mean climatological profiles
strength and ground-state energy (E 00 ) for each pseudo-line    from the COSPAR International Reference Atmosphere 1986
were empirically reproduced by fitting transmittance labora-     (CIRA-86) from 40 km to 120 km (Rees et al., 1990). For the
tory spectra (absorption cross sections) acquired under var-     a priori profiles of N2 O, O3 , and PAN, the averaged profiles
ious temperature and pressure conditions. In Harrison et al.     in the period of 1980–2020 derived from the monthly mean
(2012), the PLL of HFC-23 obtained from the cross sections       profile data computed by the Whole Atmospheric Commu-
acquired with a resolution of 0.02 cm−1 , a temperature range    nity Climate Model (WACCM) version 6 (Chang et al., 2008)
of 214–300 K, and a total pressure range of 0.184–253 Torr       were used.
by Chung (2005) was used to analyze solar occultation spec-         For CFC-12, HCFC-22, HCFC-141b, and HCFC-142b,
tra, but there was a large systematic bias of ∼ 30 % in the      the mean profiles for 1995–2010 at Rikubetsu and for 2007–
retrieved profiles. This is mostly caused by the poor quality    2016 at Syowa Station derived from the WACCM monthly
of the cross section dataset used (e.g., inconsistency between   dataset were used because these species in the atmosphere
the spectral absorptions and the temperature–pressure–mole       have dramatically increased since 1980. Note that the mean
fraction conditions). To reduce the systematic uncertainty in    profiles of HCFC-141b and HCFC-142b were used as fixed
the HFC-23 PLL, Harrison (2013) reported new absorption          profiles in the HFC-23 retrieval.
cross section measurements with a resolution of 0.015 cm−1 ,        For HFC-23, WACCM does not provide a profile, and thus
which cover a wider spectral range of 950–1500 cm−1 and          the a priori profile of HFC-23 was based on the global and
more realistic atmospheric conditions in the troposphere and     annual mean mole fraction profile from the two-dimensional
the stratosphere, i.e., a wider temperature range of 188–        chemistry–radiation–transport model by Naik et al. (2000).
294 K and a wider pressure range of 23–762 Torr.                 This a priori profile shows little decrease in HFC-23 mixing
    For the current study, a new HFC-23 PLL was used             ratios above the tropopause, reflecting a very long lifetime
with a wavenumber interval of 0.004 cm−1 over a spec-            (228 years) of HFC-23 in the atmosphere (Montzka et al.,
tral range of 1105–1425 cm−1 (https://mark4sun.jpl.nasa.         2019). For Rikubetsu, the HFC-23 a priori profile was scaled
gov/data/spec/Pseudo/CHF3_PLL_Update.pdf, last access:           to 16 ppt at the ground, which corresponds to the mole frac-
13 August 2021). In addition to the spectra from Chung           tion of HFC-23 in 2002 in the Northern Hemisphere. For
(2005), these pseudo-line parameters were obtained from re-      Syowa Station, the HFC-23 a priori profile was scaled to
fitting Harrison’s 2013 laboratory spectra, three spectra from   24 ppt at the ground, which corresponds to the mole fraction
the Pacific Northwest National Laboratory (PNNL) infrared        of HFC-23 in 2011 in the Southern Hemisphere.
database (Sharpe et al., 2004), and one spectrum from Go-           For H2 O, HDO, and CH4 , a priori profiles were prelimi-
har et al. (2004). Using this new PLL, which is dominated        narily retrieved (pre-retrieved) using other independent MWs
by the Harrison 2013 data, the bias in MkIV balloon mea-         because these profiles may induce large uncertainties in the
surements of HFC-23 is eliminated. In the forward model,         HFC-23 retrieval. The detailed pre-retrieval procedure is de-
the absorption line intensities are calculated by assuming a     scribed in Sect. 3.6.
Boltzmann distribution, which includes the temperature de-          In the retrieval of an atmospheric profile, it is crucial to
pendences of rotational–vibrational partition functions and      select an optimal regularization matrix as a constraint on
induced emission. For the rotational partition function, its     the a priori profile because the regularization matrix affects
temperature dependence is calculated from (296/T )β , where      the vertical resolution and the retrieval error. In the case
T is the temperature and β is the temperature coefficient. For   of the general OEM, the regularization matrix R is the in-

https://doi.org/10.5194/amt-14-5955-2021                                          Atmos. Meas. Tech., 14, 5955–5976, 2021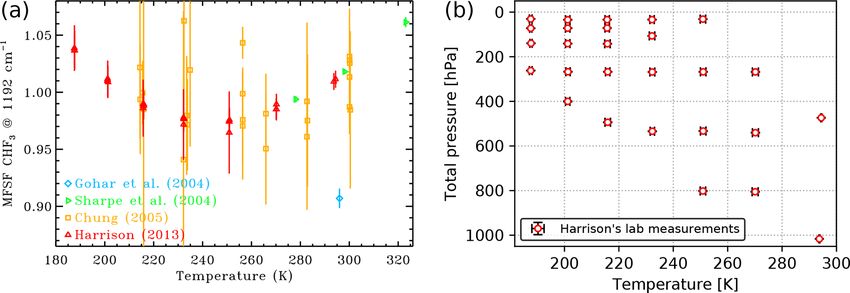
5962 M. Takeda et al.: First ground-based FTIR observations of HFC-23
Table 2. Windows used for the pre-retrievals of H2 O, HDO, and CH4 . Profile-retrieved species are in bold.
Target species Micro-windows [cm−1 ] Interfering species References
H2 O 824.40–825.90 O3 , CO2 , C2 H6 Meier et al. (2004)
HDO 1208.40–1209.10 CH4 , N2 O, H2 O, CO2 , O3 , HNO3 , COF2 Vigouroux et al. (2012)
CH4 1201.820–1202.605 N2 O, H2 O, O3 , HNO3 Meier et al. (2004)
verse of the a priori covariance matrix Sa , which represents noise. It is assumed that Sε is a diagonal matrix, and we put
the natural variability for the target. To calculate Sa , the cli- SNR−2 = (ym − yc )T (ym − yc )/N in the diagonal elements
matological dataset, which is constructed by a large num- of Sε , where ym and yc are the measured and the calcu-
ber of independent profiles, should be used. For O3 , this is lated spectrum, respectively, and N is the number of spectral
available because there are several high-frequency observa- points.
tions (e.g., balloon-borne sondes, satellite measurements). In
many cases, however, it is difficult to calculate realistic nat- 3.6 Pre-retrievals for H2 O, HDO, and CH4
ural variabilities for a priori profiles, and our target gas is
one of them. Therefore, Sa is set up by an ad hoc method.
The vertical gradient and spatial–temporal variability of wa-
In this study, Tikhonov regularization (Tikhonov, 1963) was
ter vapor in the atmosphere are very large. For many ground-
used as in the previous studies of Sussman et al. (2009) for
based FTIR observations, it is impossible to choose the re-
water vapor and Vigouroux et al. (2009) for formaldehyde
trieval MWs without absorption structures of water vapor and
(HCHO). The regularization matrix is defined as R = αLT L,
its isotopes, and thus it is important to use accurate water va-
where α is the strength parameter of the constraint and L is a
por profiles that are coincident with the location and time of
discrete derivative operator. We used the discrete first-order
each observation. Many previous studies (Vigouroux et al.,
derivative operator L1 as L:
2009; 2012; Ortega et al., 2019) used the pre-retrieved H2 O
−1 1 0 ··· 0
(and/or HDO) profiles with dedicated MWs in order to re-
. duce their interference errors. In this study, a priori profiles
0 −1 1 . . . ..
L1 = . (10) of H2 O and HDO were acquired by pre-retrievals using the
.. .. .. .. different MWs shown in Table 2.
. . . . 0
0 · · · 0 −1 1 H2 O profiles were retrieved by using the MW of 824.40–
825.90 cm−1 as suggested in the NDACC IR reference
The operator conserves the vertical shape of the a priori micro-window atlas (Meier et al., 2004) and the monthly pro-
profile and suppresses oscillation of the retrieved profile. We files derived from the WACCM version 6 in the period of
have to properly determine the value of the regularization pa- 1980–2020 as the a priori profile for each spectrum. Since
rameter α, which is tuned to balance the constraint on the a an H2 O absorption line having an E 00 of 586.48 cm−1 is in
priori profile and the residual between the measured and the the MW, we assume that the uncertainties of the retrieved
calculated spectra, the so-called L-curve method (Hansen, H2 O profiles caused by temperature dependence on the line
1992). In this study, we tuned α following the alternative strength are small. The H2 O line is relatively weak and is
method described in Sect. 4.D of Steck (2002). This method hardly ever saturated, even when the humidity at Rikubetsu
can determine the optimal α to minimize the total retrieval er- is high in summer. For HDO, the profile was pre-retrieved us-
ror (the smoothing plus the measurement errors; for details, ing the MW of 1208.40–1209.10 cm−1 , and the pre-retrieved
see Sect. 4.2). In this study, we used α = 100 for all retrievals H2 O profile shape was used as a priori profile shapes for
at Rikubetsu and Syowa Station. HDO and H2 O. This HDO MW was used in the study of
According to Eq. (6), we can understand that the measure- Vigouroux et al. (2012), but our MW is slightly wider than
ment noise covariance matrix Sε is also a key constraint that the previous study because the DOFS for HDO was increased
balances the observations against the regularization matrix. when the wider window was used. We estimated the retrieval
We use the real SNR of the measured spectrum as an in- uncertainties to be approximately 10 % for the pre-retrieved
dicator of the noise level in the first iteration, but the SNR total columns of H2 O and HDO, mainly due to systematic
defined as the inverse of the root mean square (rms) value uncertainties of the spectroscopic parameters based on HI-
of the residuals in the previous spectral fit (referred to as TRAN 2008.
the fitted residuals) is used in the following iterations. The As HFC-23 and CH4 have absorption structures that over-
SNR from the fitted residuals is smaller than the real one lap each other at around 1156 cm−1 , the retrievals of these
since the fitted residuals are caused by various imperfec- species are difficult because they interfere with each other.
tions in forward model parameters (e.g., spectroscopic data, Therefore, we took a strategy of “CH4 pre-retrieval”, in
temperature profile, ILS) in addition to simple measurement which the CH4 amount is determined in another wavelength
Atmos. Meas. Tech., 14, 5955–5976, 2021 https://doi.org/10.5194/amt-14-5955-2021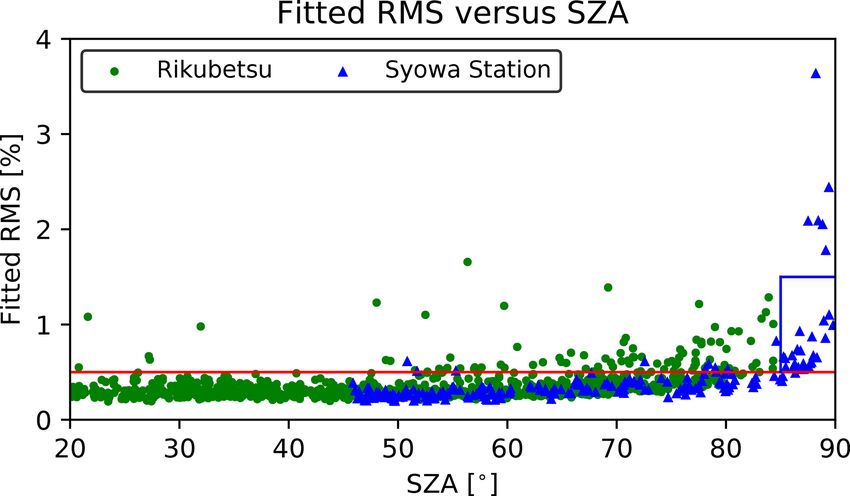
M. Takeda et al.: First ground-based FTIR observations of HFC-23                                                                       5963

Figure 2. Time series of the total columns of HFC-23 and CH4 retrieved from FTIR infrared spectra observed at Syowa Station in 2007 and
January 2008. (a) HFC-23 total columns (red X plots) derived from HFC-23 retrievals accompanied by column retrieval (scaling) of the CH4
profile and the scaled CH4 total columns (green X plots). (b) The correlation between HFC-23 and CH4 of (a). (c) Independent retrieved
CH4 total columns using a spectral region from 1201.820 to 1202.605 cm−1 (green dots) and HFC-23 total columns from retrievals using the
independent retrieved CH4 profiles as fixed profiles (red dots). (d) The correlation between HFC-23 and CH4 of (c). Note that these retrieved
HFC-23 columns were selected by the threshold of the fitted rms value depending on the value of the solar zenith angle (SZA): the thresholds
of the fitted rms are < 0.5 % for SZA < 85◦ and < 1.5 % for SZA of 85◦ or greater.

region, and used the solved CH4 amount as a fixed value for              tribution under a null hypothesis in which there is no correla-
the HFC-23 retrieval. Figure 2 shows the time series of the              tion between these total columns, the anticorrelation between
total columns of HFC-23 and CH4 retrieved from FTIR in-                  HFC-23 and CH4 is statistically significant with a signifi-
frared spectra observed at Syowa Station in 2007 and January             cance level of 5 % (p value < 0.05). Figure 2c shows the time
2008 along with their scatter plot. The HFC-23 total column              series of the independently retrieved CH4 total columns us-
amounts (red X symbols) derived from retrievals of HFC-23                ing a spectral region from 1201.820 to 1202.605 cm−1 from
accompanied by column retrieval (scaling) of the CH4 pro-                Meier et al. (2004) (green dots) and of the HFC-23 total
file and the scaled CH4 total columns (green X symbols)                  columns from retrievals using these independently retrieved
are presented in Fig. 2a. There is an anticorrelation between            CH4 profiles (CH4 -fixed retrievals; red dots). In contrast to
these two time series. Since the typical seasonal cycle of CH4           the scaled CH4 in Fig. 2a, the independently retrieved CH4
shows a minimum in summer due to destruction by the OH                   shows the expected seasonal cycle. As a result, there is no
radical, the seasonal cycle of the scaled CH4 total columns              unrealistic cycle in the HFC-23 total columns derived from
in the retrievals is inconsistent with the expected cycle. Fur-          these CH4 -fixed retrievals. As can be seen in the scatter plot
thermore, a seasonal cycle in the HFC-23 total columns is ob-            of Fig. 2d, there is no correlation between HFC-23 and in-
served, but this is not expected since the atmospheric lifetime          terfering CH4 . Therefore, we decided to pre-retrieve the CH4
of HFC-23 is very long and thus its variability due to atmo-             profile with the independent window before the retrieval of
spheric loss is very small. Figure 2b shows the scatter plot of          HFC-23. For pre-retrieving the profile of CH4 , we used the
the total columns of HFC-23 and CH4 in Fig. 2a. Upon exam-               mean CH4 profile (1980–2020) derived from WACCM and
ination by two-sided hypothesis testing with a Student’s t dis-          the pre-retrieved H2 O profiles mentioned above.

https://doi.org/10.5194/amt-14-5955-2021                                                    Atmos. Meas. Tech., 14, 5955–5976, 2021
5964 M. Takeda et al.: First ground-based FTIR observations of HFC-23
In conclusion, the pre-retrieved profiles of H2 O, HDO, and We conclude that only one piece of vertical information (the
CH4 were used as a priori profiles (H2 O and HDO) and a total column) can be extracted in this study.
fixed profile (CH4 ) in the subsequent retrieval of HFC-23.
4.2 Error analysis
The retrieval error can be considered to be the difference be-
4 Results of HFC-23 retrievals tween the retrieved and the true state vector. Subtracting the
true state vector x from Eq. (3) including the systematic for-
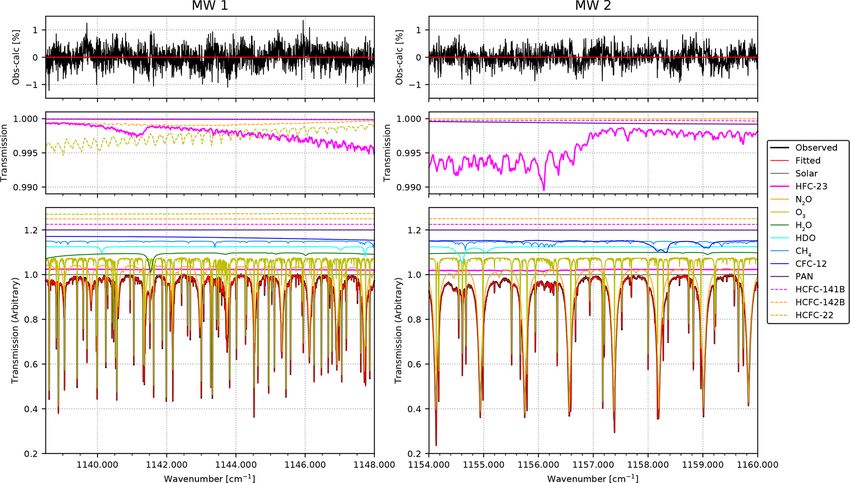
Figure 3 shows an example spectral fitting result for the two ward model error εf , the difference is defined as the following
MWs (MW1 and MW2) for HFC-23. This typical fitting was equation:
for a spectrum observed by the IFS-120M FTIR spectrome-
ter at Syowa Station on 9 November 2011 at 13:47 UTC with x̂ − x = (A − I) (x − xa ) + GKb εb + Gεf + Gε, (11)
a solar zenith angle (SZA) of 67.3◦ . In this case, the absorp-
where I is an identity matrix and εb = b − b̂ is the uncer-
tion contribution of HFC-23 is about 1 % relative to the total
tainty of non-retrieved parameters (Rodgers, 1990; 2000).
transmittance of around 1156 cm−1 , corresponding to a total
The retrieval error consists of four parts: the smoothing error
column of 3.85 × 10¹⁴ molec. cm−2 . The typical root mean
(A − I)(x − xa ), the non-retrieved forward model parameter
square (rms) of the fitted residual (observed minus calculated
error GKb εb , the forward model error Gεf , and the measure-
spectrum) is 0.34 %.
ment noise Gε. The smoothing error is caused by the lack of
A summary of all the HFC-23 retrievals with SFIT4 at
vertical sensitivity combined with uncertainty in xa and in-
Rikubetsu and Syowa Station is shown in Table 3. The re-
cludes the uncertainties from the target gas, interfering gases,
trievals at Rikubetsu are summarized for the periods of 1997–
and any other retrieved parameters (e.g., background correc-
2010 and 2019/20 due to the use of different instruments. The
tion parameters). The forward model parameter error GKb εb
retrievals without negative values in the profile were counted
comes from the uncertainties of the parameters (e.g., profiles
into the number of observations as the “valid” number, and
of temperature and pressure, line lists of target and interfer-
those results were used to calculate each statistic. About 6 %
ing gases, SZA) that are used for the forward model calcu-
of observations at Rikubetsu in 1997–2010 were rejected. On
lation. The forward model error results from the uncertainty
the other hand, almost all of observations at Rikubetsu in
in the forward model itself relative to true physics. In this
2019/20 and at Syowa Station were used. The mean rms of
study, the forward model error was ignored because the phys-
the fitted residuals within 1 standard deviation (1σ ) at Riku-
ical processes (radiation transfer, infrared absorption, etc.) in
betsu is 0.35 ± 0.14 % and 0.27 ± 0.03 % for 1997–2010 and
the SFIT4 algorithm have been well established in previous
2019/20, respectively. The mean rms within 1σ at Syowa
studies.
Station is 0.43 ± 0.38 %. The mean HFC-23 total column
The smoothing random error from target gas profile re-
within 1σ standard deviation at Rikubetsu increased from
trieval is described by the covariance matrix
(3.23 ± 1.10) × 1014 molec. cm−2 in the 1997–2010 period
to (5.59 ± 0.43) × 1014 molec. cm−2 in the 2019/20 period Ss,Tar = (ATar − I)Sa,Tar (ATar − I)T , (12)
due to the increase in atmospheric HFC-23.
In the following sections, we describe the vertical infor- where ATar is a part of the full averaging kernel matrix A
mation and the error estimation of our HFC-23 retrieval. for which the row and column elements run over all tar-
get components, and Sa,Tar is the a priori covariance ma-
4.1 Vertical information trix. In general, Sa,Tar should represent the natural variabil-
ity of the target gas, but we do not know the natural vari-
As mentioned in Sect. 3.1, the vertical information content of ability of the HFC-23 profile well due to the lack of ver-
FTIR retrievals is characterized by the averaging kernel ma- tically resolved measurement data. Therefore, a variability
trix A, defined by Eq. (5). Figure 4 shows typical averaging matrix derived from the AGAGE in situ and sampling mea-
kernels of the HFC-23 retrieval for the same spectrum shown surement dataset was used at each site as a substitute for
in Fig. 3. Each curve colored according to the right color bar Sa,Tar . For Rikubetsu, a variability of 25 % against the a pri-
in Fig. 4 represents the row value of the averaging kernel ori profile (square of 0.25xa ) based on the background air
matrix on the corresponding vertical layer. All the retrievals, sampling data at Cape Grim in the period of 1995–2009
including the typical case in Fig. 4, are sensitive to the tro- (Simmonds et al., 2018b) was adopted as the diagonal ele-
posphere and lower stratosphere, having a sensitivity peak in ments of the variability matrix. For Syowa Station, a vari-
averaging kernel at ∼ 4 km. The full widths at half-maximum ability of 10 % against the a priori profile (square of 0.10xa )
of the averaging kernels are ∼ 20 km, and the mean DOFS computed from the non-polluted data of the AGAGE in situ
for all retrievals at Rikubetsu and Syowa Station is approx- measurements at Cape Grim (https://agage2.eas.gatech.edu/
imately 1.0. Note that we use Tikhonov regularization. The data_archive/agage/gc-ms-medusa/complete/tasmania/, last
DOFS is around 1.0 even if we apply OEM for the retrieval. access: 12 August 2020) was adopted as the diagonal ele-
Atmos. Meas. Tech., 14, 5955–5976, 2021 https://doi.org/10.5194/amt-14-5955-2021M. Takeda et al.: First ground-based FTIR observations of HFC-23 5965
Figure 3. Typical spectral simulation results of the two HFC-23 retrieval micro-windows (left panel: MW1; right panel: MW2) fitted to the
observed spectrum at Syowa Station on 9 November 2011 at 13:47 UTC. The top two panels show the residuals (observed minus calculated)
of the fittings for MW1 and MW2. The middle two panels show the absorption contributions of HFC-23, PAN, HCFC-141b, HCFC-142b, and
HCFC-22 in MW1 and MW2. The bottom two panels show the individual contributions from each interfering species, shifted by multiples
of 0.025 for clarity, except the observed and the calculated lines.
Table 3. Statistical summary of the fitted SNRs, the root mean square (rms) of the fitted residuals (observed minus calculated spectrum), the
degrees of freedom for signal (DOFS), and the retrieved HFC-23 total columns at Rikubetsu and Syowa Station. The errors of the fitted rms,
the DOFS, and the total columns are 1 standard deviation (1σ ) around the averages. The numbers of HFC-23 retrievals (N) are divided into
two parts: the number of retrievals used in this analysis (valid) and the total ones including those rejected (total).
Site (instrument) Period N Mean fitted SNR Mean Mean Mean HFC-23
(valid / total) (MW1 / MW2) fitted rms DOFS total column
[%] [1014 molec. cm−2 ]
Rikubetsu (IFS-120M) 1997–2010 1081 / 1152 293 / 371 0.35 ± 0.14 1.0 ± 0.02 3.23 ± 1.10
Rikubetsu (IFS-120/5HR) 2019/20 30 / 30 350 / 414 0.27 ± 0.03 1.0 ± 0.01 5.59 ± 0.43
Syowa Station (IFS-120M) 2007–2016 206 / 207 294 / 308 0.43 ± 0.38 1.0 ± 0.03 3.69 ± 1.35
ments of the variability matrix. Note that the systematic un- where ATar,Int is a part of the full averaging kernel matrix A
certainty for the smoothing error was not considered because for which the row elements run over all target components
we assumed that the shape of the HFC-23 a priori profile and the column elements run over all interfering species;
does not have a large altitudinal gradient, as mentioned in ATar,Oth is a part of the A matrix for which the row and col-
Sect. 3.1.5. The smoothing random errors for the retrieval umn elements run over all target and other parameter com-
uncertainties from all interfering species and some other re- ponents, respectively; and xtInt , xaInt , xtOth , and xaOth are the
trieval parameters (background slope and curvature correc- true and a priori state vectors of interfering species and other
tion, wavenumber shift, solar line shift, solar line strength, parameters. To estimate the retrieval errors from the inter-
and simple phase correction) can be written as fering gases, the variabilities around the a priori profiles for
H2 O (HDO) were set to 10 %, and the uncertainties for other
εret = ATar,Int xtInt − xaInt + ATar,Oth xtOth − xaOth ,
(13)
https://doi.org/10.5194/amt-14-5955-2021 Atmos. Meas. Tech., 14, 5955–5976, 20215966 M. Takeda et al.: First ground-based FTIR observations of HFC-23
nasa.gov/data/spec/Pseudo/CHF3_PLL_Update.pdf, last ac-
cess: 13 August 2021). For heavy molecules like HFC-23,
ground-state energy E 00 values, which are relevant to the tem-
perature dependency of Sν , are empirically given so that their
uncertainties are larger than for light molecules (e.g., H2 O,
O3 ). In addition, the E 00 uncertainty has a larger effect on
Sν at a cold site like Syowa Station. We assumed an error of
50 cm−1 for the E 00 values of the HFC-23 PLL and estimated
uncertainties of 10 % and 15 % at Rikubetsu and Syowa Sta-
tion, respectively, as the effect of the E 00 error on Sν . For
N2 O, O3 , H2 O, and HDO, the spectroscopic uncertainties
were derived from the HITRAN 2008 database. The uncer-
tainties for N2 O and O3 were set to 5 %, 10 %, and 5 % for
Sν , γair , and nair , respectively. For H2 O and HDO, we as-
signed an uncertainty of 10 % to each parameter.
The measurement error was calculated from the error co-
variance matrix Sn defined as
Sn = GSε GT , (15)
where Sε is the measurement noise covariance matrix. We
adopted the square inverse of the SNR from the fitted resid-
uals of the last iteration for the diagonal elements of Sε , as
mentioned in Sect. 3.5.
Furthermore, we estimated the impact of the interfering
Figure 4. Typical averaging kernels of the HFC-23 retrieval for the CH4 on the HFC-23 retrievals as the retrieved HFC-23 to-
same spectrum shown in Fig. 3, which are normalized using the a tal column is affected by the retrieval uncertainty of the pre-
priori profile. Note that the vertical scale is from the surface up to fitted CH4 profile. The uncertainties of the pre-retrieved CH4
60 km because there is almost no sensitivity above 60 km. total columns are dominated by the systematic uncertain-
ties of its spectroscopic parameters. Considering the spectro-
scopic parameter uncertainty provided by the HITRAN2008
species were set to the values calculated from the appropriate database, the mean uncertainties of Sν , γair , and nair in the
WACCM datasets. pre-retrieved CH4 total columns were approximately 5 %,
In order to estimate the non-retrieved forward model pa- 4 %, and 1 %, respectively, at both sites. Since the MW for
rameter error, the covariance matrix Sf is calculated as CH4 pre-retrieval is close to the HFC-23 MWs, these spec-
troscopic uncertainties in CH4 are partly canceled between
Sf = (GKb ) Sb (GKb )T , (14)
the two MWs. Therefore, we assumed that the uncertain-
where Sb is the model parameter covariance matrix, which ties of Sν , γair , and nair for CH4 are 3 %, 3 %, and 1 %, re-
is derived from the uncertainties in the model parameters. spectively, in the HFC-23 MWs. The effects of the CH4 sys-
For the random and systematic uncertainties of temperatures tematic uncertainties on the retrieved HFC-23 total column
at Rikubetsu and Syowa Station, the uncertainties reported were calculated from Eq. (14) using these uncertainties. On
from the NCEP temperature profiles were assumed. The un- the other hand, the effect of the CH4 random uncertainty
certainty of temperature at Rikubetsu is about 2 K in the tro- on the retrieved HFC-23 was derived from the 1σ variabil-
posphere, 2–10 K between the tropopause and 60 km, and ity in the pre-retrieved CH4 total columns. The 1σ standard
10 K above 60 km. The uncertainty of temperature at Syowa deviations at Rikubetsu and Syowa Station were 4 % and
Station is about 2.5 K in the altitude range from the sur- 3 %, respectively. To quantity this uncertainty, we tested the
face to 20 km, 2.5–10 K between 20 and 60 km, and 10 K HFC-23 retrievals by scaling the pre-retrieved CH4 profiles
above 60 km. The SZA random uncertainty was assumed by ± 4 % and ± 3 % at Rikubetsu and Syowa Station, respec-
to be 0.15◦ considering measurement time. For HFC-23, tively. Then we calculated the percent difference between the
N2 O, O3 , H2 O, and HDO, the uncertainties of the spectro- HFC-23 total column retrieved with the scaled CH4 profile
scopic parameters (i.e., line intensity, Sν ; air-broadening co- (“scaled CH4 ”) and the ones retrieved with the non-scaled
efficient, γair ; coefficient of temperature dependence for γair , CH4 profile (“normal”). The percent difference D is defined
nair ) were also estimated. The uncertainties of Sν , γair , and as
nair of HFC-23 were set to 10 %, 15 %, and 15 %, respec- TCHFC−23,scaled CH4 − TCHFC−23,normal
tively, based on the PLL database (see https://mark4sun.jpl. D [%] = · 100, (16)
(TCHFC−23,scaled CH4 + TCHFC−23,normal )/2
Atmos. Meas. Tech., 14, 5955–5976, 2021 https://doi.org/10.5194/amt-14-5955-2021You can also read