Flood Resilience and NC Water and Wastewater Utilities - A case study approach to understanding utility vulnerability and resilience
←
→
Page content transcription
If your browser does not render page correctly, please read the page content below

Flood Resilience and NC Water and
        Wastewater Utilities
     A case study approach to understanding
          utility vulnerability and resilience

           Prepared for the NC Policy Collaboratory

     The Environmental Finance Center at UNC-Chapel Hill

                          June 2021
About the Environmental Finance Center
The Environmental Finance Center at the University of North Carolina at Chapel Hill is
part of a network of university-based centers that work on environmental issues,
including water resources, solid waste management, energy, and land conservation. The
EFC at UNC partners with organizations across the United States to assist communities,
provide training and policy analysis services, and disseminate tools and research on a
variety of environmental fiance and policy topics.

The Environmental Finance Center at the University of North Carolina at Chapel Hill is
dedicated to enhancing the ability of governments to provide environmental programs
and services in fair, effective, and financially sustainable ways.

Acknowledgments
Written by Austin Thompson, Elsemarie Mullins, Radhika Kattula, and Amy Vaughn.
Design by Angelina Katsanis.
Editorial assistance provided by Erin Riggs.

This report is a product of the Environmental Finance Center at the University of North
Carolina at Chapel Hill. Findings, interpretations, and conclusions included in this report
are those of the authors and do not necessarily reflect the views of the EFC at UNC
funders, the University of North Carolina, the School of Government, or those who
provided review.

The EFC is grateful to the North Carolina Policy Collaboratory for funding this research.

                         © 2021 Environmental Finance Center
                    at the University of North Carolina, Chapel Hill
                                 School of Government
                          Knapp-Sanders Building, CB# 3330
                       University of North Carolina at Chapel Hill
                             Chapel Hill, NC 27599-3330
                                  http://efc.sog.unc.edu

                                           1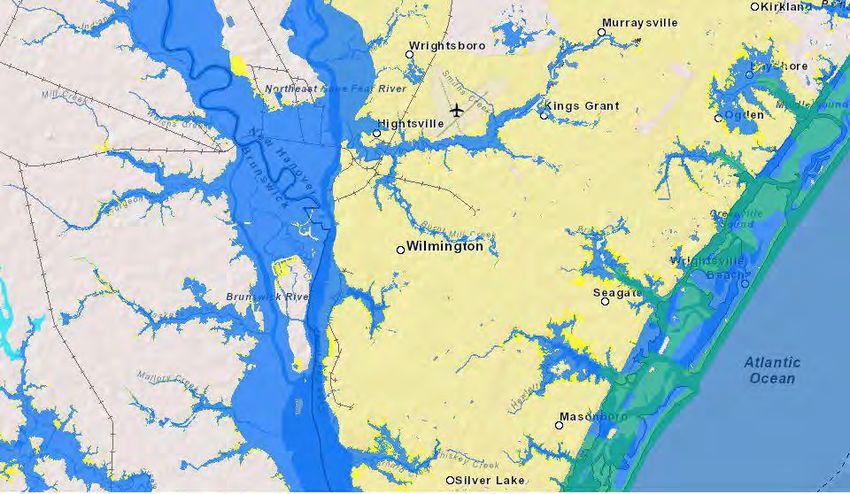
Table of Contents
Executive Summary.......................................................................................................................................3
   Wastewater Infrastructure Tends to be Most Vulnerable ..........................................................................3
   Vulnerabilities are real, but the impacts can be buffered by reliable staff ................................................3
   Recovery Funding is not reliable...............................................................................................................3
   Fund balances connect the dots .................................................................................................................4
   Resilience Planning is not clearly defined.................................................................................................4
Introduction & Background: Research questions addressed .........................................................................5
   Past Storms ................................................................................................................................................5
   Legislative Call to Action..........................................................................................................................5
   Impact on infrastructure & importance of resilience within utilities.........................................................6
Research Methodology................................................................................................................................. 7
   Floodplain Mapping ..................................................................................................................................7
   Case Studies ..............................................................................................................................................8
   Financial Analyses.....................................................................................................................................9
   Inventorying RebuildNC Plans, HMAP Spending, and Storm Damages................................................10
   Funding/Financing Research ...................................................................................................................10
Results/Findings ..........................................................................................................................................11
   Mapping and Vulnerable Infrastructure ..................................................................................................11
   Challenges with Utility Resiliency ..........................................................................................................12
   Storm Damages & Unpredictability of Storms........................................................................................13
   Working with FEMA...............................................................................................................................13
   Resilience Planning .................................................................................................................................14
   Raising Rates and Competing Needs.......................................................................................................14
   Funding for Resilience ............................................................................................................................15
Looking Forward: Funding and Financing Options ....................................................................................16
   Rhode Island Municipal Resiliency Program (MRP) ..............................................................................16
   Massachusetts Municipal Vulnerability Preparedness (MVP) Program .................................................16
   FEMA Building Resilient Infrastructure and Communities (BRIC) Program ........................................ 17
   Recommendations for NC Resilient Communities Program...................................................................18
   Other Innovations: Financing ..................................................................................................................18
Policy Recommendations ............................................................................................................................19
Appendix A: Case Studies...........................................................................................................................
Appendix B: Funding Table ........................................................................................................................
Appendix C: Innovative Financing Tables and Information.......................................................................
Appendix D: Research Team Members …………………………………………………………………
                                        2
Executive Summary
Between October 2019 and June 2021, the Environmental Finance Center at UNC Chapel Hill (EFC), along with
other research groups across North Carolina, conducted research on flood resilience in Eastern North Carolina. In
2019, the North Carolina General Assembly set aside $2 million dollars to the NC Policy Collaboratory to study
flood resilience, under Senate Bill 429. The research focused specifically on the Lumber, Neuse, and Cape Fear
river basins, as they represented the hardest hit areas from Hurricane Florence in 2018. The EFC was charged with
investigating water and wastewater utility flood resilience, and the research utilized a mixed methods approach,
including mapping vulnerable infrastructure, assessing financial condition via benchmarks, investigating recovery
spending, a focus group style group discussion at a School of Government workshop, and conducting qualitative
interviews and case studies at four utilities across the three river basins. Based on this research, the key takeaways
are as follows:

Wastewater Infrastructure Tends to be Most Vulnerable
Of the communities interviewed, most cited wastewater impacts as a result of Matthew and/or Florence. And it
makes sense, as stated previously, wastewater infrastructure tends to be built at the lowest point in town, making it
ripe for flooding impacts. The infrastructure is often built in the floodplain to utilize gravity and reduce pumping,
and given the cost of a new Wastewater Treatment Plant, moving is not a quick or easy solution. The most common
wastewater treatment failure cited was an overflow at the treatment plant and the disposal of untreated waste into
waterways. While the public health impacts are slightly further removed than the loss of drinking water service, the
environmental and downstream impacts still necessitate a better understanding of how to resolve these challenges
going forward.

Policy Recommendation: The State should consider water holistically, thinking about the connectedness of water
resources when making legislative changes related to flood resilience. (Priority: High, Timing: Long term)

Vulnerabilities are real, but the impacts can be buffered by reliable staff
All communities explained at least one serious issue as a result of Florence and/or Matthew. In some cases, the
issue was isolated and in others it was system-wide. Regardless of the scope of the issue, all respondents cited the
hard work of their staff as a reason the issue was not worse or was resolved quickly. In some cases, staff braved
hurricane conditions to curb the issue and in other cases staff worked around the clock. Water and wastewater
infrastructure is largely hidden from the greater community and workforce development is a growing challenge in
the field. Going forward, utilities should continue to invest in their staff and showcase the staff’s hard work to the
public--perhaps without showcasing the system vulnerabilities.

Policy Recommendation: The State should work to improve workforce development within the water and
wastewater sector, especially as the current workforce ages and the new workforce dwindles in size. (Priority:
Medium, Timing: Long-term)

Recovery Funding is not reliable
Despite heavy reliance on FEMA funding, most respondents cited great challenges with attaining that funding.
Respondents cited heavy turnover within FEMA, lack of communication, and years long waiting times for funding
as reasons for concern. Indeed, one utility noted that their auditor stated they could no longer put FEMA money on

                                                         3
their accounts receivable, as it had been too long. This will have a negative impact on their financial indicators and
likely raise red flags at the Local Government Commission. While utilities cited that they do believe the money will
come, FEMA is no longer a quick lifeline. Grant funders like the Golden Leaf Foundation were considered much
more efficient partners, likely signaling a need for change in the FEMA system.

Policy Recommendation: The State should consider launching a bridge funding/financing program that allows
utilities to borrow money to repair/replace critical infrastructure while waiting for FEMA money. (Priority: High,
Timing: Short-term)

Fund balances connect the dots
Fund balances in North Carolina have been growing. Since the NC Division of Water Infrastructure began to require
a larger fund balance to attain their funding or financing, utilities have been putting aside more cash for a rainy day.
This has proved fruitful in the wake of large storms. Many utilities cited paying for repairs with the fund balance,
in hopes of being reimbursed by FEMA. Given the uncertainty around timing of FEMA money, fund balances have
been a lifeline for utilities, even if it means deferring other capital improvements to make ends meet in the short-
term. Going forward, fund balances will continue to be a vital part of financial resilience and should continue to be
utilized. Indeed, reserves will continue to be important as utilities approach hurricane season, as damages may be
costly and revenue shocks could be significant.

Policy Recommendation: The LGC and NC DWI should continue putting an emphasis on building fund balances.
(Priority: Medium, Timing: Long-term)

Resilience Planning is not clearly defined
North Carolina lacks clear guidance on how to be resilient. Other groups, like US EPA and the State of California,
have provided lengthy documents on utility resilience, but some parts are fuzzy. The US EPA flood resilience
guidance is a workshop style, including asset criticality exercises and videos of a small utility in Maine that invested
in resilience. But the workshop lacks the follow-up or technical assistance required to see the implementation of
resilience through. Indeed, attendees at the School of Government workshop nearly all cited different definitions of
resilience and resilience planning, most due in part to a.) attaining FEMA funding, or b.) prior experience during
storms. Going forward, North Carolina should consider providing water and wastewater utility specific guidance
on resilience; both physical and financial.

Policy Recommendation: The State should work to operationalize “resilience” planning for water and wastewater
utilities, providing a clear definition and actionable steps for utilities to become more resilient. (Priority: High,
Timing: Medium-term)

                                                          4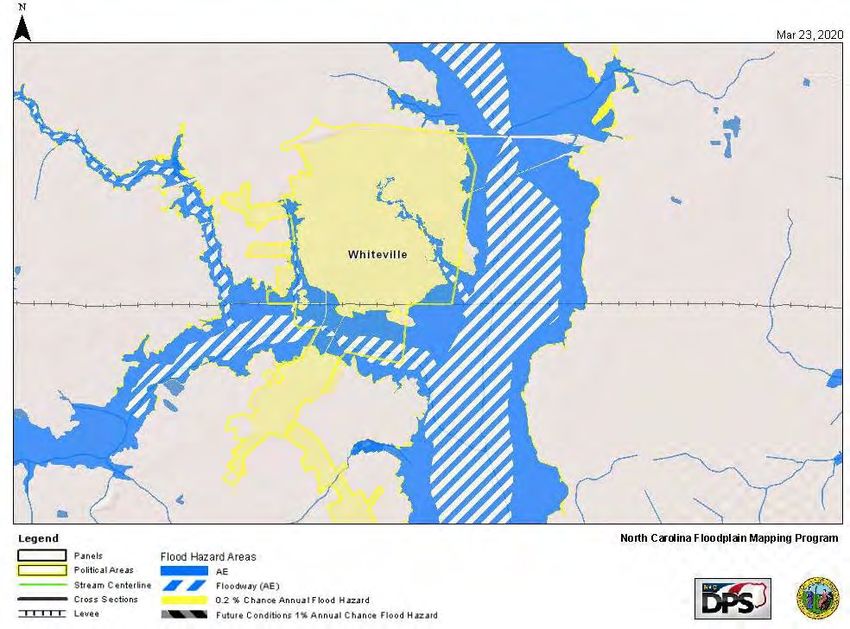
Introduction & Background
Past Storms
Between 2016 and 2019, three major hurricanes struck the North Carolina coast: Matthew (2016), Florence (2018)
and Dorian (2019). Hurricanes Matthew and Florence deposited an unprecedented amount of rain on the coast of
North Carolina. In general, Matthew’s rainfall was greater than Florence, but Florence hit when river levels were
already high. In areas closer to the piedmont, the flood waters receded relatively quickly, but in the low-lying eastern
portion of the state, the rivers rose and, in some cases, took weeks to recede below flood stage. For many of these
communities, flooding is not a foreign concept, but rarely leaves the amount of damage associated with these two
storms.

A report on Hurricane Matthew, produced by NOAA, states that the storm produced in excess of 10 inches of rain
across a large region--including northern SC, NC, and southern Virginia. The heaviest rainfall was reported in
Columbus County, NC, where the storm was met with other meteorological patterns and produced over 18 inches
of rain over two days. In North Carolina, 25 deaths resulted from the storm, nearly all associated with flooding and
vehicular travel. The town of Fair Bluff, NC had nearly 85% of the town inundated with water at some point after
the storm, and the town of Lumberton, NC had nearly 1500 residents displaced after an apparent levy break. In
total, it is estimated that Hurricane Matthew caused $1.5 billion in property damage to nearly 100,000 buildings in
NC.

According to NOAA and data from USGS storm gauges, rainfall from Hurricane Florence ranged from anywhere
between 10 inches to 35 inches along the border of NC and SC, with the highest rainfall (35.93 inches) in
Elizabethtown, NC. The slow movement of the storm both before and after landfall allowed rainbands to continue
to move inland from the warm Atlantic, causing significant freshwater flooding. According to USGS data, 22 stream
gauges in NC measured record peak stages as a result of Hurricane Florence. Florence resulted in 15 direct fatalities,
14 of which were due to freshwater flooding. Significant flooding caused major agricultural losses, both field crop
and animal (chickens, hogs). In NC, Florence caused $22 Billion in damages. The state estimated approximately
$88 million in water/wastewater/stormwater need as a direct result of Hurricane Florence, and an additional $25
million in resiliency needs across water, wastewater, stormwater and electrical/gas utilities.

These two storms, while the most damaging of all within the scope of this research, are merely precursors to future
storms without action. As development across the coastal plain continues, stream flooding will continue to worsen,
creating additional hazards to property, human life, and infrastructure.

Legislative Call to Action
Recognizing the need for a shift from recovery, a reactive state, to resiliency, a proactive state, the NC legislature
secured $2 Million in disaster recovery funds to the NC Policy Collaboratory to study flood resiliency in the Neuse,
Cape Fear, and Lumber River basins. As part of this study, the vulnerability of critical infrastructure, including
water and wastewater infrastructure, was assessed. This vulnerability assessment was three fold, including mapping
critical infrastructure, assessing utility finances, and conducting semi-structured interviews to determine past
damages and future resilience measures.

                                                          5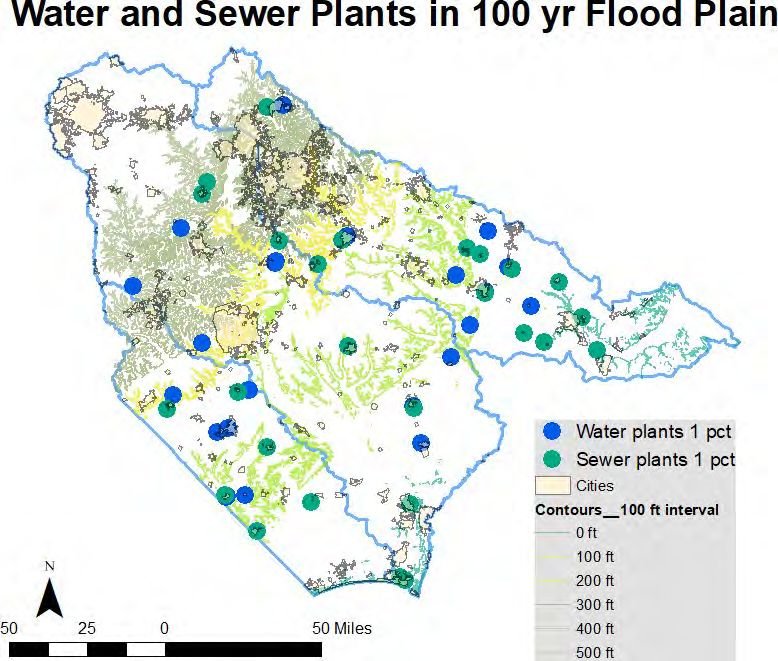
The impetus on resilience water and wastewater infrastructure is not unique to North Carolina. Indeed, the
Environmental Finance Advisory Board (EFAB) advised US EPA on flood resilience in 2019, US EPA has launched
an all-day flood resilience training for water and wastewater utilities, and several states (California, Massachusetts,
Rhode Island, etc.) have launched state specific guidance and funding for flood resilience.

Impact on infrastructure & importance of resilience within utilities
In low-lying eastern portions of the state of North Carolina, the height above sea level can vary on the order of a
few feet. By nature, sewer infrastructure tends to be placed in the lowest lying areas of town. Additionally, both
water and sewer rely on an intake and outfall, often from and into larger water bodies. Combined with floods, this
puts numerous aspects of critical infrastructure within an area that is susceptible to rising waters.

This is not unlike other regions of the United States. Take New Orleans, for example. After Hurricane Katrina hit
in late August, 2005, both of New Orleans’ wastewater treatment plants were damaged. The smaller plant was back
online in September, but the larger plant was not functioning until November 2005, and was suffering from regular
problems nearly a year later. The damage to wastewater treatment facilities in New Orleans alone was estimated at
approximately $1.2 billion.

As infrastructure is assessed and vulnerabilities are determined, utilities often aim to raise pump stations, armor or
“harden” assets, make critical infrastructure submersible, and ensure adequate redundancies in the system. All of
these actions can protect a water or sewer utility from rising flood waters, but all of them come at a cost. Often,
these costs are competing with basic water and sewer infrastructure needs, absent the additional challenge of large
storms and rising floodwaters.

Financially, utilities can also be vulnerable to large flood events. In cases where homes or businesses are damaged,
floods can equate to large losses in service population for months. Additionally, when infrastructure is damaged,
FEMA funds are often months, if not years away from being awarded. In these cases, utilities are often required to
use cash on hand, or the “fund balance” to repair and replace what is required to restore service.

In New Orleans, preliminary reports cited the challenges with flight from the area post-Katrina, and what that may
mean for utility revenues and long-term financial sustainability. Indeed, according to the US Census Bureau, the
population of New Orleans (not the service population) dropped from 454,000 in 2005 to 208,000 in 2006. As of
2018, the population has rebounded to 391,000, but has leveled off and may be decreasing. This example fails as it
connects to Eastern North Carolina. New Orleans is a large city, already experiencing economies of scale as it
pertains to water and wastewater service. Much of eastern NC is small, and many utilities are already suffering with
small service populations and tight budgets.

With this in mind, the research aims to assess water and/or wastewater resilience in Eastern North Carolina. First,
infrastructure and floodplains were mapped to determine vulnerable infrastructure. Then, four case studies were
conducted with utilities of various sizes and with ranging impacts from Hurricanes Matthew and Florence to better
understand the damage done, the recovery process, and steps towards future resilience. These case studies are paired
with an assessment of recovery spending after Matthew and Florence and a review of innovative funding options
for utility resilience. The methods are described in more detail below.

                                                         6
Methodology
Floodplain Mapping

To assess vulnerability of utilities in the Lumber, Cape Fear, and Neuse river basins, key infrastructure (water and
wastewater treatment plants, water and wastewater distribution pumps, and wastewater pipes) was compared to
flood plain maps for those areas1. The flood maps display a 1 percent chance of flooding (100 year flood plain A
designation on flood map) and a 0.2 % chance of flooding (500 year flood plain: B,C designation). The infrastructure
was clipped to the basins, and the intersection of infrastructure points and flood maps features were found.

We found that nearly ⅓ of sewer treatment plants and 23% of sewer pumps are in the 100 year flood plain (See
tables below). Although sewer treatment plants and sewer pumps tend to be in low-lying areas because pipes run to
the lowest point to gather wastewater, the fact that one of every three sewer treatment plants is at risk of flooding
relatively frequently highlights the widespread vulnerability of these types of infrastructure in the Cape Fear,
Lumber, and Neuse River basins.

It’s important to note that this analysis does not take into account any modifications a system has made to elevate
pumps or treatment facilities--it is just the elevation of the land at which the piece of infrastructure is located.

    Type of Infrastructure     Total                   Number in 1 pct zone       Number in 0.2 pct zone

    Water treatment plants     411                     28                         5

    Sewer treatment plants     86                      26                         3

    Water distribution pumps   85                      10                         3

    Sewer distribution pumps   819                     187                        27

    Sewer pipes                29312                   4233                       2433

    Sewer pipes length         5604931                 1408981                    955231

1
  Data was obtained from NC One Map: https://www.nconemap.gov/. Water plants (1997):
https://www.nconemap.gov/datasets/water-distribution-treatment-plants-1997?geometry=-85.382%2C33.573%2C-
73.935%2C36.716
Sewer treatment plants (1997): https://www.nconemap.gov/datasets/sewer-treatment-plants-1997?geometry=-
85.527%2C33.581%2C-74.079%2C36.724
Water distribution pumps (1997): https://www.nconemap.gov/datasets/water-distribution-pumps-1997?geometry=-
85.417%2C33.554%2C-73.969%2C36.698
Sewer pumps (1997): https://www.nconemap.gov/datasets/sewer-pumps-1997?geometry=-85.513%2C33.552%2C-
74.065%2C36.696
Type A Current Public Water systems (2004):
https://www.nconemap.gov/datasets/type-a-current-public-water-systems-2004?geometry=-85.449%2C33.568%2C-
74.001%2C36.711
NCDOT City Boundaries: https://www.nconemap.gov/datasets/type-a-current-public-water-systems-2004?geometry=-
85.449%2C33.568%2C-74.001%2C36.711

                                                         7
Type of Infrastructure      Percentage in 1 pct zone       Percentage in 0.2 pct zone Total Percentage at risk for
                                                                                         flooding in 500 year flood

 Water treatment plants        6.8%                           1.2%                        9%

 Sewer treatment plants        30.2%                          3.5%                        33.7%

 Water distribution pumps      11.8%                          3.5%                        15.3%

 Sewer distribution pumps      22.8%                          3.3%                        26.1%

 Sewer pipes                   14.4%                          8.3%                        22.7%

 Sewer pipes length            25.1%                          17.0%                       32.1%

Case Studies
To supplement the quantitative data produced through GIS, four case studies were conducted of local government
utilities that suffered damages from Hurricanes Matthew and Florence. These case studies included questions related
to the damages incurred and any loss of service, details on the new infrastructure, challenges with funding/financing
after a natural disaster, and any changes the utility has made to be more resilient.

Nine utilities were identified; three within each river basin of interest. These utilities were identified as ranging in
service population, with a small, medium, and large utilities identified in each basin. The nine utilities included
Whiteville, Laurinburg, Fayetteville, Cape Fear Public Utilities Authority (CFPUA), New Bern, Kinston,
Lumberton, Concord, and Raleigh. Of these, seven were contacted. Given the distance from the coastal plain,
Raleigh and Concord were not contacted. Four utilities responded.

Interviews were conducted with CFPUA, Whiteville, Laurinburg, and New Bern, resulting in four complete case
studies. Given the range of service population, and financial, technical, and managerial capacity, as well as the
proportion of the utility in the floodway, the interviews provided very different perspectives on utility damages and
future resilience. The interview questions can be found in Appendix A.

                                                          8
Figure 1 Location of studied river basins in North Carolina

Finally, to further build the body of qualitative research, a series of open-ended questions were asked during a
presentation at the UNC-Chapel Hill School of Government’s Annual Water and Wastewater Finance workshop in
February 2020. These questions were intended to gauge what utilities are planning for (i.e., 100-year flood, 500-
year flood) and why that threshold was chosen.

Financial Analyses
Perhaps the most overwhelming takeaway from the qualitative feedback was the lack of financial support following
large storms. Two of the four respondents mentioned waiting years for FEMA money to come in, effectively relying
on the utilities fund balance to buffer the costs of emergency replacements in the wake of the storm.

Given these takeaways, an in-depth financial analysis was completed for all nine utilities, looking at their
water/wastewater rates and finances, as available from the NC Water and Wastewater Rates Dashboard, over the
last five years. The results for the four completed case studies were added to the case study results. Finally, during
the tenure of this research, the EFC also created a Financial Resilience Dashboard to assess impacts of COVID-19.
Given the impacts of major floods on fund balances, the tool is also relevant to utilities affected by natural disasters.

                                                              9
Inventorying Rebuild NC Plans, HMAP Spending, and Storm Damages
After Hurricane Matthew, Rebuild NC plans were developed for all counties affected by the storms. These plans
outlined the county-wide need to be more resilient for future storms and was funded by the state. These plans were
examined, and all water/wastewater/stormwater projects were recorded. Each entry included a single project, the
county, the name of the project, the cost of the project (ordinal), and the entity responsible for completing the
project. This process was envisioned to outline the “need” for utility resiliency efforts in the eastern portion of the
state.
Similarly, FEMA data was downloaded to assess HMAP spending in NC. HMAP is intended to be proactive, rather
than reactive spending, and might align with the plans discussed in the preceding paragraph. Finally, NOAA storm
damage data was downloaded on the county-level. This data was visualized to assess any trends. A graph of
spending data for the four case studies was added to each case study narrative.
Funding/Financing Research
The final component of the research included an in-depth analysis of funding/financing sources available to utilities
within the state, a broad review of resilience funding programs in other states/regions, and research regarding
innovative funding/financing mechanisms for resilience. These three, distinct, portions of research represent the
resources already available, those that exist in other areas of the US and may have applicability to NC, and the
mechanisms that are emerging within financial markets to support utility resilience, but may not have immediate
applicability to North Carolina Utilities.
The results of this analysis include an in-depth memo and associated “one-pager” that detail the innovative financing
mechanisms and a high-level funding table of available resources. These resources can be found in Appendix C.
10Results
The research conducted provided an unsurprising look into the vulnerability of infrastructure in the eastern part of
the state. Historically, wastewater infrastructure has been built in low-lying areas, with the wastewater treatment
plant typically at the lowest point in town. Conversely, water infrastructure tends to be far less vulnerable for the
same reason: water infrastructure is generally built at a “high point” in town.
This divergence of need presents an interest challenge: the most vulnerable infrastructure, when breached, often
leads to environmental harm. The least vulnerable infrastructure (drinking water), when breached, often leads to
public health concerns, loss of service, and loss of revenue. Wastewater revenue is typically billed off of water use,
so loss of water service causes an equal impact on wastewater revenues. Loss of wastewater service, on the other
hand, does not impact billing purposes or revenue. Costs are incurred, but revenues remain intact.
Mapping and Vulnerable Infrastructure
The geospatial analysis determined that 1 out of
every 3 sewer treatment plants and 23% of the
sewer pumps are located in the 100 year (1
percent) flood plain in the Cape Fear, Lumber,
and Neuse river basins. Additionally, 1 of every
10 water distribution pumps and 1 in every 15
water treatment plants in these basins is located
in the 100 year flood plain. This equates to a total
of 54 water or sewer treatment plants and 197
water or sewer pumps in the 100 year flood plain.
In some cases, utilities have increased the actual
elevation of a pump or plant by building it on top
of a raised mound. In other cases, utilities have
increased the effective elevation of a pump by
building a wall around it to prevent inundation
from floodwaters. Additionally, utilities need to
raise a generator associated with a pump or plant
above flood plain levels. In many cases, these
efforts are required because utilities don’t have
Figure 2 Key infrastructure and elevation in eastern NC
the option to relocate infrastructure outside of the
floodplain and must make the infrastructure in
place more resistant to flooding. As seen in Figure 2, about 17 of the water and wastewater treatment plants located
in the 100 year flood plain are between 0 and 100 feet above sea level. The low slope of Eastern North Carolina
means that, even if it is physically and financially feasible, simply moving vulnerable infrastructure will likely not
be sufficient to increase elevation enough to prevent inundation—utilities must also raise the land where the pump
or plant is located.
11A specific example of infrastructure in a municipality is shown in Figure 3, the City of Laurinburg’s water and
sewer infrastructure. Although neither of the water or sewer treatment plants are in the 100 or 500 year flood plain,
5 sewer pumps are located in the 100 year flood plain. The wastewater treatment plant (the large green dot) is
located close to the 100 year flood plain, and there are at least 3 different low lying areas that transect the town.
Figure 3 City of Laurinburg and key infrastructure
Challenges with Utility Resiliency
The interviews conducted with the four local government utilities provided insights into the challenges, on a local
government utility level, of addressing resiliency. Challenges include the unpredictability of major storms, working
with FEMA, knowing what to plan for, rate pressure, competing needs at the utility, and finding funding. Each
interview followed a script that built an independent narrative on the utility. The full case studies can be found in
Appendix A. The key takeaways and challenges can be found in the sections that follow.
12Storm Damages & Unpredictability of Storms
By nature, large storms are challenging to predict. Some coastal areas may never experience the unprecedented
flooding of Hurricanes Matthew or Florence, but others may endure it on a semi-regular basis. In the case of
Hurricanes Florence, Michael, and Dorian, the mass of rainfall was compounded by already-high river levels and
saturated soils. In short, the water had nowhere to go. Instead, it sat, sometimes inundating towns for days.
Each storm was “unprecedented.” First, Matthew caused record flooding in 2016. Then, two years later Florence
broke that record. Shortly after, Hurricanes Michael and Dorian struck. The streak brought flooding to the forefront
of challenges facing utilities in the coastal plain, but the probability of a major storm in any given year is still low.
The interviews suggest that damages were an inevitability of that level of flooding. The amount of damage varied
considerably--from localized problems addressed very quickly to complete loss of water system pressure that took
nearly a day to recover. In all cases, the systems were back online quickly and, most of the time, customers may
have never known there was a problem. Utilities do not make the news for doing things right. Water and wastewater
systems are hidden underground and incredibly reliable. As such, community members only tend to draw attention
to the system in the rare times of unreliability. In the case of system pressure loss, the water system was offline for
nearly an entire day, followed up by boil water advisories until tests could assure the water was safe to drink. These
events tend to be notable given the rarity.
On the wastewater side, the threat of environmental harm due to overwhelmed systems is almost expected during
extreme rain events. As pressure mounts both inside and outside of old pipes, like that of New Bern, any
vulnerability almost certainly becomes a line break. Similarly, old systems often have old pipes with cracks that
take in flood waters, known as inflow and infiltration (I&I). In many cases, the amount of water associated with a
major flood can send large volumes into leaky pipes and on to the treatment plants, effectively overwhelming the
system. In these cases, the system often overflows, sending untreated wastewater into streams or rivers. In each
community, the drinking water treatment plan tends to be at the highest point along the waterbody and the
wastewater treatment plant tends to be at the lowest point. This effectively separates the drinking water intake from
the wastewater outfall.
During major storms, there is rarely a loss of wastewater “service,” so much as a resulting environmental hazard.
In cases of flooding, untreated wastewater is often sent into water bodies. There is almost always a community
“downstream” with an intake for drinking water supply, so while flooding obviously involves significant amounts
of water and dilution, the levels of fecal coliform and E. coli can often require additional treatment and public health
concerns in the community, even absent the obvious challenge of fishing and swimming in these water bodies.
Working with FEMA
FEMA remains the biggest source of recovery funds for water/wastewater utilities in NC. After Matthew and
Florence, utilities filled out extensive paperwork, attended sessions and seminars with FEMA representatives, and
then waited for the check to come in. In the case of Matthew, the money arrived slowly. In the case of Florence,
which hit in September 2018, as of May 2020, some of the money still had not arrived. One utility, expecting 2
million from FEMA had only just received the first check, for $100,000 in April of 2020.
This delay in funds means utilities are effectively “on their own.” For enterprise funds, this is often the goal: utilities
that are self-reliant. In the case of FEMA funds, it is creating accounting problems for utilities. Accounts receivable
13of $2 Million on two Comprehensive Annual Financial Reports (CAFRs) to the NC Local Government Commission
leaves some doubt on whether the funds will ever arise. In the case of Laurinburg, NC, the utility has to take the $2
million receivable from FEMA off of its financial statements, greatly darkening their financial situation from the
perspective of the Local Government Commission.
Whiteville, NC reported frustrations with FEMA funding, but the frustrations were not as pervasive as those in
Laurinburg. The utility was still waiting on remaining FEMA funds, but a thicker fund balance and fewer damages
led to less of a dire situation. In either case, both reported additional challenges working with FEMA for Florence
than Matthew, only two years prior. Citing FEMA staff turnover, the utilities did not have a solution for the problem.
Resilience Planning
In many cases, the answers for “what do you plan for?” differed. Utilities often reported planning for the minimum
requirements set forth by the NFIP and FEMA for future infrastructure, such as 100- or 500-year floodplains, but
in other cases, anecdotal accounts of regularly flooded areas is used as the basis for future planning. For older
communities, like New Bern, there is not really anywhere to move the infrastructure. There is no higher ground.
Historic parts of the town sit at or below sea level and still need water and wastewater service. So, the question is
not “where to move?” but rather how to replace existing infrastructure with new, more resilient infrastructure.
In the case of Whiteville, parts of town run along the river. This is not uncommon in North Carolina, but in low-
lying parts of the state, it can result in lingering riverine flooding with devastating consequences. Similarly, in
Laurinburg, the town had once worked with the Army Corps of Engineers to design a stormwater retention area.
Overtime, sediment has built up in the system, effectively reducing the volume of water that can be stored. Despite
complaints from the town, the Army Corps has not addressed the problem. For CFPUA, a higher capacity utility,
all aspects of planning involve a look at sustainability and resilience of the system. Indeed, the capital improvement
plans include sustainability-specific additions to move the system into a modern environment. But even still, it is
unclear how to operationalize “resilient” infrastructure.
Across the four case study interviews, none of the respondents remembered the ReBuild NC Plans following
Hurricane Matthew. While the effort on the part of the state was reflected in some Capital Improvement Planning,
the lack of supplementary funding for implementing the infrastructure likely reduced the impact of the funding.
Indeed, going forward, should the State invest in resilience planning, it should consider working hand-in-hand with
communities to outline resilience needs, and consider a funding arm for implementing recommendations from the
resilience plan.
Raising Rates and Competing Needs
To meet capital needs across the state, even absent major flood events, water and wastewater rates will have to
increase. Indeed, rates have been increasing at a rate faster than inflation for years, making up for an era with
artificially low rates sustained by grants from state and federal sources. Now, add in flood resilience. For
communities with repeated flooding problems, combating the issue often means allocating capital funds to
emergency situations. This keeps utilities on their heels; constantly battling to keep the system running and meeting
Safe Drinking Water Act and Clean Water Act standards.
In some cases, utilities are using the CIP to target flood prone areas to accomplish resilience and aging infrastructure.
When funds are available, this works well, but when assistance funds are lacking it is an additional challenge.
14Indeed, FEMA’s mitigation funding requires a benefit-cost analysis that illustrates a clear return on investment from
the project. While this makes sense from the perspective of FEMA, this analysis requires time and money--two
things that small utilities may not have.
Despite the challenges reported with nearly all aspects of FEMA funding, many utilities reported positive
experiences working with the Golden Leaf Foundation. While FEMA staff turnover regularly, long-term Golden
Leaf Foundation staff allow for relationship building and clearer expectations for funding amounts and expected
arrival of funding.
Funding for Resilience
Unsurprisingly, resilience is expensive. It is built on the notion of mitigating long-term costs, rather than
immediately realizing the benefit of improved infrastructure. Similarly, there are many funding streams for disaster
recovery, but few for resilience. While the notion of “using disaster recovery funds from the next storm to fund
resilience” was joked about, it is not a viable option. The impetus on reactive funding has long been the response
to hazards on the local level, in large part due to the unpredictability of floods, the short-term costs of resilience,
and the long-term benefits of resilience.
Additionally, in some cases it is just physically challenging to move infrastructure or make it more resilient without
also buying out entire neighborhoods. In New Bern, for example, historic downtown areas are typically the lowest-
lying, leaving the city without much choice in rebuilding after floods. Without moving the development in the area,
there is no alternative. Service cannot just be denied. In the cases where utilities can move infrastructure, the process
is not easy. FEMA mitigation funding requires benefit-cost analysis or ecosystem service analysis, both of which
require consultant costs and a more complex understanding of alternatives. Similarly, most funding programs
require matching funds. While this is not a bad thing, and requires buy-in from the communities, it can be a
challenge for the smallest utilities in rural areas. As rates need to rise to meet basic capital needs, the incomes of
customers become more constrained, leaving little room for funding resilience.
Since the research began, a new planning and funding program, the NC Resilient Communities program has
launched. Established by the NC Office of Recovery and Resiliency (NCORR), the NC Division of Coastal
Management (DCM), and the NC Rural Center, the program aims to help local governments plan and implement
resiliency and risk mitigation projects. To this end, the program has secured $3.4 million in state and federal grant
funding from sources like the Community Development Block Grant. The NC Resilient Community Program can
also be further broken down into two separate programs: the Rural Resilient Communities Program and the Resilient
Coastal Communities Program. Phase 1 of the Rural Resilient Communities Program, managed by NCORR and the
N.C. Rural Center, will first produce a statewide resilience framework and guidebook for local communities, while
Phase 2 of the program will focus on regional training and technical assistance for eastern North Carolina counties.
In the Resilient Coastal Communities Program, managed by the DCM, all municipal and county governments within
the 20 coastal counties (Beaufort, Bertie, Brunswick, Camden, Carteret, Chowan, Craven, Currituck, Dare, Gates,
Hertford, Hyde, New Hanover, Onslow, Pamlico, Pasquotank, Pender, Perquimans, Tyrrell, and Washington) can
apply to receive funding to conduct a Risk and Vulnerability Assessment Report and develop a project portfolio of
options aimed at reducing exposure, reducing sensitivity, or increasing adaptive capacity to flooding and other
hazards in Phases 1 and 2. A total of $600,000, or an average budget of $30,000 per community, as well as no-cost
technical assistance services, is available for the first two phases. Upon completion, participating communities will
become eligible to apply for financial assistance and funding for project construction.
15Looking Forward: Funding and Financing Options
The EFC at UNC regularly updates a funding table of disaster recovery funds for water and wastewater utilities
(Appendix B), with a recent emphasis on resiliency funding and financing programs. This table inventories existing
funding sources within the state of NC, but does not include what the EFC considers “innovative” funding or
financing sources. Appendix C also inventories the innovative financing mechanisms that could be applicable to
the water and wastewater utility, drawing from examples across the US. These include example programs from
other states as well as innovative financing options that utilize market-based solutions. For smaller utilities, the
latter is likely unfeasible, but the former may provide direction for the state. In either case, for interested utilities,
Appendix C provides an in-depth look and overview of available programs.
Rhode Island and Massachusetts have both launched coupled planning/action grant programs. These programs first
require municipalities to conduct resiliency planning, and then upon certification of the plans the municipalities are
eligible for action grants to begin the associated resiliency capital projects. NC has recently launched a similar
program—the Resilient Coastal Communities Program. On the federal level, FEMA recently launched its Building
Resilience in Communities program (BRIC) that funds resiliency projects based on a percentage of the previous
year’s disaster expenses. These three programs are described in a bit more detail below, followed by a few
recommendations for the NC Resilient Communities Program.
Rhode Island Municipal Resiliency Program (MRP)
First established in the July 2018 by Governor Raimondo, the MRP provides direct assistance to cities and towns
working to identify and implement priority projects improving the municipality’s resilience to top natural and
climate-related hazards. Upon completing the Community Resilience Building (CRB) process in which they
develop a portfolio of actionable risk mitigation projects, the municipalities are designated a “Resilient Rhody
Municipality” and can apply for dedicated action grants. Additionally, once towns and cities are accepted into the
program, they are assigned MRP facilitators who can provide technical assistance to communities in completing
the assessment and resiliency plan using the Community Resilience Building Framework. Each annual cohort has
a minimum of $1 million in MRP Action Grants available, though municipalities must be able to match grants with
a 25% local project cost-share. Eligible projects are identified through CRB and grant eligibility must fall under the
Rhode Island Infrastructure Bank’s portfolio of programs, including dam repair and removal, road elevation,
hardening or elevation of pump stations, berms and levies, culvert repair, green stormwater infrastructure, back-up
power and energy efficiency, watershed restoration, urban tree planting, and coastal erosion control. MRP grants
cannot be used for research-related activities.
Massachusetts Municipal Vulnerability Preparedness (MVP) Program
The Massachusetts MVP program was created in 2017 under Governor Baker’s executive order to provide
support for cities and towns wanting to identify climate hazards, assess vulnerabilities, and develop resiliency
action plans. In general, the state has appropriated over $44 million since 2017 towards the MVP program, with
$11.1 million being awarded just last year. This state support is critical given that 89% of Massachusetts cities
and towns, or 312 municipalities, have voluntarily enrolled in the program. More specifically, the program
consists of two different grant rounds. First, the MVP Planning Grant round offers funding to municipalities that
wish to assess their vulnerability and receive designation from the Executive Office of Energy and Environmental
Affairs (EEA) as an MVP Community. Once designated an MVP Community, municipalities can then apply for
16Action Grants. In general, 9 core principles are considered in the Action Grant application process: furthering a
community-identified priority action to address climate change impacts, utilizing best available climate data,
employing nature-based solutions, improving outcomes for environmental justice and climate-vulnerable
populations, conducting robust community engagement, achieving broad and multiple community benefits (e.g.
public health, social, economic, etc.), committing to monitoring project success into the future, utilizing regional
solutions towards regional benefit, and pursuing innovative, transferable approaches.
BRIC
The FEMA Building Resilience Infrastructure and Communities (BRIC) program aims to support states, local
communities, and other territories in financing hazard mitigation projects. The program, funded by a 6% set-aside
from federal post-disaster grant funding, can distribute up to $500 million to all 50 states, U.S. territories,
federally recognized tribal governments, and the District of Columbia. While the vast majority of available funds
($446.4 million) are to be allocated through the national competition for mitigation projects, all 50 states and U.S.
territories can apply to receive up to $600,000 from the $33.6 million reserved under the State/Territory
Allocation, while tribal governments can apply to receive some funding from the $20 million set-aside for tribal
applicants. Generally, the cost-share of the grant is 75% federal/25% non-federal, but small, impoverished
communities can appeal for an increase in cost-share up to 90% federal/10% non-federal.
To apply for the national competition, all applicants—meaning all 50 states, U.S. territories, federally recognized
tribal governments, District of Columbia—must have received a major disaster declaration under the Stafford Act
in the 7 years before the annual grant application period start date, have a FEMA-approved State or Tribal Hazard
Mitigation Plan, and can designate one agency that will be in charge of applying. Although only one application
for the competition is allowed per state, there can be an unlimited number of subapplicants—or local
governments, tribal governments, other state agencies, tribal agencies, homeowners, business operators, and non-
profit organizations with a FEMA-approved Local or Tribal Hazard Mitigation Plan—that can sign onto the main
application through their state/territory/tribal applicant agency. Project applications are then evaluated in two
stages. First, the National Technical Review awards points for the following eight criteria when determining if a
project is cost-effective and technically feasible: (1) an explanation of the infrastructure project and how it will
mitigate natural hazard risk, (2) an indication that the project will mitigate risk to at least one of the seven
Community Lifelines, (3) the incorporation of nature-based solutions, (4) the adoption of mandatory building
codes, (5) a Building Code Effectiveness Grading Schedule Rating of 1 to 5, (6) an application generated from a
previous FEMA Hazard Mitigation Assistance Advance Assistance Award, (7) need for increased non-federal
cost-share, and (8) designation as a small, impoverished community. Then, through the qualitative review stage,
applicants have the opportunity to explain the strengths of projects and are evaluated against the following six
criteria: (1) risk reduction/resiliency effectiveness, (2) future conditions, (3) implementation measures, (4)
population impacted, (5) outreach activities, and (6) leveraging partners. The project’s cumulative score from the
technical and qualitative review stages will determine its priority order among all the projects considered for the
national competition.
17Recommendations for NC Resilient Coastal Communities Program
The NC Resilient Coastal Communities Program provides a starting point for some communities to start building
resiliency plans or implement projects that have already been planned. However, there needs to be ongoing
support for these projects, and for future rounds of funding, to ensure that each coastal community has the support
to plan for and mitigate the effects of flooding. $30,000 can help with the process of planning or implementation
for a community, but will not be adequate to address even just the most high risk needs. If possible, the NC RCCP
should help communities leverage funding beyond the actual program, such as FEMA BRIC, CDBG grants,
innovative funding sources, to ensure the ongoing implementation of their resilience plans. Additionally, as part
of a community’s resilience plan, which already includes the aspects of social and economic resilience, the
financial resilience of the local government should be taken into consideration. Finally, ongoing evaluation of
how funding was awarded and how funding is actually used, as well as an evaluation of the process of
participating in the program by interviewing grantees, will provide feedback that can help make sure the NC
RCCP is meeting its goals.
Other Innovations: Financing
The UN Sustainable Development Goals and Paris Agreement have put an extra emphasis on the role of private
capital in climate mitigation and adaptation. As such, the private market has created a number of mechanisms for
financing green projects, including green bonds, sustainability bonds, social impact bonds, and environmental
impact bonds. Each of these serves a particular role, but typically involves additional administrative and reporting
costs. To hedge against greenwashing or using the funds for grey purposes, accounting standards and certification
programs have been created. While generally successful in keeping the green markets green, these require additional
upfront costs from issuers. For smaller entities, this is not feasible.
Nevertheless, the green markets are expanding, and more green debt has been issued in 2020 than any other year.
Current issuers include the State of Massachusetts, San Francisco Utilities, Central Arkansas Water, the City of
Boston, DC Water, and Atlanta Department of Watershed Management, amongst others. To date, most issuers have
been larger municipalities and/or utilities.
While innovative options may not be the best avenue for small utilities at the present time, trends in federal
government spending since the 1980’s suggest a market-focused approach to infrastructure. Finding and
implementing market-based solutions will become more critical, as will leveraging the insurance market. Indeed,
the NC insurance market has found a way to encourage more resilience rebuilding for private homeowners, but as
public entities rely on the public NFIP insurance program, a similar incentive has yet to be implemented for public
utilities. The Innovative Financing Memo and supplemental one-pager explains this further, as seen in Appendix C.
18Policy Recommendations
The policy recommendations are based on extensive research on funding and/or financing options for utilities, as
well as the case study interviews and focus group. The findings highlight opportunities for new or improved
policies/programs. These recommendations mirror those in the executive summary and first address the research
finding, followed by a specific policy or programmatic intervention.
Wastewater Infrastructure Tends to be Most Vulnerable
Of the communities interviewed, most cited wastewater impacts as a result of Matthew and/or Florence. And it
makes sense, as stated previously, wastewater infrastructure tends to be built at the lowest point in town, making it
ripe for flooding impacts. The infrastructure is often built in the floodplain to utilize gravity and reduce pumping,
and given the cost of a new Wastewater Treatment Plant, moving is not a quick or easy solution. The most common
wastewater treatment failure cited was an overflow at the treatment plant and the disposal of untreated waste into
waterways. While the public health impacts are slightly further removed than the loss of drinking water service, the
environmental and downstream impacts still necessitate a better understanding of how to resolve these challenges
going forward.
Policy Recommendation: The State should consider water holistically, thinking about the connectedness of water
resources when making legislative changes related to flood resilience.
Vulnerabilities are real, but the impacts can be buffered by reliable staff
All communities explained at least one serious issue as a result of Florence and/or Matthew. In some cases, the
issue was isolated and in others it was system-wide. Regardless of the scope of the issue, all respondents cited the
hard work of their staff as a reason the issue was not worse or was resolved quickly. In some cases, staff braved
hurricane conditions to curb the issue and in other cases staff worked around the clock. Water and wastewater
infrastructure is largely hidden from the greater community and workforce development is a growing challenge in
the field. Going forward, utilities should continue to invest in their staff and showcase the staff’s hard work to the
public--perhaps without showcasing the system vulnerabilities.
Policy Recommendation: The State should work to improve workforce development within the water and
wastewater sector, especially as the current workforce ages and the new workforce dwindles in size.
Recovery Funding is not reliable
Despite heavy reliance on FEMA funding, most respondents cited great challenges with attaining that funding.
Respondents cited heavy turnover within FEMA, lack of communication, and years long waiting times for funding
as reasons for concern. Indeed, one utility noted that their auditor stated they could no longer put FEMA money on
their accounts receivable, as it had been too long. This will have a negative impact on their financial indicators and
likely raise red flags at the Local Government Commission. While utilities cited that they do believe the money will
come, FEMA is no longer a quick lifeline. Grant funders like the Golden Leaf Foundation were considered much
more efficient partners, likely signaling a need for change in the FEMA system.
Policy Recommendation: The State should consider launching a bridge funding/financing program that allows
utilities to borrow money to repair/replace critical infrastructure while waiting for FEMA money.
19You can also read