Foot-and-Mouth Disease Economic Impact Assessment: What it means for New Zealand MPI Technical Paper No: 2014/18 By Rod Forbes and Andre van ...
←
→
Page content transcription
If your browser does not render page correctly, please read the page content below
Foot-and-Mouth Disease
Economic Impact Assessment:
What it means for New Zealand

MPI Technical Paper No: 2014/18
By Rod Forbes and Andre van Halderen

ISBN No: 978-0-478-43700-3 (online)
ISSN No: ISSN 2253-3923 (online)

August 2014
Disclaimer
While every effort has been made to ensure the information in this publication is accurate, the
Ministry for Primary Industries does not accept any responsibility or liability for error of fact,
omission, interpretation or opinion that may be present, nor for the consequences of any decisions
based on this information.

This publication is only available on the Ministry for Primary Industries website at
http://www.mpi.govt.nz/news-resources/publications.aspx

© Crown Copyright - Ministry for Primary Industries

Ministry for Primary Industries   Foot-and-Mouth Disease Economic Impact Assessment: What it means for New Zealand • i
Contents
Executive summary ........................................................................................................................................ 4
   Epidemiology and Scenarios..........................................................................................................................................4
   Production and export impacts ......................................................................................................................................4
   Table 1: Lost Export Earnings to June 2012 ($bn) .......................................................................................................5
   Macroeconomic impacts ................................................................................................................................................6
   Table 2: Real and Nominal GDP for Large Scenario for June Years ..........................................................................6
   Discussion .......................................................................................................................................................................6
Introduction ..................................................................................................................................................... 8
Section 1: Foot-and-mouth disease ............................................................................................................. 9
1.1           Background primer .......................................................................................................................... 9
   Figure 1: Current world situation of FMD.......................................................................................................................9
1.2           Responding to FMD ....................................................................................................................... 10
1.3           Vaccination ..................................................................................................................................... 11
   Figure 2: FMD virus pools 2011–2013 ....................................................................................................................... 11
Section 2: The modelling ............................................................................................................................. 12
2.1           Methods ........................................................................................................................................... 12
2.2           The epidemiological modelling .................................................................................................... 12
   Figure 3: Cumulative distributions of IPs for medium, large and large with vaccination scenarios ......................... 13
   Table 3: Data on FMD incursion scenarios ................................................................................................................ 14
   Table 4: Livestock to be destroyed for welfare purposes .......................................................................................... 14
   Figure 4: Distribution of infected premises within 10-kilometre radius surveillance zones ...................................... 15
2.3           The economic modelling ............................................................................................................... 16
   2.3.1          How processors might respond .................................................................................................................. 16
   2.3.2          How importing countries might respond ..................................................................................................... 16
   Table 5: Dates from incursion to restoration of exports ............................................................................................. 17
   2.3.3          Production and export modelling ................................................................................................................ 17
   Figure 5: Meat and other products export value losses for FMD scenarios ............................................................. 18
   Figure 6: Dairy export values for FMD scenarios....................................................................................................... 19
   2.3.4          FMD eradication and livestock compensation expenditure ....................................................................... 19
   Table 6: Eradication and livestock compensation ...................................................................................................... 19
   2.3.5          The Broader Economic Modelling............................................................................................................... 20
Section 3: Results and Discussion ............................................................................................................ 21
3.1          NZIER modelling results................................................................................................................ 21
   Table 7: GDP results for FMD incursion scenarios .................................................................................................... 21
   Table 8: Macroeconomic results for year ended June 2012 ..................................................................................... 21
   Table 9: Industry impacts – value added and employment impacts in the year to June 2012 ................................ 22
3.2          Discussion ...................................................................................................................................... 25
   Figure 7: Real GDP annual percent change baseline and FMD large scenario impacts ......................................... 25
   Uncertainties ................................................................................................................................................................ 25
   Figure 8: NPV of real GDP 2012 to 2020 by days of FMD incursion for scenarios .................................................. 26
   Factors that influence economic costs ....................................................................................................................... 27
   Importance of preparedness work .............................................................................................................................. 27
Section 4: Next steps.................................................................................................................................... 28
4.1          Development of a New Zealand FMD Response Strategy ........................................................ 28
4.2        New Zealand’s current FMD vaccination policy and consideration of alternative
           strategies ............................................................................................................................................ 28
References ..................................................................................................................................................... 30
Glossary ......................................................................................................................................................... 32
Acknowledgements ...................................................................................................................................... 32
Appendix 1 – Parameterisation of Interspread Plus for the epidemiological modelling .................... 34
Appendix 2 – Compensation under the Biosecurity Act 1993 ............................................................... 37
Appendix 3 – The Treasury’s macroeconomic model ............................................................................. 38

Ministry for Primary Industries                         Foot-and-Mouth Disease Economic Impact Assessment: What it means for New Zealand ● 3
Executive summary
In 2013, New Zealand’s Ministry for Primary Industries (MPI), in partnership with primary
industry organisations, began new work on New Zealand’s preparedness for an outbreak of
foot-and-mouth disease (FMD). This report is part of that project and explores the potential
economic impacts of FMD under several scenarios.
New Zealand’s heavy reliance on exports of animal products makes us uniquely vulnerable
to FMD. While the risk of an incursion is considered low, the impact would be severe.
Understanding the potential economic cost is an important element in ensuring that we are
prepared if an outbreak were to occur.
There are four main analytical stages to this work:
• Epidemiological models are used to simulate the way FMD might spread throughout
the country from an initial outbreak;
• Scenarios were selected from the epidemiological modelling to represent a range of
potential disease spread patterns;
• Production models were used to estimate the cash impacts on producers and export
receipts under each scenario; and
• A whole economy macroeconomic model was used to trace the ripple effects of
these cash impacts through the economy.
Epidemiology and Scenarios
A FMD incursion was assumed to occur on a lifestyle property in Taranaki. Random variation
in the Interspread Plus (ISP) model was used simulate 100 possible spread patterns from
this same introduction.
Three scenarios were selected from these 100 possibilities. There was only one infected
property (IP) in the “small” scenario; 52 IPs in the medium scenario and 508 IPs in the large
scenario. In none of these cases did the disease infect South Island properties – this was
intentional to allow for an assessment of disease free zoning for the South Island which
assumed that earlier resumption of South Island exports could be negotiated.
Vaccination can help reduce the spread of FMD and vaccination was also modelled. From
this, two economic options were modelled: vaccination-to-die (VTD) means animals are
vaccinated to stop the disease spreading but are then destroyed; vaccination-to-live (VTL)
does not involve destroying the vaccinated animals. Under existing trade rules, FMD-free
status takes twice as long to restore (six months after the last case, rather than three
months) if VTL is used rather than VTD.
Production and export impacts
The modelled FMD incursion was assumed to have taken place on 30 September 2011, and
impacts were assessed relative to actual exports from that date. Expert advice was used to
develop assumptions regarding the response of processing industries in New Zealand and
export partner countries. For example, in the large scenario it was assumed that
• Export meat slaughter would cease for 10 months;
• Dairy production closed down for the remainder of the season in the North Island
while South Island milk was double pasteurised; and
Ministry for Primary Industries Foot-and-Mouth Disease Economic Impact Assessment: What it means for New Zealand ● 4• Trading partners varied in the time they re-opened export markets to New Zealand.
The production modelling indicated that most of the impact occurred in the year to June
2012, followed by a recovery period when earnings were actually higher, reflecting the build-
up of saleable product after the disease was stamped out but before export markets re-
opened. The following chart shows this time pattern for the meat sector; dairy follows a
similar pattern.
500
0
-500
Small
$ millions
-1,000 Medium
Large
-1,500
L vacc-to-live
-2,000 L vacc-to-die
-2,500
Dec-11
Dec-12
Sep-11
Sep-12
Sep-13
Jun-11
Mar-12
Jun-12
Mar-13
Jun-13
Lost export earnings under different scenarios are shown in Table 1.
Table 1: Lost Export Earnings to June 2012 ($bn)
Scenario Dairy sector Meat sector
Small 2.00 2.73
Medium 3.20 3.55
Large 8.84 5.87
VTD 3.96 4.25
Earlier FMD free recognition for the South Island1 8.84 4.94
1
This scenario is a modification of the large scenario whereby the South Island is declared FMD free enabling an earlier
start to export trade.
In addition, for the large scenario eradication costs of $1,169m and compensation costs of
$31m were incurred.
With export meat processing closed until trading partners opened up again, livestock that
would otherwise have been slaughtered remained on farms and would have had to be
destroyed for animal welfare purposes by their owners – 16.5 million lambs, 3.1 million adult
sheep, 3.1 million adult cattle and calves and 356,000 deer in the reference case. A further
culling of 10,775 sheep, 19,661 cattle and 331 deer was required for disease control
purposes.
Ministry for Primary Industries Foot-and-Mouth Disease Economic Impact Assessment: What it means for New Zealand ● 5Macroeconomic impacts
The New Zealand Institute of Economic Research (NZIER) was contracted to estimate the
macroeconomic impacts of FMD incursion scenarios both nationally and by industry using
their Computable General Equilibrium Model (CGEM). The model outputs are annual values
comparing each scenario to a baseline of no FMD outbreak. Table 2 shows the GDP
impacts for the large scenario over the first two years following a hypothetical FMD outbreak
on 30 September 2011.
Table 2: Real and Nominal GDP for Large Scenario for June Years
Year to June 2012 Year to June 2013
Real GDP -7.8% 0.5%
Nominal GDP (billion dollars) -$13.8 $1.2
The CGEM provided distributional impacts across 106 industries. Farm level and processing
industries were the worst hit, followed by industries that supplied goods and services, and
household expenditure industries because of lower incomes. However, there were industries
that benefited from exchange rate depreciation and lower prices from reduced competition
for intermediate goods and services, labour and capital. Tourism industries benefited as the
depreciated exchange rate increased spending in New Zealand dollars by tourists.
Government expenditure on FMD eradication provided a short-term boost to GDP, but it was
assumed to be funded by government borrowing overseas and paid back by 2020. The net
present value (NPV) loss in real GDP over June years 2012 to 2020 was estimated at
$16.2bn for the large scenario.
The VTL option reduced the FMD eradication and livestock compensation costs, but
increased the World Organisation for Animal Health (OIE) current FMD freedom recognition
time from three to six months (after the last FMD case). Based on the assumptions used, the
VTD option reduced NPV real GDP loss by 46 percent to $8.7 billion compared to
$10.5 billion for the VTL option. Further work is required to assess an optimal vaccination
strategy.
The South Island free option explored an earlier recognition of FMD freedom for the large
scenario. Based on the assumptions used, the NPV real GDP loss was reduced from
$16.2bn to $15.6bn, a three percent reduction.
Discussion
The broad pattern of these results is considered reliable. In particular, it is likely that an
outbreak of FMD would cause:
• a large loss of national income with most of the impact falling on the primary
sector and agricultural processors;
• an increase in world prices for agricultural commodities;
• a depreciation in New Zealand’s exchange rate; and
• recovery timing (after eradication) that depends on our trading partners.
Ministry for Primary Industries Foot-and-Mouth Disease Economic Impact Assessment: What it means for New Zealand ● 6The main statistical uncertainties are over the scale of an outbreak (and therefore the cost of eradication and compensation) and the timing of markets re-opening. These matters could result in materially higher economic costs than those estimated in this work. In addition, even using the scale and timing assumptions adopted here, costs would be higher as a result of slaughter and compensation costs for animals destroyed on suspicion, from movement controls and from any recovery package adopted by the government of the day. This economic impact assessment reaffirms the value of investment in FMD prevention and preparedness, and provides useful guidance on areas of mitigation where efforts should be focused. Ministry for Primary Industries Foot-and-Mouth Disease Economic Impact Assessment: What it means for New Zealand ● 7
Introduction
In 2013, New Zealand’s Ministry for Primary Industries (MPI), in partnership with primary
industry organisations, began new work on New Zealand’s preparedness for an outbreak of
foot-and-mouth disease (FMD). This report is part of that project and explores the potential
economic impacts of FMD under several scenarios.
New Zealand’s heavy reliance on exports of animal products makes us uniquely vulnerable
to FMD. While the risk of an incursion is considered low, the impact would be severe.
Understanding the economic cost of an outbreak is an important component of being
prudently prepared and can help to:
     •     inform decision-making to determine an optimal “New Zealand Incorporated” strategy
           for responding to an incursion of FMD
     •     analyse different disease mitigation measures;
     •     identify useful trade intervention measures;
     •     target interventions in the most cost-effective way; and
     •     develop reasonable cost sharing strategies between government and industry.

Existing information on the cost of a FMD incursion dates back to a 2003 assessment which
was undertaken for a different purpose. 1 Since then there have been material changes in the
destination of New Zealand’s exports and in trading agreements that include terms aimed at
continuing trade in the event of an outbreak. It is therefore timely and prudent to investigate
the likely economic costs.
This report is structured as follows.
Section 1 presents relevant background information on FMD, including the options for
responding to an outbreak and the way these choices are likely to affect exports.
Section 2 describes the modelling work undertaken to explore the economic costs of an
outbreak of FMD in New Zealand.
Section 3 presents and discusses the results of the modelling.
Section 4 outlines the next steps.

1This was joint work by Reserve Bank of New Zealand and The Treasury assessment aimed at testing the robustness of the New
Zealand banking systems.

Ministry for Primary Industries           Foot-and-Mouth Disease Economic Impact Assessment: What it means for New Zealand ● 8
Section 1: Foot-and-mouth disease
1.1 Background primer
FMD is a highly contagious viral disease that can infect all species of cloven-hoofed
animals. It is rarely fatal to adult animals, but high mortality is common in young animals.
Symptoms include fever and blister-like sores on the tongue and lips, in the mouth, on
the teats and between the hooves. The disease causes severe production losses and
while many affected animals recover, the disease often leaves them weakened and
debilitated.
Key points to note are:
• FMD does not affect humans, and there is no food safety risk associated with
consuming products from animals infected with FMD.
• The organism which causes FMD is a virus from the family Picornaviridae. Seven
strains of the virus are known. 2
• The current World Organisation for Animal Health (OIE) 3 4 official list of free
countries and zones with or without vaccination is shown in Figure 1. 5
Figure 1: Current world situation of FMD
FMD -Free Endemic Intermediate, Free with vaccination
Countries with multiples zones:
Free. Virus present in game parks sporadic
FMD-free, free with vaccination or not free
Source: OIE.
2 A, O, C, SAT1, SAT2, SAT3, Asia1
3 http://www.oie.int
4 OIE is recognized by the World Trade Organisation (WTO) as having responsibility for animal health issues.
5 OIE. http://www.oie.int/fileadmin/Home/eng/Media_Center/docs/pdf/Disease_cards/FMD-EN.pdf. Accessed 22 June 2014.
Ministry for Primary Industries Foot-and-Mouth Disease Economic Impact Assessment: What it means for New Zealand ● 91.2 Responding to FMD
Countries that are free of FMD have traditionally responded to outbreaks of FMD through
so-called “stamping out”, a policy that is defined by the OIE and referenced in trade
agreements.
The OIE defines a stamping-out policy 6 as requiring:
…the killing of the animals which are affected and those suspected of being
affected in the herd and, where appropriate, those in other herds which have
been exposed to infection by direct animal to animal contact, or by indirect
contact of a kind likely to cause the transmission of the causal pathogen. All
susceptible animals, vaccinated or unvaccinated, on an infected premises should
be killed and their carcasses destroyed by burning or burial, or by any other
method which will eliminate the spread of infection through the carcasses or
products of the animals killed.
Stamping out involves the rapid destruction and disposal of large numbers of livestock.
This can be highly resource intensive and can also lead to criticism within the community
of the method of disposal (Buetre et al, 2013).
The Food and Agriculture Organization of the United Nations (FAO) also endorses
stamping out and defines its crucial elements as: 7
• designation of infected zones;
• intensive disease surveillance to identify infected premises and dangerous-
contact premises or villages within these zones;
• imposition of quarantine and livestock movement restrictions;
• immediate slaughter of all susceptible animals either on the infected and
dangerous-contact premises or in the whole infected area;
• safe disposal of their carcasses and other potentially infected materials;
• disinfection and cleaning of infected premises; and
• maintaining these premises depopulated of susceptible animals for a suitable
period.
Stamping out is the cornerstone of New Zealand’s current FMD policy. 8 MPI would lead
the response using powers under the Biosecurity Act 1993. The aim would be to regain
FMD-free country status with minimum delay.
6 OIE. http://www.oie.int/index.php?id=169&L=0&htmfile=glossaire.htm. Accessed 22 June 2014.
7 FAO. http://www.fao.org/docrep/004/y0660e/y0660e00.htm. Accessed 22 June 2014.
8 MPI Response Plan for Foot-and-Mouth Disease, version 11, 2011.
Ministry for Primary Industries Foot-and-Mouth Disease Economic Impact Assessment: What it means for New Zealand ● 101.3 Vaccination
New Zealand is recognised by the OIE and by our trading partners as a FMD-free
country where vaccination is not practised. To retain this status, FMD vaccine cannot be
used pre-emptively before an outbreak occurs.
During an outbreak, there are two vaccination strategies that could be run concurrently
with stamping out. Vaccinate-to-live (VTL) and vaccinate-to-die (VTD) both involve
identifying the virus strain, procuring and administering the vaccine. They differ in that
under VTD, the animal is slaughtered once killing capacity becomes available, whereas
under VTL it lives a normal life.
Under the current OIE rules the time required from the end of an outbreak to the
resumption of FMD-free status is six months if a VTL process is used, but only three
months if VTD is used. Thus, while VTL requires fewer animals to be destroyed, it also
involves a longer disruption to normal trade. The OIE trade rules are currently under
review.
There are seven strains of the virus, and even within these strains there are differences
(see Figure 2). This means that in an outbreak the strain of virus needs to be determined
first, so that it can be matched against available vaccines to determine which one is likely
to be most effective. New Zealand maintains a bank of antigens (the raw materials used
to produce the vaccine) in the United Kingdom (UK) that allows for emergency vaccine to
be produced rapidly in the event of an outbreak. This emergency vaccine is the so-called
high-potency vaccine. Immunity to FMD can occur as soon as four to five days after
vaccination (Geale et al, 2013). However, it may not prevent the animals becoming
infected and spreading the virus (Cox and Barnett 2009; Halasa et al, 2012). However,
vaccination reduces the level of spreading and therefore reduces the risk of viral spread
(Cox and Barnett, 2013).
Figure 2: FMD virus pools 2011–2013
Source: FAO.
Ministry for Primary Industries Foot-and-Mouth Disease Economic Impact Assessment: What it means for New Zealand ● 11Section 2: The modelling
2.1 Methods
This study was designed by a panel with expertise in the fields of economics,
epidemiology, disease control and trade. It used epidemiological modelling to specify the
geographic reach and impact of different FMD outbreaks, followed by economic
modelling to estimate the resulting costs.
2.2 The epidemiological modelling
Epidemiological modelling was undertaken by AsureQuality using Interspread Plus (ISP),
a stochastic simulation model. 9 It is a state transition model with the farm (and not
individual animals) as the epidemiological unit of interest. As a FMD outbreak
progresses, affected farms can transition from being “susceptible” to “infected”, and then
“recovered/immune or depopulated”.
Three possible set-ups of the model have previously been outlined by experts:
• minimal, which assumes reduced movements associated with the “quiet” farming
season only, so there is no airborne spread and no dairy tanker movements are
involved;
• standard, which uses an average number of movements and includes the possibility
of disease spread by dairy tankers but no airborne spread; and
• maximal, which uses the maximum number of movements which are expected during
the “busy” farming season, and provides for spread by dairy tankers and for airborne
spread.
The standard option was used for this study and it was assumed that the FMD outbreak
began on a lifestyle block with swill-fed pigs surrounded by dairy farms in Taranaki. For
the three baseline scenarios, the control strategy assumes a stamping-out policy, with
successful destruction and disposal on infected properties (IP) and movement controls
preventing spread of FDM across New Zealand. Each time the model runs, it predicts a
different pattern of disease spread. The model was run 100 times, and three baseline
scenarios were chosen from these 100 runs so as to represent the range of possible
outcomes. 10
• Small scenario
This scenario lasts one day and has only one IP. It represents a case where passive
surveillance detects the disease prior to the infection moving off the property.
Detection happens on day 21 post infection. This scenario resulted in nine sheep and
two pigs being depopulated on this IP.
9Comparison studies between ISP and other international simulation models have been an effective process of verification and validation
of ISP, and it is the modelling platform currently contracted by MPI for use in the event of an actual outbreak of FMD (Dube et al, 2006).
10 Appendix 1 provides further detail on the parameterisation of the model.
Ministry for Primary Industries Foot-and-Mouth Disease Economic Impact Assessment: What it means for New Zealand ● 12• Medium scenario (iteration 88)
This scenario contains the average number of IPs across all 100 iterations. This
outbreak lasts 50 days and has 52 IPs. This resulted in the depopulation of 443 beef
cattle, 5048 dairy cattle, 153 sheep, 34 pigs and 7 goats on these IP. These exclude
any possible slaughter on suspicion of FMD infection. The first case is detected on day
18 post infection and the index case (i.e. the original source) identified 3 days later by
tracing activity. This scenario is limited to the Taranaki region.
• Large scenario (iteration 96)
The large scenario lasts 191 days and has 508 IPs. This resulted in the depopulation
of 8780 beef cattle, 10 881 dairy cattle, 331 deer, 10 775 sheep, 93 pigs and 407
goats on these IPs. These exclude any possible slaughter on suspicion of FMD
infection. This scenario affects the North Island only. The first case is detected on day
20 post infection and the index case is identified promptly following tracing activity on
the following day.
Vaccination strategies were also modelled. It was assumed that only cattle would be
vaccinated, that vaccination would start on day 17 of the outbreak and that it would cover
all known infected properties detected from day 12 of the outbreak. 11 Again, the model
was run 100 times and the average (mean) and the largest outbreaks with vaccination were
taken as representing the range of outcomes with vaccination.
It should be noted that all of the modelled scenarios stemmed from the same introduction
of the virus in Taranaki and that the South Island intentionally remained disease free.
Infected properties were randomly generated in the model. An outbreak can occur at any
location and both Islands may be affected. It needs to be noted that the selection of sites
was randomly generated and does not imply an actual heightened risk of an introduction at
these sites.
Figure 3 shows the cumulative distributions of IP for the medium and large scenarios.
Figure 3: Cumulative distributions of IPs for medium, large and large with vaccination scenarios
Source: AsureQuality and MPI.
11
These are regarded as realistic estimates of the time needed to type the virus, produce a matching vaccine in the UK, acquire and deploy a
vaccine in New Zealand.
Ministry for Primary Industries Foot-and-Mouth Disease Economic Impact Assessment: What it means for New Zealand ● 13Table 3 presents summary data on the incursion scenarios that were modelled.
Table 3: Data on FMD incursion scenarios
Scenarios Small Medium Large Large with Large with
vaccination- vaccination-
to-live to-die
No of infected 1 52 508 153 153
properties (IP)
Duration of 1 50 191 61 61
incursion (days)
IP depopulation
Beef 0 443 8 780 2 083 49 405
Dairy 0 5 048 10 881 15 938 205 228
Deer 0 0 331 121 121
Sheep
9 153 10 775 4 181 4 181
Pigs
Goats 2 34 93 801 801
0 7 407 578 578
Farms in 2 101 2 277 12 478 7 726 7 726
surveillance
zones (10-km
radius)
Coverage Taranaki Taranaki North Island Taranaki and Taranaki and
Auckland Auckland
Sources: AsureQuality and MPI.
In addition, animals will need to be destroyed on dangerous contact premises, on
suspect properties, or those animals that need to be destroyed for animal welfare
reasons. Animal welfare cull numbers are shown in Table 4.
Table 4: Livestock to be destroyed for welfare purposes
Small scenario Medium scenario Large scenario
Lambs 7 550 000 10 900 000 16 500 000
Adult sheep 1 750 000 2 270 000 3 080 000
Cattle and calves 1 090 000 1 790 000 3 070 000
Deer 115 000 239 000 356 000
Source: MPI.
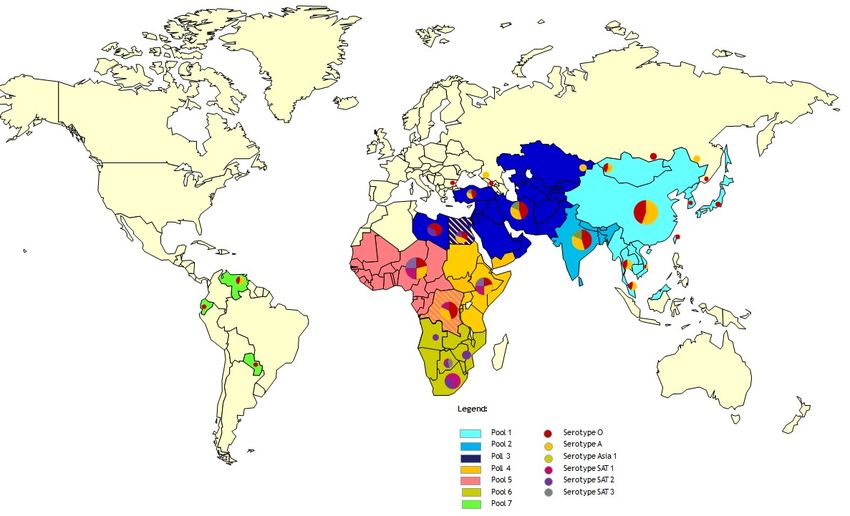
Ministry for Primary Industries Foot-and-Mouth Disease Economic Impact Assessment: What it means for New Zealand ● 14Figure 4 shows the geographical distribution of surveillance zones which are areas within
a ten-kilometre radius of each IP.
Figure 4: Distribution of infected premises within 10-kilometre radius surveillance zones
Ministry for Primary Industries Foot-and-Mouth Disease Economic Impact Assessment: What it means for New Zealand ● 152.3 The economic modelling
The economic modelling is based on the scenarios defined above. It proceeded in two
ways. The initial impacts on production, export losses and government expenditure on
eradication and compensation were modelled using spreadsheets. Then these initial
results were fed into a larger model of the whole economy, operated by the NZIER.
The actual economic cost of a FMD incursion will depend on many unknown factors
including the location, timing and scale of the outbreak, the reaction of processors and
other parties in New Zealand, and the reactions of export partner countries. Economic
modelling requires assumptions to be made in order to estimate the potential scale of
economic cost.
2.3.1 How processors might respond
The hypothetical FMD incursion modelled here was assumed to have taken place on 30
September 2011, which is relatively early in the main dairy season.
The dairy processing industry told us their response would depend on the location and
time of year. FMD would disrupt milk tanker movements and strategic drying-off of herds
may be considered, along with other interventions. The following drying-off assumptions
were used in the modelling:
• Small scenario: all dairy farms within a 10-kilometre surveillance zone.
• Medium scenario: all dairy farms in Taranaki.
• Large scenario without vaccination: all dairying in the whole North Island.
• Large scenario with vaccination: all dairying in the Taranaki and Auckland
regions.
It was also assumed that double pasteurisation would be required (depending on milk
pH) for milk collected from remaining areas of New Zealand. 12 Based on dairy
processing industry advice, a double pasteurisation capacity of 65 percent of peak
season milk production was assumed.
Meat processors indicated that they would close down processing for exports until after
the OIE granted New Zealand FMD freedom and premium overseas meat markets
reopened up again, with only some production for domestic consumption. This was
largely due to uncertainty around financial margins from processing and marketing, and
the risk status to processing facilities being compromised.
2.3.2 How importing countries might respond
The response of importing countries is summarised by the time required for markets to
re-open after FMD-free status is regained. Official FMD freedom is three months after the
last infected animals have been killed. From that date, market re-openings were grouped
into three sets by MPI trade specialists (see Table 5).
12 Double pasteurisation is an OIE and EU requirement for trade. Future amendments may allow first-stage processing to be equivalent to
a second pasteurisation.
Ministry for Primary Industries Foot-and-Mouth Disease Economic Impact Assessment: What it means for New Zealand ● 16Table 5: Dates from incursion to restoration of exports
Scenarios Small Medium Large Large with Large with
vaccination-to- vaccination-
live to-die
First detection 30/9/2011 30/9/2011 30/9/2011 30/9/2011 30/9/2011
Last detection 30/9/2011 19/11/2011 9/4/2012 30/11/2011 30/11/2011
OIE FMD
freedom
31/12/2011 19/2/2012 9/7/2012 31/05/2012 29/02/2012
Number of days until trade start from last detection:
Early trade
start
1 123 days 121 days 122 days 213 days 122 days
Middle trade
start2 152 days 152 days 152 days 244 days 152 days
Late trade
start3 274 days 274 days 275 days 366 days 274 days
Source: MPI.
Notes:
1
Early trade start countries for meat exports to resume. Dairy exports start in the month following the last IP.
2
Middle trade start countries for meat exports to resume. Dairy exports start when OIE declare FMD
freedom.
3
Late trade start countries for meat exports to resume. Dairy exports start six months after the last IP.
There are a number of uncertainties over the decisions by overseas countries to resume
New Zealand imports after a successful eradication of FMD. Notwithstanding New
Zealand’s generally strong reputation and its importance as a supplier, current health
certificates of many trading partners have a clause saying that FMD “does not occur in
New Zealand” and in a few cases that New Zealand has been free of FMD for the
previous 12 months. Industry representatives also raised the possibility of further delays
by market participants to reactivate supply chains and of variation in country recognition
of FMD freedom depending on the scale of FMD incursion and time to eradicate. The
modelling work assumed the New Zealand government could negotiate access
consistent with the dates in Table 2, but further delays (and hence higher costs) could
occur in practice.
2.3.3 Production and export modelling
Models were developed of FMD scenarios on monthly production and monthly exports
for dairy, and for meat and other animal products. The FMD scenarios were each
compared with actual data over the same time period (July 2011 to June 2013) on the
following variables:
• Meat production: slaughter numbers and weights and average carcass weights
for lambs, adult sheep, total cattle and deer.
• Dairy production: milk solids collected for Taranaki, Auckland, the rest of the
North Island and the South Island.
Ministry for Primary Industries Foot-and-Mouth Disease Economic Impact Assessment: What it means for New Zealand ● 17• Exports: volume, value and price and disaggregated by early start, middle start
and late start country destinations.
Exports volumes were assumed to be available in the same month as production.
Domestic consumption of meat was assumed to increase by 15% due to lower prices
during a FMD incursion. FMD presents no food safety risks. It does not pose a risk to
human health and anyway normal meat inspection procedures will ensure that no
diseased animals enter the human food supply.
Other assumptions incorporated into the models include:
• September 2011 export rejection losses (75 percent for meat and 50 percent for
dairy) due to products having been produced in the risk period before the disease
was detected and confirmed;
• A price elasticity of demand for dairy at consumer level in developing countries to
derive the price decline required to clear end of season dairy stocks after meeting
baseline dairy export volumes;
• Potential increases in export availability from inventories created after the last IP
is identified;
• Changed profile of monthly exchange rates during the period from FMD incursion
to the restoration of exports (sharp depreciation and slower recovery); and
• No allowance was made for changes in the world price of the relevant products or
for the possibility that New Zealand might lose its premium status for dairy and
meat exports.
The time path of export value losses are shown in Figures 5 and 6 for meat and dairy
products respectively. In all scenarios losses are negative (i.e. export sales are larger
than without FMD) in the months immediately following market re-opening; this reflects
the build-up of saleable product prior to markets re-opening.
Figure 5: Meat and other products export value losses for FMD scenarios
500
0
-500
Small
$ millions
-1,000 Medium
Large
-1,500
L vacc-to-live
-2,000 L vacc-to-die
-2,500
Dec-11
Dec-12
Jun-11
Sep-11
Jun-12
Sep-12
Jun-13
Sep-13
Mar-12
Mar-13
Sources: Statistics New Zealand and MPI.
Ministry for Primary Industries Foot-and-Mouth Disease Economic Impact Assessment: What it means for New Zealand ● 18Figure 6: Dairy export values for FMD scenarios
3,000
2,000
1,000
0 Small
$ millions
-1,000 Medium
-2,000 Large
L vacc-to-live
-3,000
L vacc-to-die
-4,000
-5,000
Dec-11
Dec-12
Jun-11
Sep-11
Mar-12
Jun-12
Sep-12
Mar-13
Jun-13
Sep-13
Sources: Statistics New Zealand and MPI.
2.3.4 FMD eradication and livestock compensation expenditure
The assumed costs of eradication and compensation are shown in Table 6.
Compensation figures are based on the Inland Revenue Department’s livestock values
for March year 2012.
Table 6: Eradication and livestock compensation
Eradication expenditure Livestock compensation
Small scenario $24.2 million $1,710
Medium scenario $122 million $10.3 million
Large scenario $1,169 million $30.8 million
Large with vaccination-to-live $172 million $21.0 million
Large with vaccination-to-die $249 million $230 million
Sources: AsureQuality, Inland Revenue Department and MPI.
These are minimum estimates and only reflect compensation for destruction of animals
for disease control purposes. Compensation claims would also apply to cases of
slaughter on suspicion of FMD infection, from imposed movement controls and from any
damage to chattels or property during eradication.13 The modelling also omits any
recovery package introduced by the government of the day as would be expected from
extreme adverse events such as the medium and large FMD scenarios.
13 See Appendix 2 for details on compensation under the Biosecurity Act.
Ministry for Primary Industries Foot-and-Mouth Disease Economic Impact Assessment: What it means for New Zealand ● 192.3.5 The Broader Economic Modelling
The above modelling work results in estimates cash costs reflecting lost export earnings
and payments for eradication and compensation. These cash costs and the associated
changes in prices (eg meat prices, exchange rates) create ripple effects throughout the
economy, affecting a wide range of activities, sectoral income levels, and major
aggregates such as GDP. The total effect after all of these ripples have occurred can be
represented using a computable general equilibrium (CGE) model, in this case, the
NZIER’s CGEM. In addition, a macroeconomic model by the New Zealand Treasury was
run with the same inputs for the large scenario (see Appendix 3). All CGE models require
a large number of assumptions, for example about how labour, goods and currency
markets will respond to shocks.
Ministry for Primary Industries Foot-and-Mouth Disease Economic Impact Assessment: What it means for New Zealand ● 20Section 3: Results and Discussion
3.1 NZIER modelling results
Table 7 shows the CGEM estimations for GDP changes in the 2012 year for the whole
economy and the subset of industries directly affected, and total real GDP effects over a
longer time horizon to 2020.
Table 7: GDP results for FMD incursion scenarios
$ Billion
Total economy, Direct industries, Total economy, real,
nominal, 2012 nominal, 2012 NPV, 2012 to 2020
Small -$5.8 -$1.6 -$6.1
Medium -$8.0 -$2.5 -$8.2
Large -$13.8 -$5.8 -$16.2
Vaccination-to-live -$11.3 -$4.3 -$10.5
Vaccination-to-die -$9.1 -$3.3 -$8.7
Earlier FMD free -$13.1 -$5.3 -$15.6
recognition for the
1
South Island
1
This scenario is a modification of the large scenario whereby the South Island is declared FMD free
enabling an earlier start to export trade.
Sources: NZIER and MPI.
CGEM also estimated the impact on other macroeconomic variables, as shown in Table
8.
Table 8: Macroeconomic results for year ended June 2012
Percentage change relative to baseline
South
Vaccination Vaccination
Small Medium Large Island
-to-live -to-die
free
Private consumption -4.7 -6.7 -12.2 -9.6 -7.7 -11.5
Investment -2.4 -3.2 -4.6 -4.1 -3.6 -4.4
Government
consumption
0.1 0.3 3.1 0.5 0.7 3.1
Exports (volumes) -4.4 -6.3 -12.6 -8.8 -7.3 -12.1
Imports (volumes) -3.6 -5.1 -9.5 -7.4 -5.9 -9.0
GDP (volumes) -3.0 -4.3 -7.8 -6.1 -4.9 -7.3
Real exchange rate -8.5 -11.9 -20.2 -16.4 -13.4 -19.3
Terms of trade -1.7 -2.4 -4.0 -3.3 -2.7 -3.9
Employment -2.4 -3.3 -5.0 -4.3 -3.6 -4.8
Source: NZIER.
Ministry for Primary Industries Foot-and-Mouth Disease Economic Impact Assessment: What it means for New Zealand ● 21Notable findings here include a real exchange rate depreciation of 20 percent in the large
scenario, a 4 percent reduction in terms of trade and a 5 percent fall in employment. All
of these effects were temporary.
The structure of CGEM permitted further investigation at the level of industries. Table 9
shows the predicted effect of the large scenario on GDP for industries (i.e. value added)
arranged into several groups. Four of the five directly affected industries were expected
to suffer large contractions of around 70 percent in the year to June 2012.
Table 9: Industry impacts – value added and employment impacts in the year to June 2012
Selected industries, percentage change of large scenario relative to baseline
Value added Employment
Directly affected industries
Sheep, beef and grain farming -70.2 -20.5
Dairy cattle farming -75.8 -23.4
Poultry, deer and other livestock farming* -21.3 -6.4
Meat and meat product manufacturing -69.0 -79.1
Dairy product manufacturing -77.5 -86.8
Supplying industries
Agricultural services -26.4 -39.5
Fertiliser and pesticides -1.4 -3.1
Fuel retailing -22.0 -27.1
Electricity -3.0 -13.5
Banking financing and investing -5.3 -14.5
Competing industries
Horticulture 1.0 6.5
Fishing 1.0 5.7
Clothing 12.8 20.6
Wood product manufacturing 12.2 20.1
Machinery and equip manufacturing 2
11.6 18.0
Tourism industries
Accommodation 4.7 7.9
Travel services 10.2 15.1
Restaurant and bars -2.2 -3.1
Household expenditure industries
Supermarkets -10.4 -16.3
Grocery wholesaling -9.2 -12.5
Sport and recreation -6.5 -8.6
Real estate -2.7 -7.3
Source: NZIER.
Note:
*Other livestock farming includes pig farming.
Ministry for Primary Industries Foot-and-Mouth Disease Economic Impact Assessment: What it means for New Zealand ● 22Employment losses at the farm level were limited because of the high proportion of self-
employment, but incomes were lower. Deer and pig farming cannot be separated out.
MPI estimated that value added for deer farming would fall about 75 percent. Pig farming
might not be impacted much other than by lower prices as little pig meat was exported
and over 40 percent of domestic consumption came from imports. Processing for
domestic consumption was assumed to continue with little interruption. Domestic meat
prices would have decreased due to abundant supply of red meats. Lower competitive
meat prices together with depreciated exchange rates would have reduced the demand
for and supply of pig meat imports and domestic pig meat prices might have increased
relative to other meats.
Much larger drops in employment at meat and dairy processors occurred because of the
higher ratio of employees to owners. The drops of around 80 percent shown in Table 8
for these processors convert to 23,400 (meat) and 10,000 (dairy) short-term job losses.
In aggregate, value added from these five directly impacted industries decreased by
$5.8 billion, 41 percent of the total fall of $13.8 billion, and employment decreased by
around 50,400 jobs in the first year.
A range of upstream industries supply goods and services to the directly impacted
industries and incurred losses as a consequence of a FMD incursion. Significant value
added losses were estimated for agricultural services (down 26.4 percent) and fuel
retailing (down 22 percent), but less so for electricity (down 3 percent) and fertiliser and
pesticides (down 1.4 percent). The latter were lower than first expected because a lower
exchange rate encouraged a shift from imported to local manufacturing and the industry
definition included other chemical products.
Value added for the banking industry was estimated to contract 5.3 percent. The CGEM
does not include debt levels or loan defaults and their ramifications on the banking
industry and wider economy. However, MPI has supplied input data to the ANZ Bank
who are testing the robustness of their financial systems to a FMD incursion.
There were other export industries that were not affected by FMD incursion, but would
benefit from exchange rate depreciation and lower prices that arose from reduced
competition for intermediate goods and services, labour and capital. The short-term
nature of the FMD incursion means that expansion in some industries was constrained.
For example, fishing was constrained by quotas and horticulture by the current planting
and harvest. On MPI advice, the CGEM output was constrained accordingly. By contrast,
manufacturing industries such as clothing, wood product manufacturing, and machinery
and equipment manufacturing were better able to respond to favourable exchange rates
and cheaper primary and intermediate inputs and expanded their value added by 12.8
percent, 12.2 percent and 9.4 percent, respectively.
Tourism industries such as accommodation and travel services were estimated to
expand value added by 10.2 percent and 4.7 percent, with employment up 15.1 percent
and 7.9 percent, respectively. However, restaurants and bars contract because the fall in
domestic household spending was greater than the increase in tourism spending. Value
added was down 2.2 percent and employment was down 3.1 percent.
Ministry for Primary Industries Foot-and-Mouth Disease Economic Impact Assessment: What it means for New Zealand ● 23A FMD incursion caused household expenditure industries to suffer in the year to June
2012. Lower incomes in farm, processing and supplying industries left households with
lower disposable incomes to spend.
Ministry for Primary Industries Foot-and-Mouth Disease Economic Impact Assessment: What it means for New Zealand ● 243.2 Discussion
Figure 7 compares real GDP growth against what happened to New Zealand during the
global financial crisis in 2008-09. The CGEM estimated that the large FMD scenario
would put the New Zealand economy into recession. Real GDP would have decreased 5
percent from June years 2011 to 2012 and increased 2.7 percent in the next year. This
exceeds the 2.2% fall in real GDP New Zealand experienced during the global financial
crisis.
Figure 7: Real GDP annual percent change baseline and FMD large scenario impacts
4.0%
3.0%
2.0%
1.0%
Annual changes
0.0%
-1.0%
Baseline
-2.0%
NZIER
-3.0%
GFC
-4.0%
-5.0%
-6.0%
2007 2008 2009 2010 2011 2012 2013
June years
Sources: Statistics New Zealand, NZIER, and MPI.
The broad pattern of economic impact estimated by these models is considered reliable.
There is likely to be a substantial loss of income, with most of the effect falling on the
primary sector and agricultural processors. World prices of affected commodities are
likely to increase, and domestic prices to fall. New Zealand’s exchange rate would fall.
It is also clear that the estimates above understate costs because no estimates were
available for the cost of destroying animals on suspicion, for movement controls, or for
any recovery package announced by the government of the day.
Uncertainties
The primary uncertainties over the economic impacts arise from the scale of the
outbreak, which affects the cost of stamping out, and the time before export markets re-
open. Some insight into these uncertainties can be gained by plotting the estimated
losses against the duration of each scenario (i.e. the time from outbreak to eradication).
Figure 8 shows this relationship using real GDP predictions (NPV of real GDP effects to
June 2020) from the CGEM. It suggests a broadly linear relationship which could be
extrapolated to estimate the cost of outbreaks of longer duration.
Ministry for Primary Industries Foot-and-Mouth Disease Economic Impact Assessment: What it means for New Zealand ● 25Figure 8: NPV of real GDP 2012 to 2020 by days of FMD incursion for scenarios
18
16
14
Large
Vaccination
12
to live
$ billions
10
8 Small to die
6 Medium
4
2
0
0 50 100 150 200 250
Days of FMD incursion
Sources: NZIER and MPI.
Whatever the scale of a FMD outbreak, there will be uncertainty over the timing of export
markets re-opening.
On the positive side of this issue:
• New Zealand export industries and MPI have a good international reputation for
biosecurity, animal health and welfare, and food safety;
• We are also recognised as strong advocates for reducing trade barriers and
leading by example;
• The temporary cessation of dairy and meat exports from New Zealand is
expected to drive up global prices and create pressure for re-opening; and
• In some countries it might be possible to sell some product at lower prices before
FMD status is regained.
However there are also negative possibilities including:
• Countries could take longer than assumed to recognise New Zealand as FMD
free;
• The time taken to accept New Zealand’s FMD free status may vary with the size
of outbreak; and
• It may take longer than assumed to re-establish supply and value chains after
FMD recognition.
The results of this economic impact assessment must also be viewed within the constraints
of the modelling. As outlined by Schley, reviews and critiques of disease models appear
regularly in the scientific literature (Morris et al, 2001; Green and Medley, 2002; Kao, 2002;
Moutou and Durand, 2002; Kostova, 2004; Perez et al, 2004; Bronsvoort, 2005; Keeling,
2005; Taylor, 2005). Keeling (2005) notes that models are neither infallible nor a panacea
and it is therefore important that decision-makers who use the results of model outcomes
Ministry for Primary Industries Foot-and-Mouth Disease Economic Impact Assessment: What it means for New Zealand ● 26and those affected by the decisions, understand both the uses and limitations of the
particular model.
Factors that influence economic costs
The epidemiological impact of FMD depends on the following factors that could influence the
size of an outbreak:
• the point of entry of the virus into New Zealand;
• the strain of virus involved;
• the species of animal(s) affected;
• climatic conditions;
• how rapidly it is detected;
• the animal movements that have occurred before its detection;
• the time of year at which the outbreak occurs;
• the animal populations and farming systems in the area where the disease is introduced;
• the speed at which disease controls are implemented;
• the compliance with disease control measures; and
• the efficacy of the disease control measures.
In terms of response to an outbreak, the economic costs will depend on:
• how many livestock need to be destroyed on farms for animal welfare reasons;
• whether meat processors would be paid to slaughter livestock and render down to
tallow and meat meal;
• how extensive the drying off of milking herds would be; and
• whether double pasteurisation would be required.
Importance of preparedness work
The large economic costs associated with a FMD outbreak reaffirm the benefits of
prevention efforts. These include pre-border measures, stringent controls at the border,
regulations governing the feeding of waste food to pigs, and surveillance with the aim of
rapid detection in the event of an incursion of the virus. The modelling also outlines the value
in preparing to deal with an outbreak – the higher the level of preparedness, the greater the
likelihood of mounting an effective response, which will help limit the size of the outbreak.
It would be critically important to resume trade as quickly as possible after FMD has been
eradicated and therefore necessary for MPI to negotiate with trading partners over their
acceptance of New Zealand’s restored FMD-free status by the OIE.
Ministry for Primary Industries Foot-and-Mouth Disease Economic Impact Assessment: What it means for New Zealand ● 27Section 4: Next steps 4.1 Development of a New Zealand FMD Response Strategy The significant costs of a FMD incursion to New Zealand are not unexpected. This modelling has highlighted the wide impacts of the disease on a broad range of sectors, as well as its potential social impacts across the whole of New Zealand. It has provided information on the scale of disruption to the primary processing industries, and gives an idea of the large scale of stock numbers that will need to be managed as animals can no longer be processed for export. The review has highlighted the need for a reassessment of our current FMD response strategy, and a consideration of alternative or complementary strategies to our current approach. This includes the consideration of alternative or complementary disease management strategies such as vaccination, and the use of impact mitigation measures such as disease-free zoning in the event of an outbreak to reduce the economic impacts of the disease. 4.2 New Zealand’s current FMD vaccination policy and consideration of alternative strategies New Zealand is recognised by the OIE and by our trading partners as a FMD-free country where vaccination is not practised. FMD vaccine cannot be used pre-emptively before an outbreak occurs. MPI’s current FMD policy affirms that vaccine against FMD will not be used preventatively in an outbreak, but that vaccine may be used in an outbreak as a means to “buy time” where animal culling and disposal resources are overwhelmed by the number of properties that have become infected. Vaccination helps slow the spread of the disease and therefore allows culling to catch up to reduce the risk of further spread. The benefits of “buying time” need to be weighed up against the number of vaccinated animals that need to be culled. All susceptible animals on infected properties will still need to be culled in accordance with the stamping-out disease control policy. The OIE FMD Code currently does not encourage the use of a vaccinate-to-live policy (Geale et al, 2013). A vaccinate-to-live policy is a policy where animals that have been vaccinated against FMD in an outbreak are not culled, but are allowed to live to the end of their productive lives. The minimum time before which an official OIE return to freedom can be applied for is three months after the last FMD case or vaccinated animal has been culled where a vaccinate-to-die policy has been applied, as opposed to six months after the last case and animal was vaccinated for a vaccinate-to-live policy. This is after surveillance in accordance with OIE requirements has been undertaken, to provide a high level of certainty that the disease has been eradicated. Ministry for Primary Industries Foot-and-Mouth Disease Economic Impact Assessment: What it means for New Zealand ● 28
You can also read